Downieville Lawson Dumont, CO Map & Demographics
Downieville Lawson Dumont Map
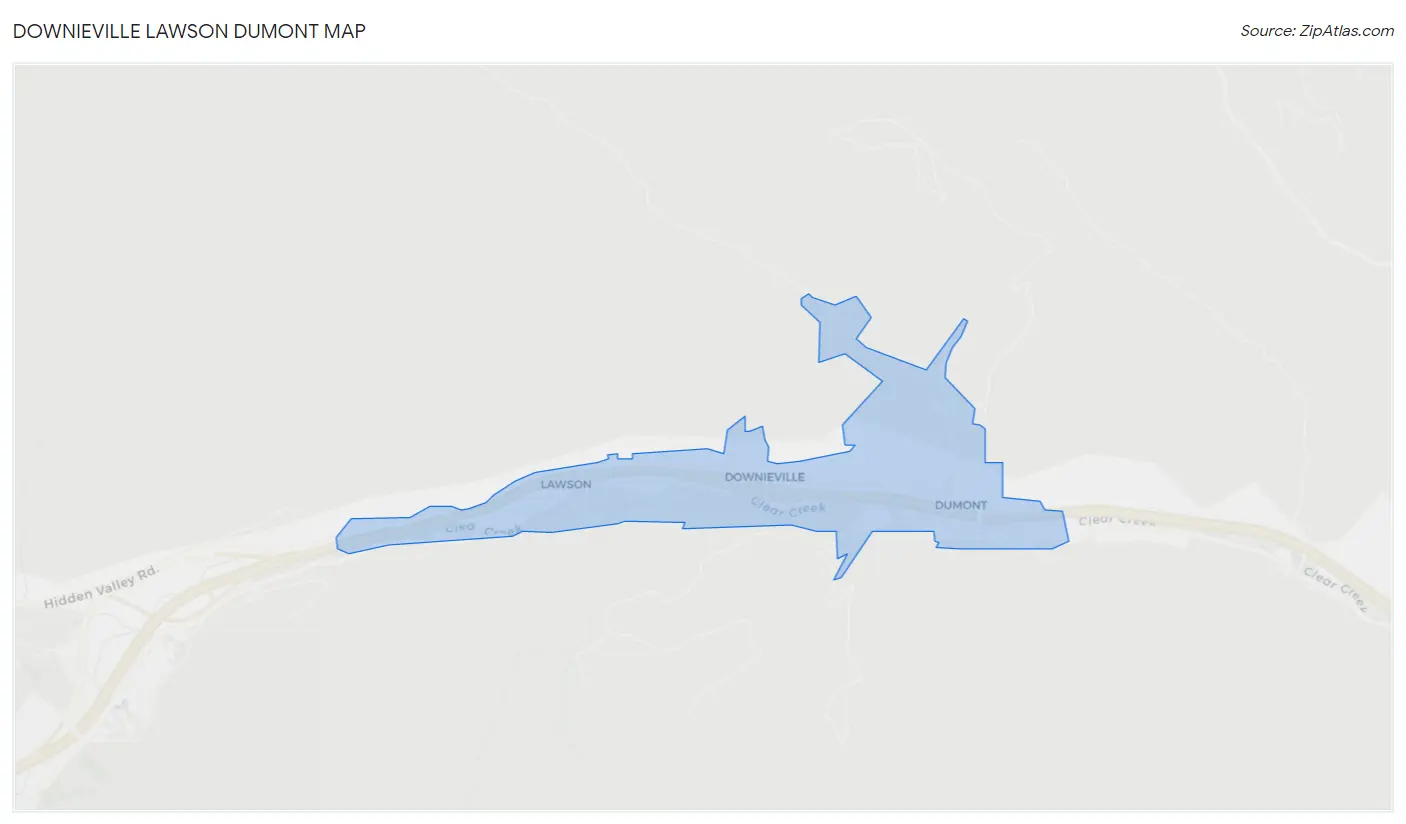
Downieville Lawson Dumont Overview
$43,417
PER CAPITA INCOME
$54,868
AVG HOUSEHOLD INCOME
0.47
INEQUALITY / GINI INDEX
558
TOTAL POPULATION
275
MALE POPULATION
283
FEMALE POPULATION
97.17
MALES / 100 FEMALES
102.91
FEMALES / 100 MALES
52.8
MEDIAN AGE
3.2
AVG FAMILY SIZE
2.1
AVG HOUSEHOLD SIZE
364
LABOR FORCE [ PEOPLE ]
67.3%
PERCENT IN LABOR FORCE
Income in Downieville Lawson Dumont
Income Overview in Downieville Lawson Dumont
| Characteristic | Number | Measure |
| Per Capita Income | 558 | $43,417 |
| Median Family Income | 136 | $0 |
| Mean Family Income | 136 | $108,115 |
| Median Household Income | 264 | $54,868 |
| Mean Household Income | 264 | $68,496 |
| Income Deficit | 136 | $0 |
| Wage / Income Gap (%) | 558 | 0.00% |
| Wage / Income Gap ($) | 558 | 100.00¢ per $1 |
| Gini / Inequality Index | 558 | 0.47 |
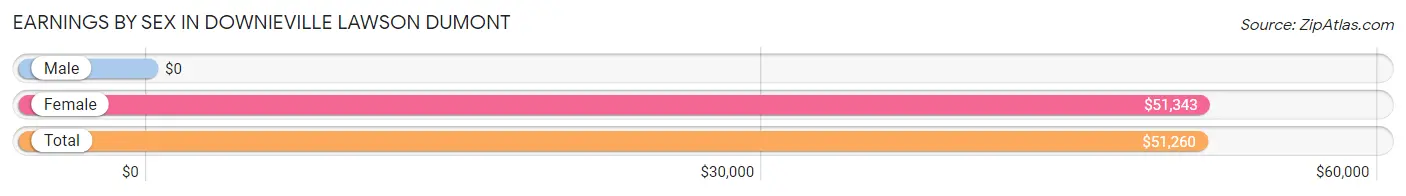
Earnings by Sex in Downieville Lawson Dumont
| Sex | Number | Average Earnings |
| Male | 174 (47.8%) | $0 |
| Female | 190 (52.2%) | $51,343 |
| Total | 364 (100.0%) | $51,260 |
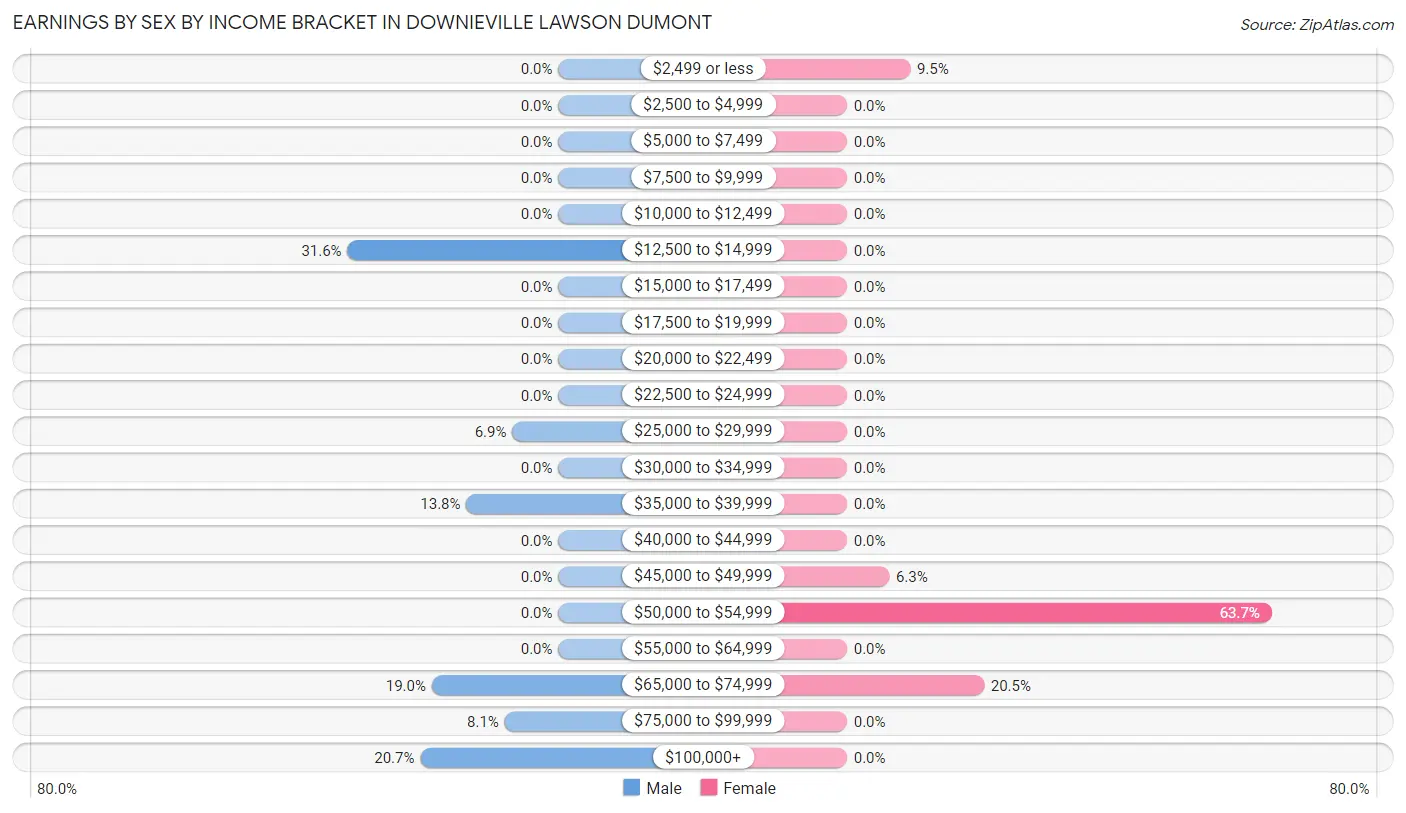
Earnings by Sex by Income Bracket in Downieville Lawson Dumont
The most common earnings brackets in Downieville Lawson Dumont are $12,500 to $14,999 for men (55 | 31.6%) and $50,000 to $54,999 for women (121 | 63.7%).
| Income | Male | Female |
| $2,499 or less | 0 (0.0%) | 18 (9.5%) |
| $2,500 to $4,999 | 0 (0.0%) | 0 (0.0%) |
| $5,000 to $7,499 | 0 (0.0%) | 0 (0.0%) |
| $7,500 to $9,999 | 0 (0.0%) | 0 (0.0%) |
| $10,000 to $12,499 | 0 (0.0%) | 0 (0.0%) |
| $12,500 to $14,999 | 55 (31.6%) | 0 (0.0%) |
| $15,000 to $17,499 | 0 (0.0%) | 0 (0.0%) |
| $17,500 to $19,999 | 0 (0.0%) | 0 (0.0%) |
| $20,000 to $22,499 | 0 (0.0%) | 0 (0.0%) |
| $22,500 to $24,999 | 0 (0.0%) | 0 (0.0%) |
| $25,000 to $29,999 | 12 (6.9%) | 0 (0.0%) |
| $30,000 to $34,999 | 0 (0.0%) | 0 (0.0%) |
| $35,000 to $39,999 | 24 (13.8%) | 0 (0.0%) |
| $40,000 to $44,999 | 0 (0.0%) | 0 (0.0%) |
| $45,000 to $49,999 | 0 (0.0%) | 12 (6.3%) |
| $50,000 to $54,999 | 0 (0.0%) | 121 (63.7%) |
| $55,000 to $64,999 | 0 (0.0%) | 0 (0.0%) |
| $65,000 to $74,999 | 33 (19.0%) | 39 (20.5%) |
| $75,000 to $99,999 | 14 (8.1%) | 0 (0.0%) |
| $100,000+ | 36 (20.7%) | 0 (0.0%) |
| Total | 174 (100.0%) | 190 (100.0%) |
Earnings by Sex by Educational Attainment in Downieville Lawson Dumont
| Educational Attainment | Male Income | Female Income |
| Less than High School | - | - |
| High School Diploma | - | - |
| College or Associate's Degree | - | - |
| Bachelor's Degree | - | - |
| Graduate Degree | - | - |
| Total | - | - |
Family Income in Downieville Lawson Dumont
Family Income Brackets in Downieville Lawson Dumont
According to the Downieville Lawson Dumont family income data, there are 70 families falling into the $50,000 to $74,999 income range, which is the most common income bracket and makes up 51.5% of all families.
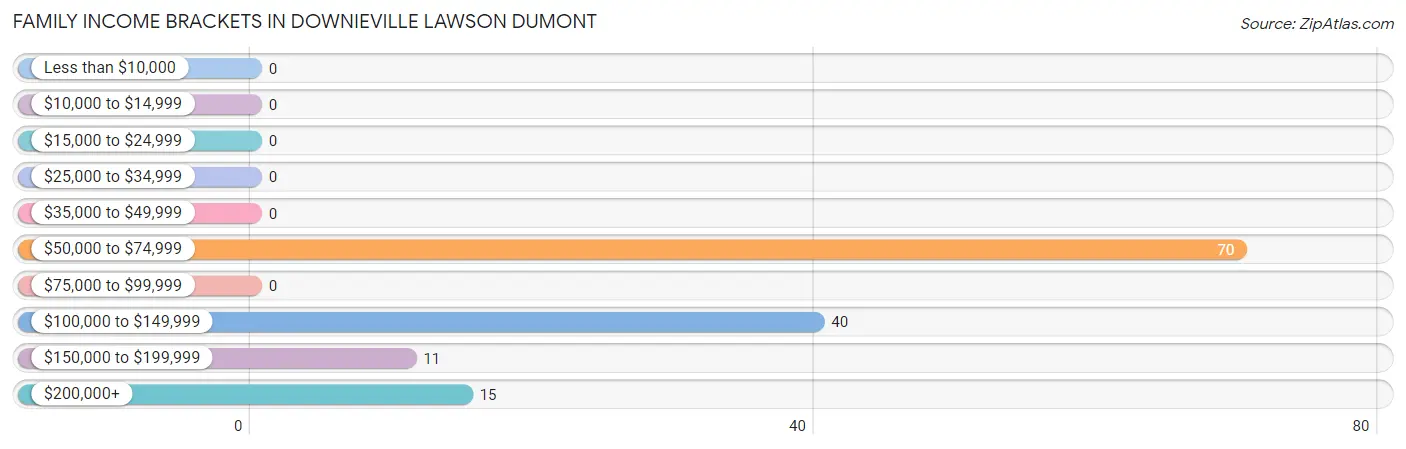
| Income Bracket | # Families | % Families |
| Less than $10,000 | 0 | 0.0% |
| $10,000 to $14,999 | 0 | 0.0% |
| $15,000 to $24,999 | 0 | 0.0% |
| $25,000 to $34,999 | 0 | 0.0% |
| $35,000 to $49,999 | 0 | 0.0% |
| $50,000 to $74,999 | 70 | 51.5% |
| $75,000 to $99,999 | 0 | 0.0% |
| $100,000 to $149,999 | 40 | 29.4% |
| $150,000 to $199,999 | 11 | 8.1% |
| $200,000+ | 15 | 11.0% |
Family Income by Famaliy Size in Downieville Lawson Dumont
3-person families (64 | 47.1%) account for the highest median family income in Downieville Lawson Dumont with $123,482 per family, while 3-person families (64 | 47.1%) have the highest median income of $41,161 per family member.
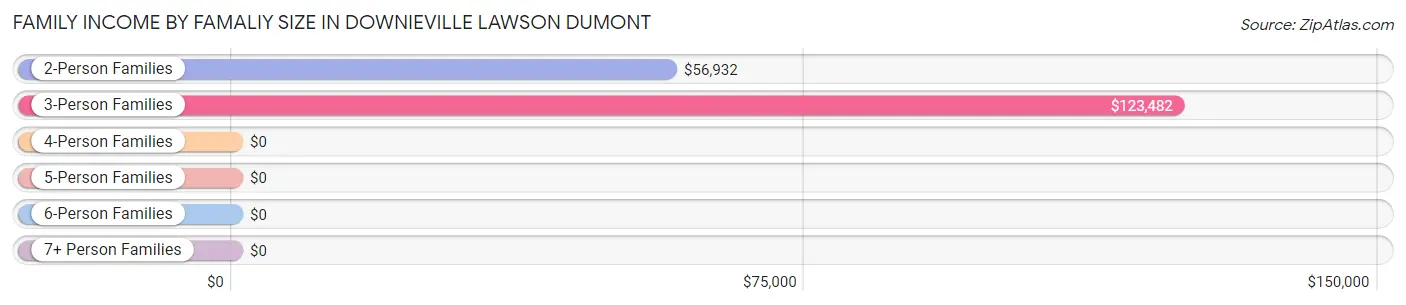
| Income Bracket | # Families | Median Income |
| 2-Person Families | 72 (52.9%) | $56,932 |
| 3-Person Families | 64 (47.1%) | $123,482 |
| 4-Person Families | 0 (0.0%) | $0 |
| 5-Person Families | 0 (0.0%) | $0 |
| 6-Person Families | 0 (0.0%) | $0 |
| 7+ Person Families | 0 (0.0%) | $0 |
| Total | 136 (100.0%) | $0 |
Family Income by Number of Earners in Downieville Lawson Dumont
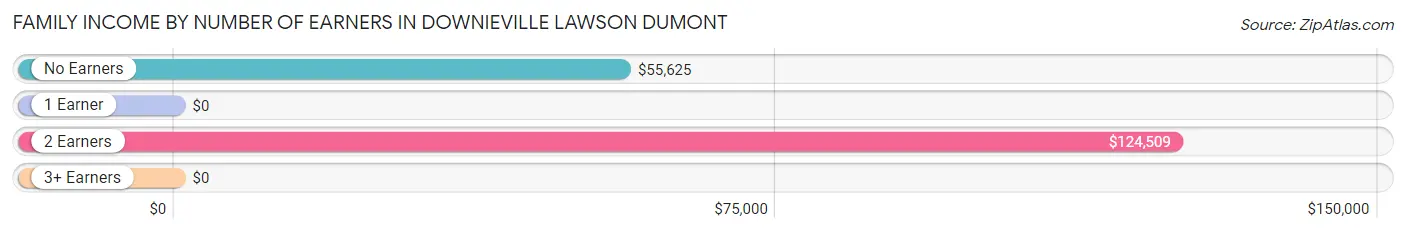
| Number of Earners | # Families | Median Income |
| No Earners | 49 (36.0%) | $55,625 |
| 1 Earner | 0 (0.0%) | $0 |
| 2 Earners | 87 (64.0%) | $124,509 |
| 3+ Earners | 0 (0.0%) | $0 |
| Total | 136 (100.0%) | $0 |
Household Income in Downieville Lawson Dumont
Household Income Brackets in Downieville Lawson Dumont
With 70 households falling in the category, the $50,000 to $74,999 income range is the most frequent in Downieville Lawson Dumont, accounting for 26.5% of all households. In contrast, only 11 households (4.2%) fall into the $150,000 to $199,999 income bracket, making it the least populous group.
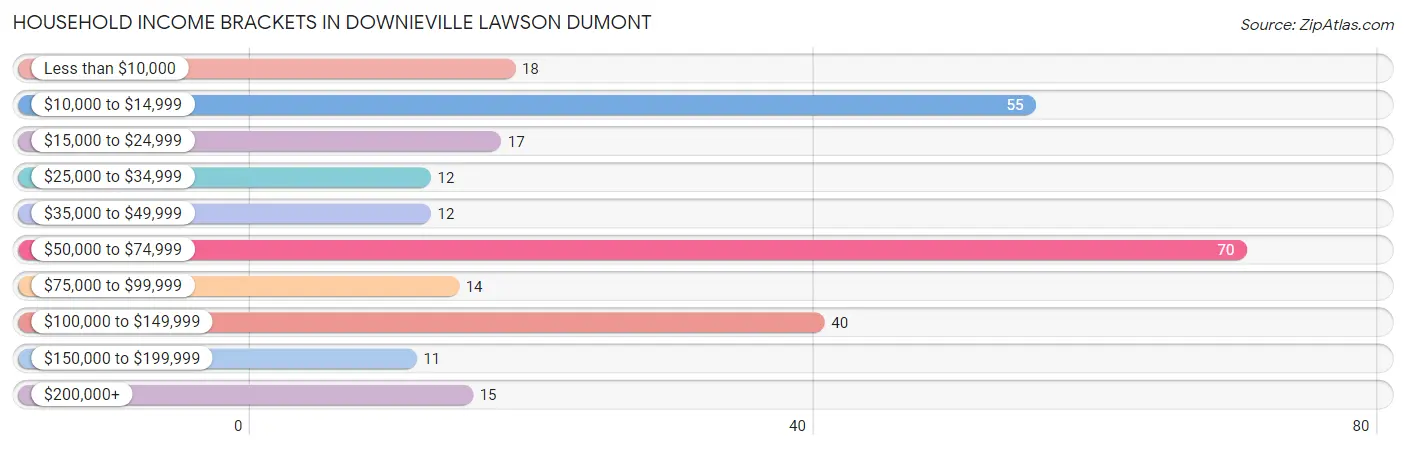
| Income Bracket | # Households | % Households |
| Less than $10,000 | 18 | 6.8% |
| $10,000 to $14,999 | 55 | 20.8% |
| $15,000 to $24,999 | 17 | 6.4% |
| $25,000 to $34,999 | 12 | 4.5% |
| $35,000 to $49,999 | 12 | 4.5% |
| $50,000 to $74,999 | 70 | 26.5% |
| $75,000 to $99,999 | 14 | 5.3% |
| $100,000 to $149,999 | 40 | 15.2% |
| $150,000 to $199,999 | 11 | 4.2% |
| $200,000+ | 15 | 5.7% |
Household Income by Householder Age in Downieville Lawson Dumont
The median household income in Downieville Lawson Dumont is $54,868, with the highest median household income of $56,250 found in the 65+ years age bracket for the primary householder. A total of 94 households (35.6%) fall into this category.
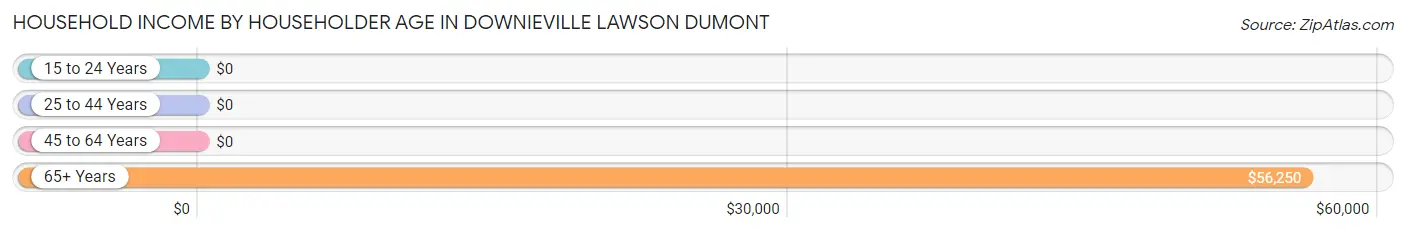
| Income Bracket | # Households | Median Income |
| 15 to 24 Years | 0 (0.0%) | $0 |
| 25 to 44 Years | 88 (33.3%) | $0 |
| 45 to 64 Years | 82 (31.1%) | $0 |
| 65+ Years | 94 (35.6%) | $56,250 |
| Total | 264 (100.0%) | $54,868 |
Poverty in Downieville Lawson Dumont
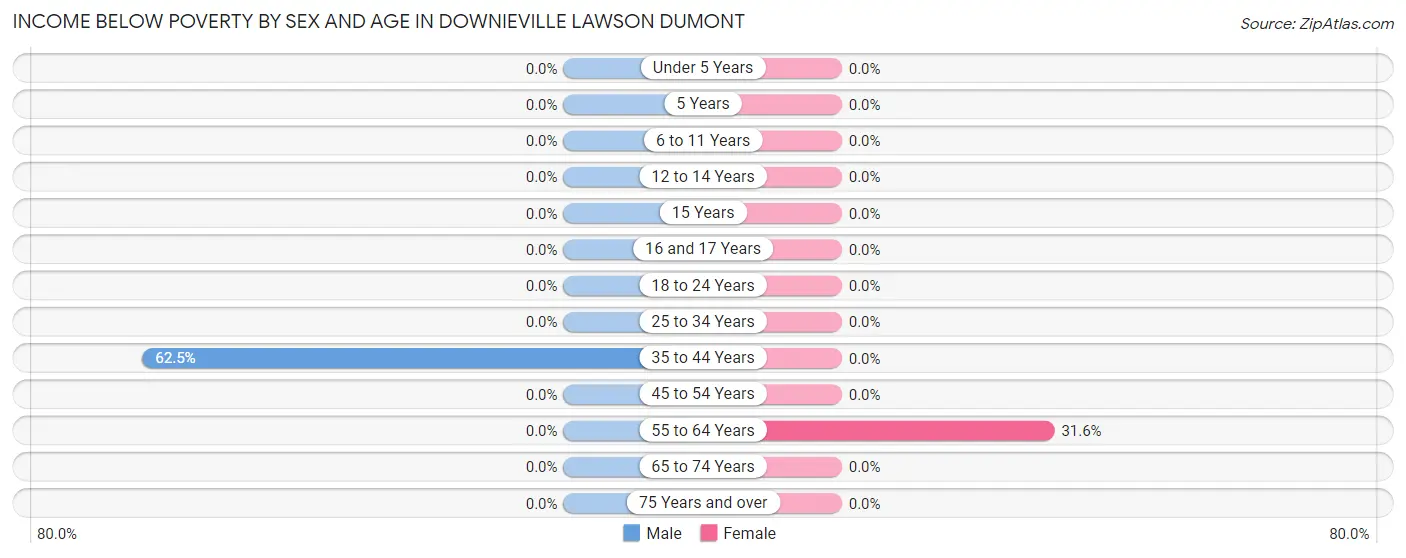
Income Below Poverty by Sex and Age in Downieville Lawson Dumont
With 20.0% poverty level for males and 6.4% for females among the residents of Downieville Lawson Dumont, 35 to 44 year old males and 55 to 64 year old females are the most vulnerable to poverty, with 55 males (62.5%) and 18 females (31.6%) in their respective age groups living below the poverty level.
| Age Bracket | Male | Female |
| Under 5 Years | 0 (0.0%) | 0 (0.0%) |
| 5 Years | 0 (0.0%) | 0 (0.0%) |
| 6 to 11 Years | 0 (0.0%) | 0 (0.0%) |
| 12 to 14 Years | 0 (0.0%) | 0 (0.0%) |
| 15 Years | 0 (0.0%) | 0 (0.0%) |
| 16 and 17 Years | 0 (0.0%) | 0 (0.0%) |
| 18 to 24 Years | 0 (0.0%) | 0 (0.0%) |
| 25 to 34 Years | 0 (0.0%) | 0 (0.0%) |
| 35 to 44 Years | 55 (62.5%) | 0 (0.0%) |
| 45 to 54 Years | 0 (0.0%) | 0 (0.0%) |
| 55 to 64 Years | 0 (0.0%) | 18 (31.6%) |
| 65 to 74 Years | 0 (0.0%) | 0 (0.0%) |
| 75 Years and over | 0 (0.0%) | 0 (0.0%) |
| Total | 55 (20.0%) | 18 (6.4%) |
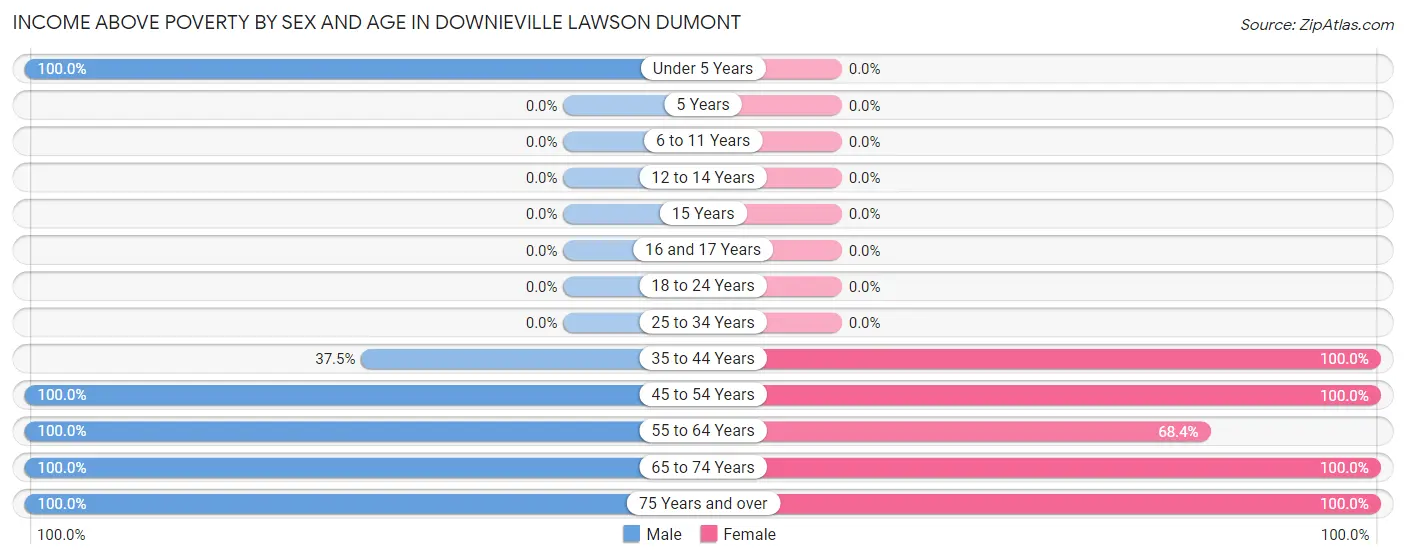
Income Above Poverty by Sex and Age in Downieville Lawson Dumont
According to the poverty statistics in Downieville Lawson Dumont, males aged under 5 years and females aged 35 to 44 years are the age groups that are most secure financially, with 100.0% of males and 100.0% of females in these age groups living above the poverty line.
| Age Bracket | Male | Female |
| Under 5 Years | 17 (100.0%) | 0 (0.0%) |
| 5 Years | 0 (0.0%) | 0 (0.0%) |
| 6 to 11 Years | 0 (0.0%) | 0 (0.0%) |
| 12 to 14 Years | 0 (0.0%) | 0 (0.0%) |
| 15 Years | 0 (0.0%) | 0 (0.0%) |
| 16 and 17 Years | 0 (0.0%) | 0 (0.0%) |
| 18 to 24 Years | 0 (0.0%) | 0 (0.0%) |
| 25 to 34 Years | 0 (0.0%) | 0 (0.0%) |
| 35 to 44 Years | 33 (37.5%) | 18 (100.0%) |
| 45 to 54 Years | 72 (100.0%) | 133 (100.0%) |
| 55 to 64 Years | 14 (100.0%) | 39 (68.4%) |
| 65 to 74 Years | 64 (100.0%) | 67 (100.0%) |
| 75 Years and over | 20 (100.0%) | 8 (100.0%) |
| Total | 220 (80.0%) | 265 (93.6%) |
Income Below Poverty Among Married-Couple Families in Downieville Lawson Dumont
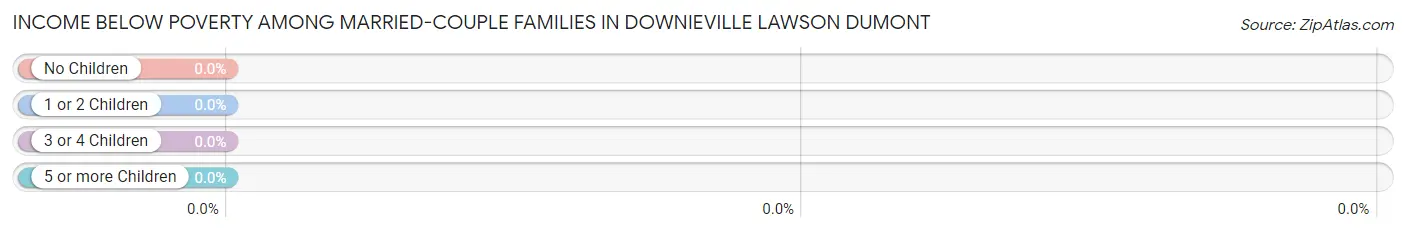
| Children | Above Poverty | Below Poverty |
| No Children | 87 (100.0%) | 0 (0.0%) |
| 1 or 2 Children | 21 (100.0%) | 0 (0.0%) |
| 3 or 4 Children | 0 (0.0%) | 0 (0.0%) |
| 5 or more Children | 0 (0.0%) | 0 (0.0%) |
| Total | 108 (100.0%) | 0 (0.0%) |
Income Below Poverty Among Single-Parent Households in Downieville Lawson Dumont
| Children | Single Father | Single Mother |
| No Children | 0 (0.0%) | 0 (0.0%) |
| 1 or 2 Children | 0 (0.0%) | 0 (0.0%) |
| 3 or 4 Children | 0 (0.0%) | 0 (0.0%) |
| 5 or more Children | 0 (0.0%) | 0 (0.0%) |
| Total | 0 (0.0%) | 0 (0.0%) |
Income Below Poverty Among Married-Couple vs Single-Parent Households in Downieville Lawson Dumont
| Children | Married-Couple Families | Single-Parent Households |
| No Children | 0 (0.0%) | 0 (0.0%) |
| 1 or 2 Children | 0 (0.0%) | 0 (0.0%) |
| 3 or 4 Children | 0 (0.0%) | 0 (0.0%) |
| 5 or more Children | 0 (0.0%) | 0 (0.0%) |
| Total | 0 (0.0%) | 0 (0.0%) |
Race in Downieville Lawson Dumont
The most populous races in Downieville Lawson Dumont are White / Caucasian (448 | 80.3%), Hispanic or Latino (232 | 41.6%), and Native / Alaskan (55 | 9.9%).
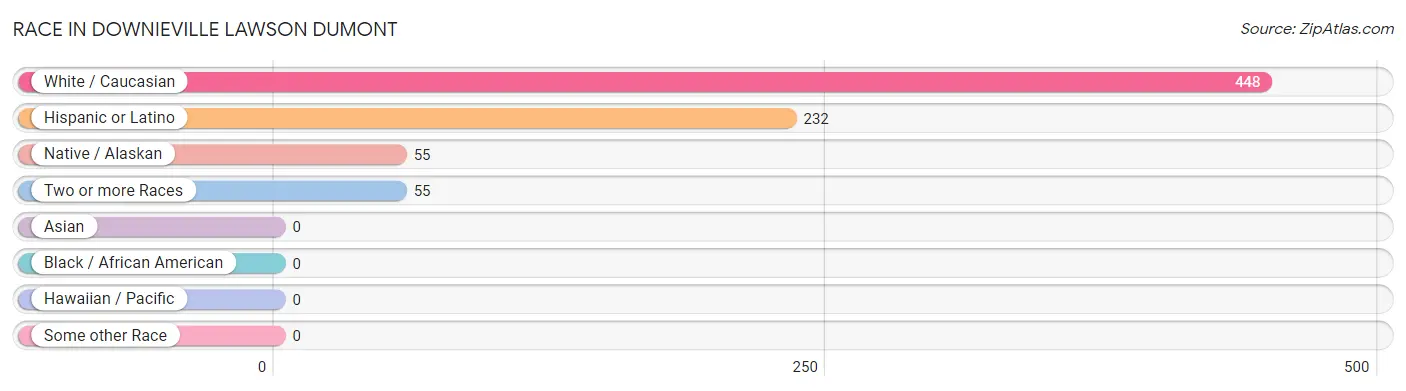
| Race | # Population | % Population |
| Asian | 0 | 0.0% |
| Black / African American | 0 | 0.0% |
| Hawaiian / Pacific | 0 | 0.0% |
| Hispanic or Latino | 232 | 41.6% |
| Native / Alaskan | 55 | 9.9% |
| White / Caucasian | 448 | 80.3% |
| Two or more Races | 55 | 9.9% |
| Some other Race | 0 | 0.0% |
| Total | 558 | 100.0% |
Ancestry in Downieville Lawson Dumont
The most populous ancestries reported in Downieville Lawson Dumont are Spaniard (138 | 24.7%), American (136 | 24.4%), Mexican (94 | 16.9%), Mexican American Indian (39 | 7.0%), and French (32 | 5.7%), together accounting for 78.7% of all Downieville Lawson Dumont residents.
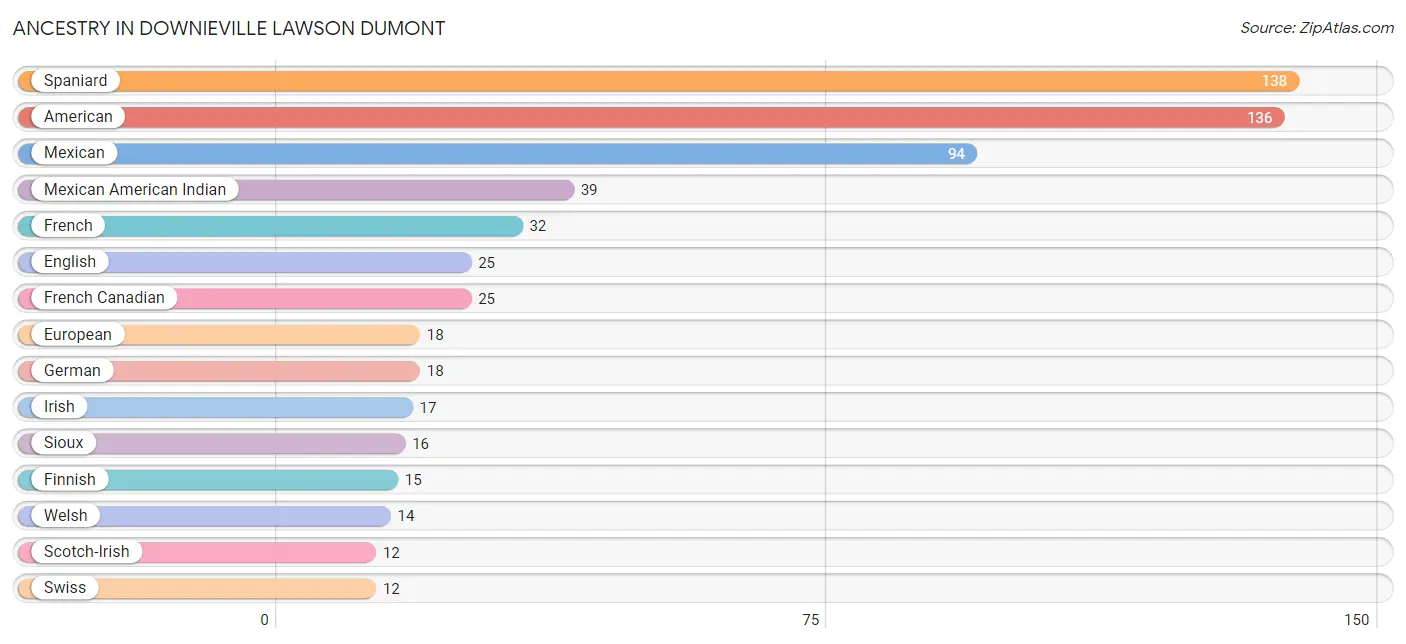
| Ancestry | # Population | % Population |
| American | 136 | 24.4% |
| English | 25 | 4.5% |
| European | 18 | 3.2% |
| Finnish | 15 | 2.7% |
| French | 32 | 5.7% |
| French Canadian | 25 | 4.5% |
| German | 18 | 3.2% |
| Irish | 17 | 3.0% |
| Mexican | 94 | 16.9% |
| Mexican American Indian | 39 | 7.0% |
| Scotch-Irish | 12 | 2.1% |
| Sioux | 16 | 2.9% |
| Spaniard | 138 | 24.7% |
| Swiss | 12 | 2.1% |
| Welsh | 14 | 2.5% | View All 15 Rows |
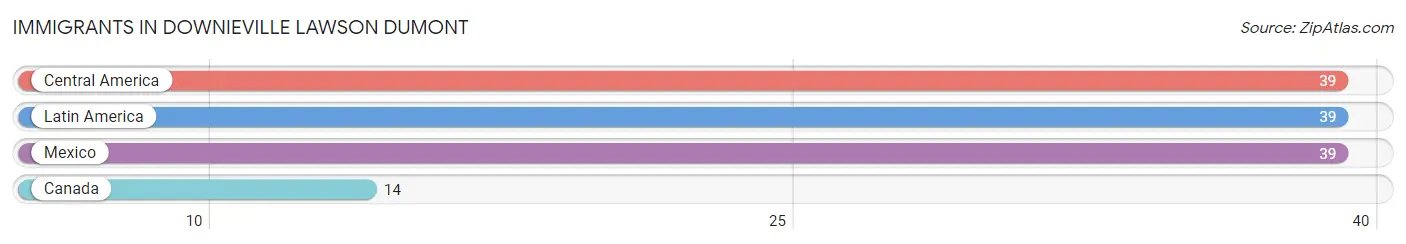
Immigrants in Downieville Lawson Dumont
The most numerous immigrant groups reported in Downieville Lawson Dumont came from Central America (39 | 7.0%), Latin America (39 | 7.0%), Mexico (39 | 7.0%), and Canada (14 | 2.5%), together accounting for 23.5% of all Downieville Lawson Dumont residents.
| Immigration Origin | # Population | % Population |
| Canada | 14 | 2.5% |
| Central America | 39 | 7.0% |
| Latin America | 39 | 7.0% |
| Mexico | 39 | 7.0% | View All 4 Rows |
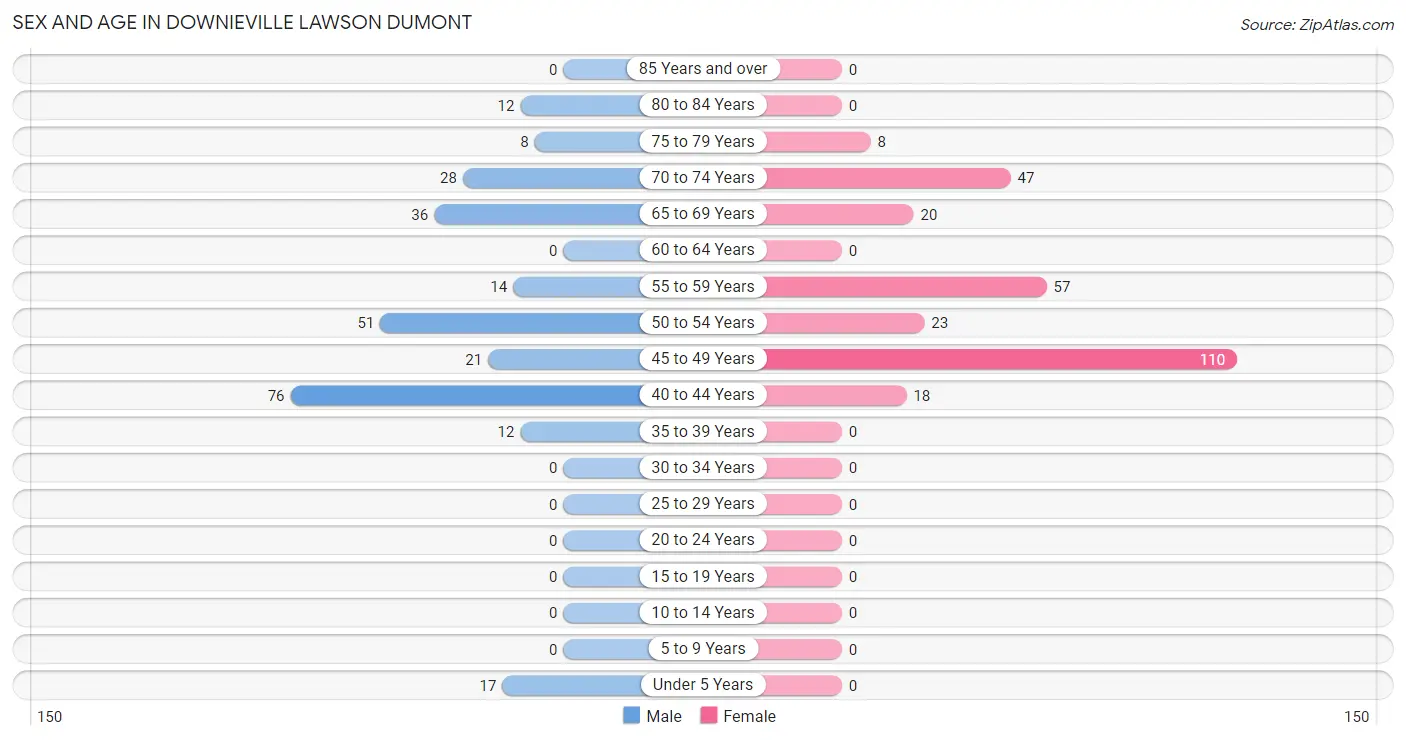
Sex and Age in Downieville Lawson Dumont
Sex and Age in Downieville Lawson Dumont
The most populous age groups in Downieville Lawson Dumont are 40 to 44 Years (76 | 27.6%) for men and 45 to 49 Years (110 | 38.9%) for women.
| Age Bracket | Male | Female |
| Under 5 Years | 17 (6.2%) | 0 (0.0%) |
| 5 to 9 Years | 0 (0.0%) | 0 (0.0%) |
| 10 to 14 Years | 0 (0.0%) | 0 (0.0%) |
| 15 to 19 Years | 0 (0.0%) | 0 (0.0%) |
| 20 to 24 Years | 0 (0.0%) | 0 (0.0%) |
| 25 to 29 Years | 0 (0.0%) | 0 (0.0%) |
| 30 to 34 Years | 0 (0.0%) | 0 (0.0%) |
| 35 to 39 Years | 12 (4.4%) | 0 (0.0%) |
| 40 to 44 Years | 76 (27.6%) | 18 (6.4%) |
| 45 to 49 Years | 21 (7.6%) | 110 (38.9%) |
| 50 to 54 Years | 51 (18.5%) | 23 (8.1%) |
| 55 to 59 Years | 14 (5.1%) | 57 (20.1%) |
| 60 to 64 Years | 0 (0.0%) | 0 (0.0%) |
| 65 to 69 Years | 36 (13.1%) | 20 (7.1%) |
| 70 to 74 Years | 28 (10.2%) | 47 (16.6%) |
| 75 to 79 Years | 8 (2.9%) | 8 (2.8%) |
| 80 to 84 Years | 12 (4.4%) | 0 (0.0%) |
| 85 Years and over | 0 (0.0%) | 0 (0.0%) |
| Total | 275 (100.0%) | 283 (100.0%) |
Families and Households in Downieville Lawson Dumont
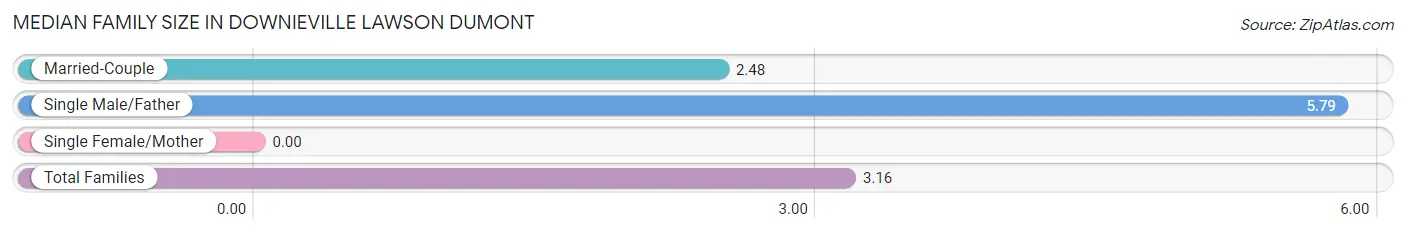
Median Family Size in Downieville Lawson Dumont
| Family Type | # Families | Family Size |
| Married-Couple | 108 (79.4%) | 2.48 |
| Single Male/Father | 28 (20.6%) | 5.79 |
| Single Female/Mother | 0 (0.0%) | - |
| Total Families | 136 (100.0%) | 3.16 |
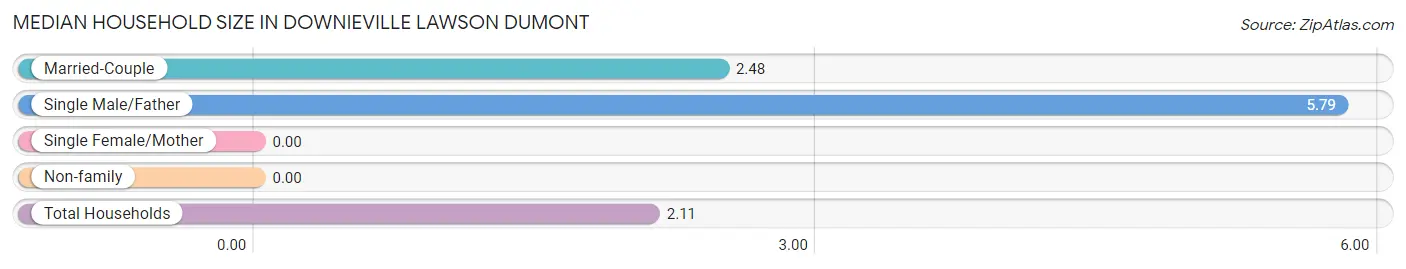
Median Household Size in Downieville Lawson Dumont
| Household Type | # Households | Household Size |
| Married-Couple | 108 (40.9%) | 2.48 |
| Single Male/Father | 28 (10.6%) | 5.79 |
| Single Female/Mother | 0 (0.0%) | - |
| Non-family | 128 (48.5%) | - |
| Total Households | 264 (100.0%) | 2.11 |
Household Size by Marriage Status in Downieville Lawson Dumont
Out of a total of 264 households in Downieville Lawson Dumont, 136 (51.5%) are family households, while 128 (48.5%) are nonfamily households. The most numerous type of family households are 2-person households, comprising 72, and the most common type of nonfamily households are 1-person households, comprising 128.
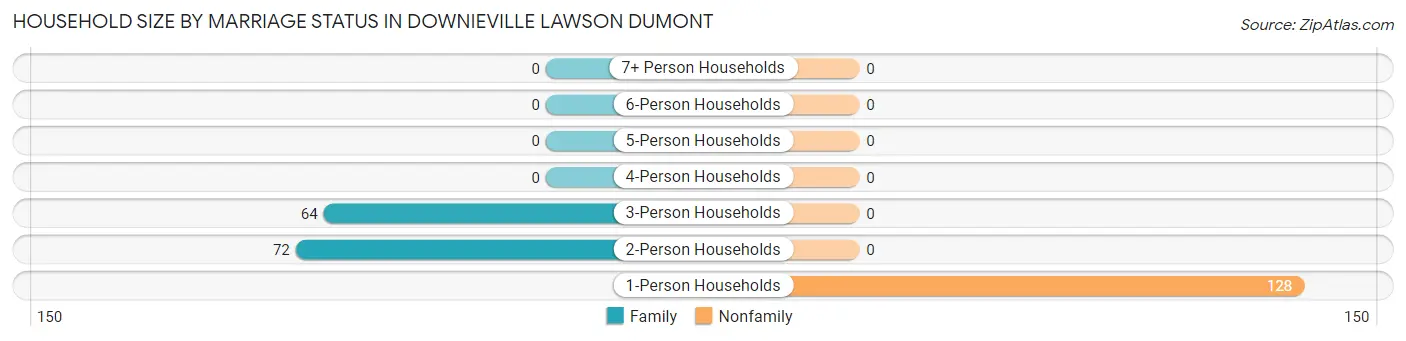
| Household Size | Family Households | Nonfamily Households |
| 1-Person Households | - | 128 (48.5%) |
| 2-Person Households | 72 (27.3%) | 0 (0.0%) |
| 3-Person Households | 64 (24.2%) | 0 (0.0%) |
| 4-Person Households | 0 (0.0%) | 0 (0.0%) |
| 5-Person Households | 0 (0.0%) | 0 (0.0%) |
| 6-Person Households | 0 (0.0%) | 0 (0.0%) |
| 7+ Person Households | 0 (0.0%) | 0 (0.0%) |
| Total | 136 (51.5%) | 128 (48.5%) |
Female Fertility in Downieville Lawson Dumont
Fertility by Age in Downieville Lawson Dumont
| Age Bracket | Women with Births | Births / 1,000 Women |
| 15 to 19 years | 0 (0.0%) | 0.0 |
| 20 to 34 years | 0 (0.0%) | 0.0 |
| 35 to 50 years | 0 (0.0%) | 0.0 |
| Total | 0 (0.0%) | 0.0 |
Fertility by Age by Marriage Status in Downieville Lawson Dumont
| Age Bracket | Married | Unmarried |
| 15 to 19 years | 0 (0.0%) | 0 (0.0%) |
| 20 to 34 years | 0 (0.0%) | 0 (0.0%) |
| 35 to 50 years | 0 (0.0%) | 0 (0.0%) |
| Total | 0 (0.0%) | 0 (0.0%) |
Fertility by Education in Downieville Lawson Dumont
| Educational Attainment | Women with Births | Births / 1,000 Women |
| Less than High School | 0 (0.0%) | 0.0 |
| High School Diploma | 0 (0.0%) | 0.0 |
| College or Associate's Degree | 0 (0.0%) | 0.0 |
| Bachelor's Degree | 0 (0.0%) | 0.0 |
| Graduate Degree | 0 (0.0%) | 0.0 |
| Total | 0 (0.0%) | 0.0 |
Fertility by Education by Marriage Status in Downieville Lawson Dumont
| Educational Attainment | Married | Unmarried |
| Less than High School | 0 (0.0%) | 0 (0.0%) |
| High School Diploma | 0 (0.0%) | 0 (0.0%) |
| College or Associate's Degree | 0 (0.0%) | 0 (0.0%) |
| Bachelor's Degree | 0 (0.0%) | 0 (0.0%) |
| Graduate Degree | 0 (0.0%) | 0 (0.0%) |
| Total | 0 (0.0%) | 0 (0.0%) |
Employment Characteristics in Downieville Lawson Dumont
Employment by Class of Employer in Downieville Lawson Dumont
Among the 240 employed individuals in Downieville Lawson Dumont, private company employees (160 | 66.7%), self-employed (not incorporated) (30 | 12.5%), and local government employees (24 | 10.0%) make up the most common classes of employment.
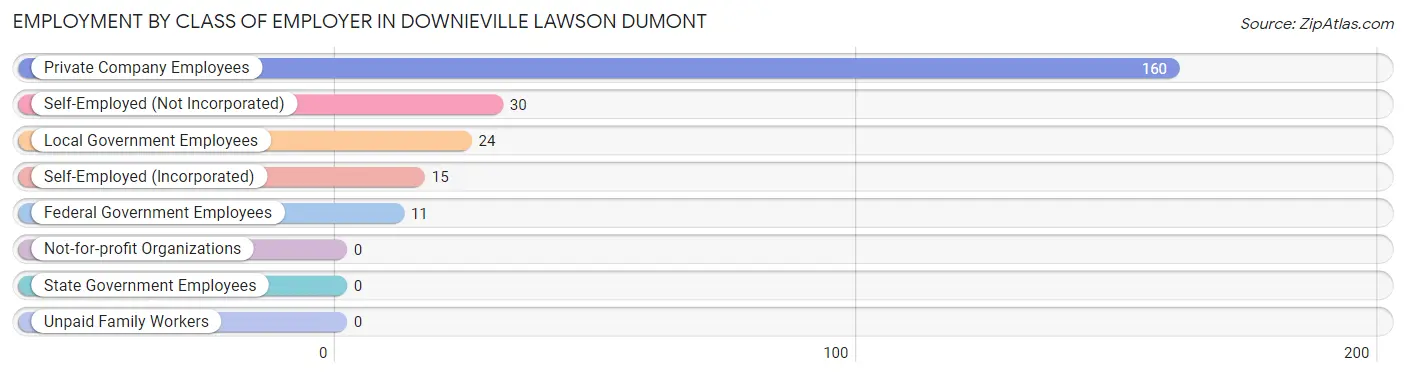
| Employer Class | # Employees | % Employees |
| Private Company Employees | 160 | 66.7% |
| Self-Employed (Incorporated) | 15 | 6.2% |
| Self-Employed (Not Incorporated) | 30 | 12.5% |
| Not-for-profit Organizations | 0 | 0.0% |
| Local Government Employees | 24 | 10.0% |
| State Government Employees | 0 | 0.0% |
| Federal Government Employees | 11 | 4.6% |
| Unpaid Family Workers | 0 | 0.0% |
| Total | 240 | 100.0% |
Employment Status by Age in Downieville Lawson Dumont
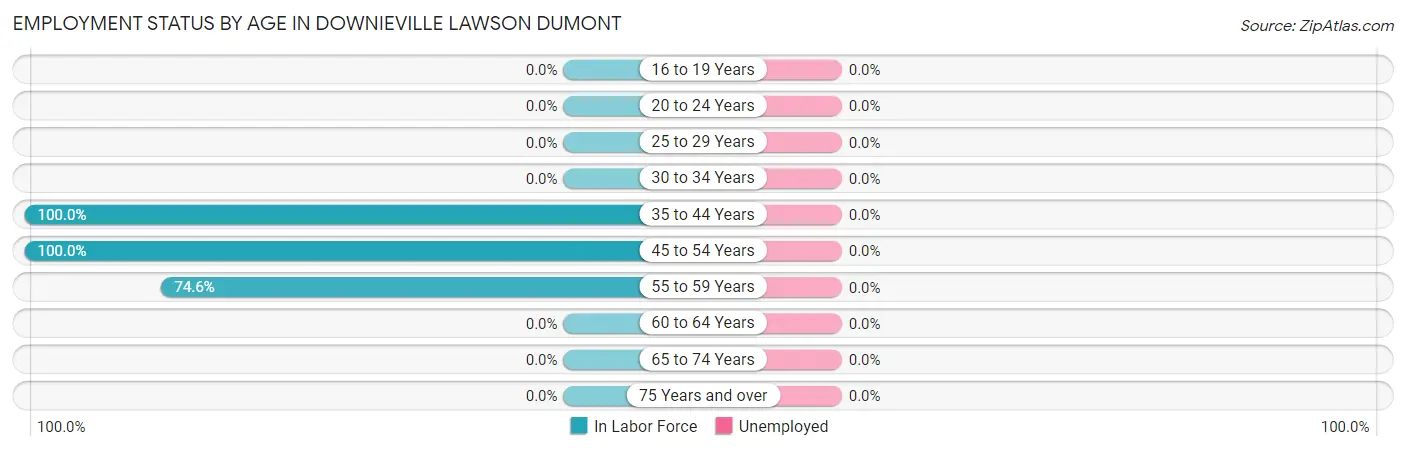
| Age Bracket | In Labor Force | Unemployed |
| 16 to 19 Years | 0 (0.0%) | 0 (0.0%) |
| 20 to 24 Years | 0 (0.0%) | 0 (0.0%) |
| 25 to 29 Years | 0 (0.0%) | 0 (0.0%) |
| 30 to 34 Years | 0 (0.0%) | 0 (0.0%) |
| 35 to 44 Years | 106 (100.0%) | 0 (0.0%) |
| 45 to 54 Years | 205 (100.0%) | 0 (0.0%) |
| 55 to 59 Years | 53 (74.6%) | 0 (0.0%) |
| 60 to 64 Years | 0 (0.0%) | 0 (0.0%) |
| 65 to 74 Years | 0 (0.0%) | 0 (0.0%) |
| 75 Years and over | 0 (0.0%) | 0 (0.0%) |
| Total | 364 (67.3%) | 0 (0.0%) |
Employment Status by Educational Attainment in Downieville Lawson Dumont
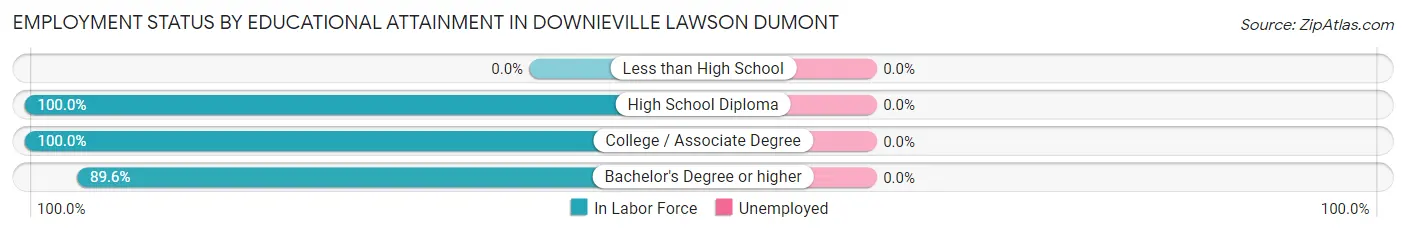
| Educational Attainment | In Labor Force | Unemployed |
| Less than High School | 0 (0.0%) | 0 (0.0%) |
| High School Diploma | 81 (100.0%) | 0 (0.0%) |
| College / Associate Degree | 128 (100.0%) | 0 (0.0%) |
| Bachelor's Degree or higher | 155 (89.6%) | 0 (0.0%) |
| Total | 364 (95.3%) | 0 (0.0%) |
Employment Occupations by Sex in Downieville Lawson Dumont
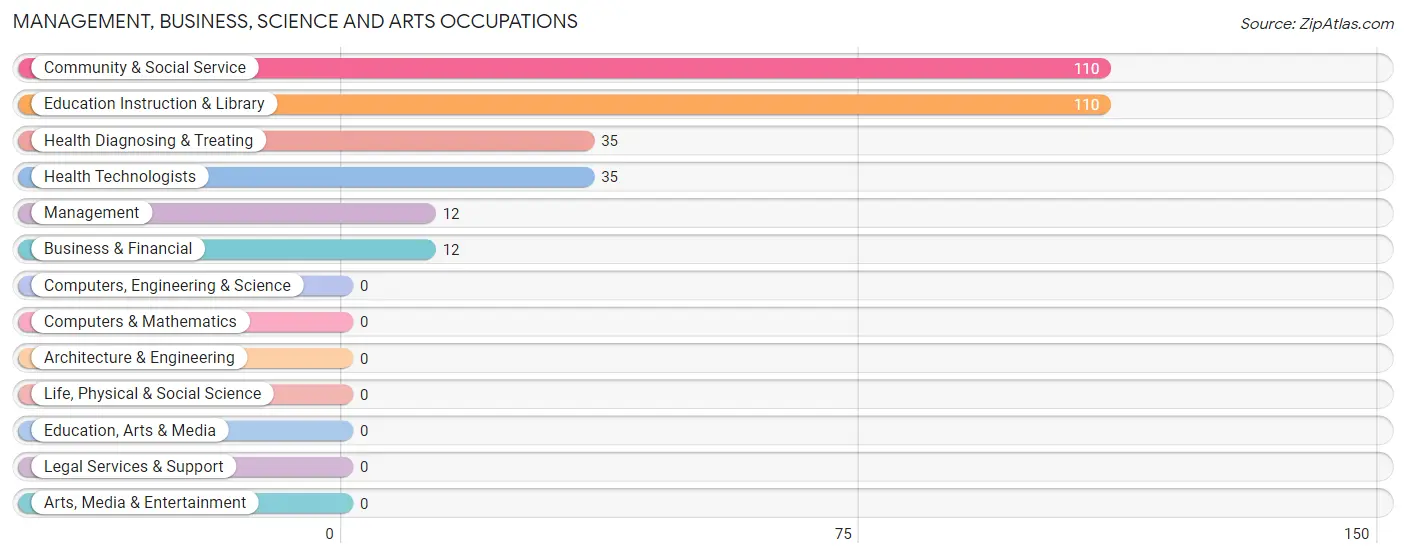
Management, Business, Science and Arts Occupations
The most common Management, Business, Science and Arts occupations in Downieville Lawson Dumont are Community & Social Service (110 | 30.2%), Education Instruction & Library (110 | 30.2%), Health Diagnosing & Treating (35 | 9.6%), Health Technologists (35 | 9.6%), and Management (12 | 3.3%).
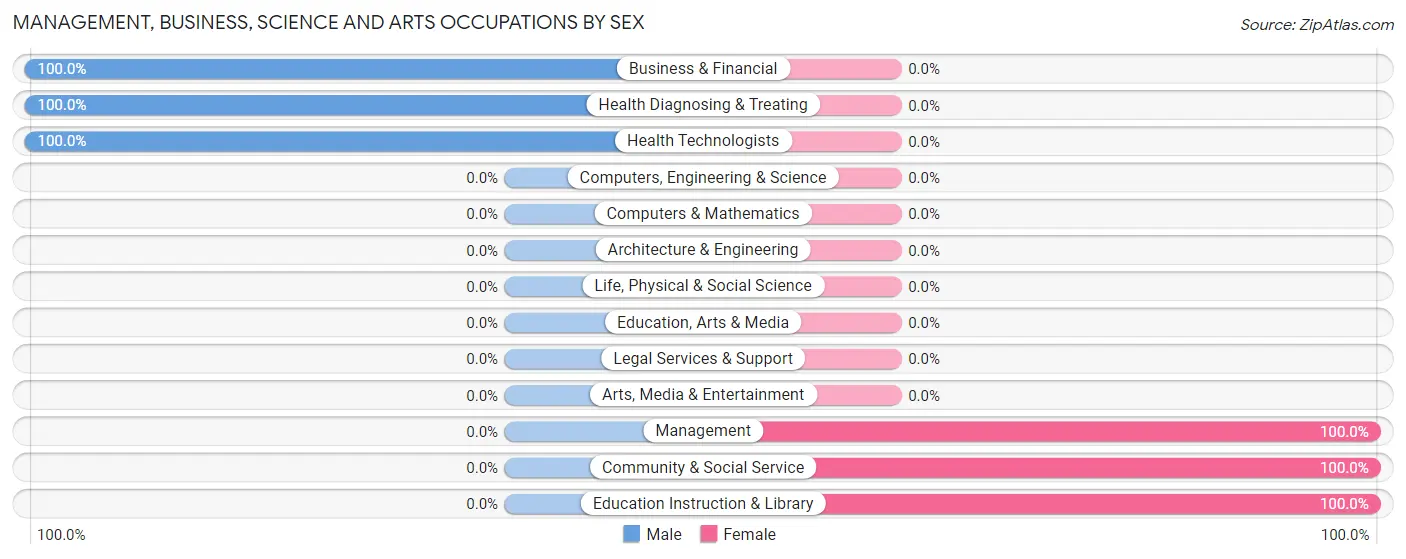
Management, Business, Science and Arts Occupations by Sex
Within the Management, Business, Science and Arts occupations in Downieville Lawson Dumont, the most male-oriented occupations are Business & Financial (100.0%), Health Diagnosing & Treating (100.0%), and Health Technologists (100.0%), while the most female-oriented occupations are Management (100.0%), Community & Social Service (100.0%), and Education Instruction & Library (100.0%).
| Occupation | Male | Female |
| Management | 0 (0.0%) | 12 (100.0%) |
| Business & Financial | 12 (100.0%) | 0 (0.0%) |
| Computers, Engineering & Science | 0 (0.0%) | 0 (0.0%) |
| Computers & Mathematics | 0 (0.0%) | 0 (0.0%) |
| Architecture & Engineering | 0 (0.0%) | 0 (0.0%) |
| Life, Physical & Social Science | 0 (0.0%) | 0 (0.0%) |
| Community & Social Service | 0 (0.0%) | 110 (100.0%) |
| Education, Arts & Media | 0 (0.0%) | 0 (0.0%) |
| Legal Services & Support | 0 (0.0%) | 0 (0.0%) |
| Education Instruction & Library | 0 (0.0%) | 110 (100.0%) |
| Arts, Media & Entertainment | 0 (0.0%) | 0 (0.0%) |
| Health Diagnosing & Treating | 35 (100.0%) | 0 (0.0%) |
| Health Technologists | 35 (100.0%) | 0 (0.0%) |
| Total (Category) | 47 (27.8%) | 122 (72.2%) |
| Total (Overall) | 174 (47.8%) | 190 (52.2%) |
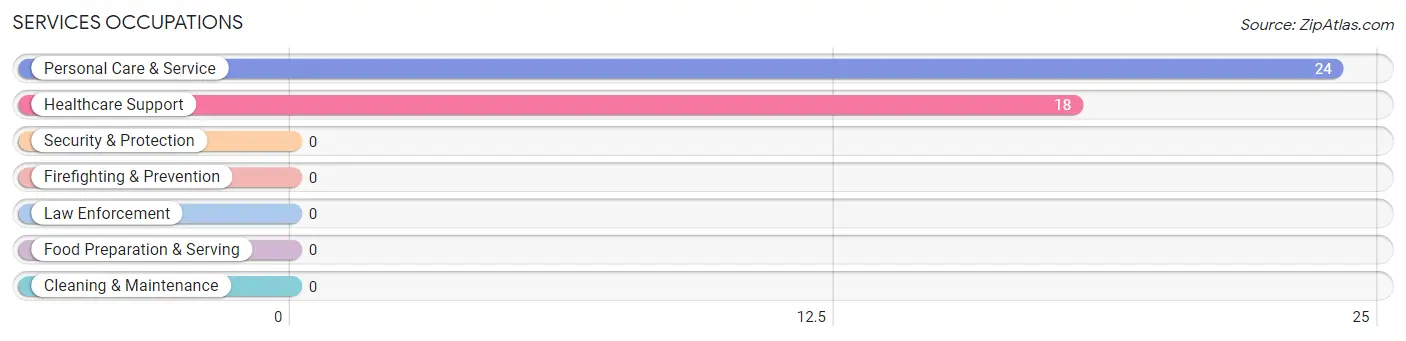
Services Occupations
The most common Services occupations in Downieville Lawson Dumont are Personal Care & Service (24 | 6.6%), and Healthcare Support (18 | 5.0%).
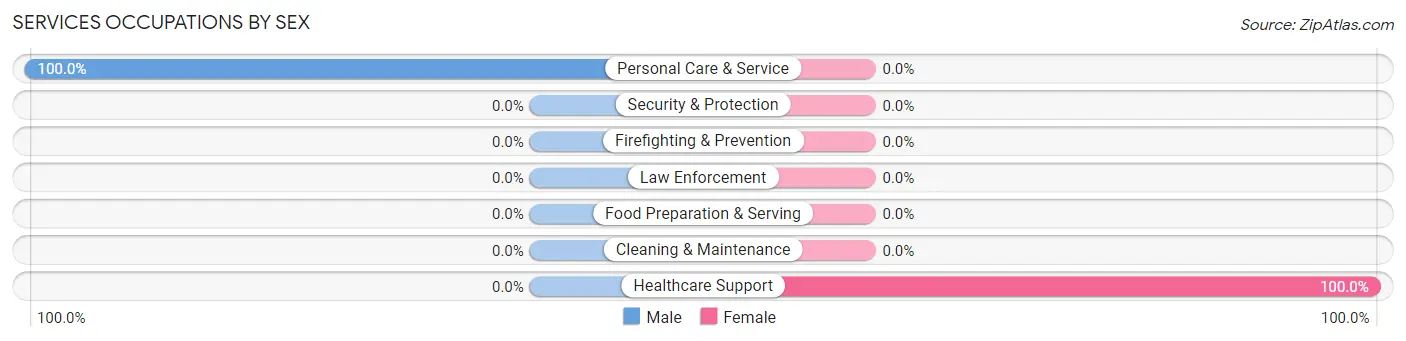
Services Occupations by Sex
| Occupation | Male | Female |
| Healthcare Support | 0 (0.0%) | 18 (100.0%) |
| Security & Protection | 0 (0.0%) | 0 (0.0%) |
| Firefighting & Prevention | 0 (0.0%) | 0 (0.0%) |
| Law Enforcement | 0 (0.0%) | 0 (0.0%) |
| Food Preparation & Serving | 0 (0.0%) | 0 (0.0%) |
| Cleaning & Maintenance | 0 (0.0%) | 0 (0.0%) |
| Personal Care & Service | 24 (100.0%) | 0 (0.0%) |
| Total (Category) | 24 (57.1%) | 18 (42.9%) |
| Total (Overall) | 174 (47.8%) | 190 (52.2%) |
Sales and Office Occupations
The most common Sales and Office occupations in Downieville Lawson Dumont are , and Office & Administration (50 | 13.7%).
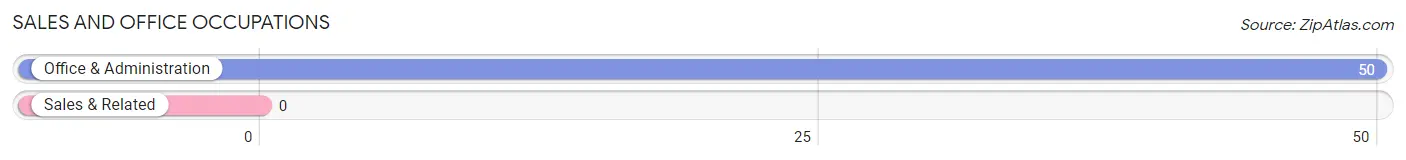
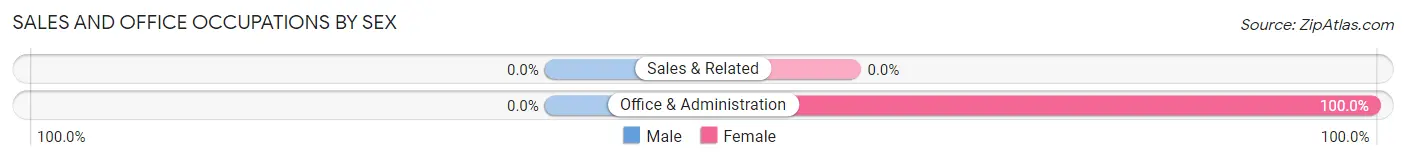
Sales and Office Occupations by Sex
| Occupation | Male | Female |
| Sales & Related | 0 (0.0%) | 0 (0.0%) |
| Office & Administration | 0 (0.0%) | 50 (100.0%) |
| Total (Category) | 0 (0.0%) | 50 (100.0%) |
| Total (Overall) | 174 (47.8%) | 190 (52.2%) |
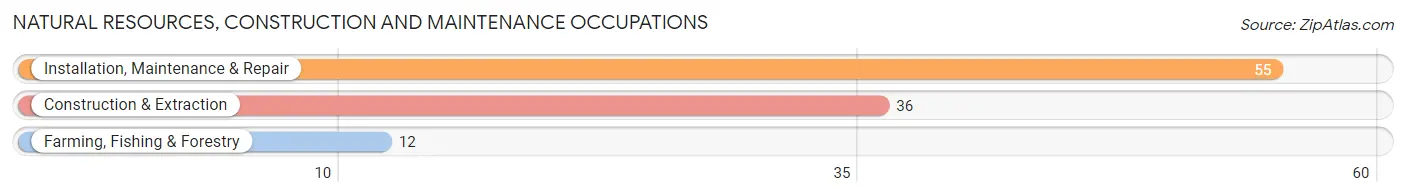
Natural Resources, Construction and Maintenance Occupations
The most common Natural Resources, Construction and Maintenance occupations in Downieville Lawson Dumont are Installation, Maintenance & Repair (55 | 15.1%), Construction & Extraction (36 | 9.9%), and Farming, Fishing & Forestry (12 | 3.3%).
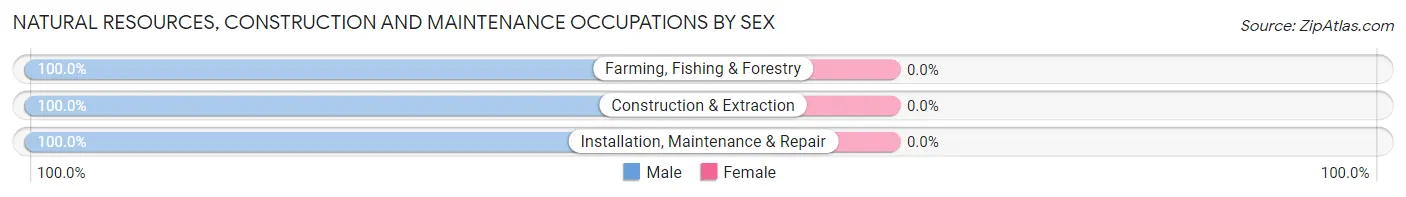
Natural Resources, Construction and Maintenance Occupations by Sex
| Occupation | Male | Female |
| Farming, Fishing & Forestry | 12 (100.0%) | 0 (0.0%) |
| Construction & Extraction | 36 (100.0%) | 0 (0.0%) |
| Installation, Maintenance & Repair | 55 (100.0%) | 0 (0.0%) |
| Total (Category) | 103 (100.0%) | 0 (0.0%) |
| Total (Overall) | 174 (47.8%) | 190 (52.2%) |
Production, Transportation and Moving Occupations
Production, Transportation and Moving Occupations by Sex
| Occupation | Male | Female |
| Production | 0 (0.0%) | 0 (0.0%) |
| Transportation | 0 (0.0%) | 0 (0.0%) |
| Material Moving | 0 (0.0%) | 0 (0.0%) |
| Total (Category) | 0 (0.0%) | 0 (0.0%) |
| Total (Overall) | 174 (47.8%) | 190 (52.2%) |
Employment Industries by Sex in Downieville Lawson Dumont
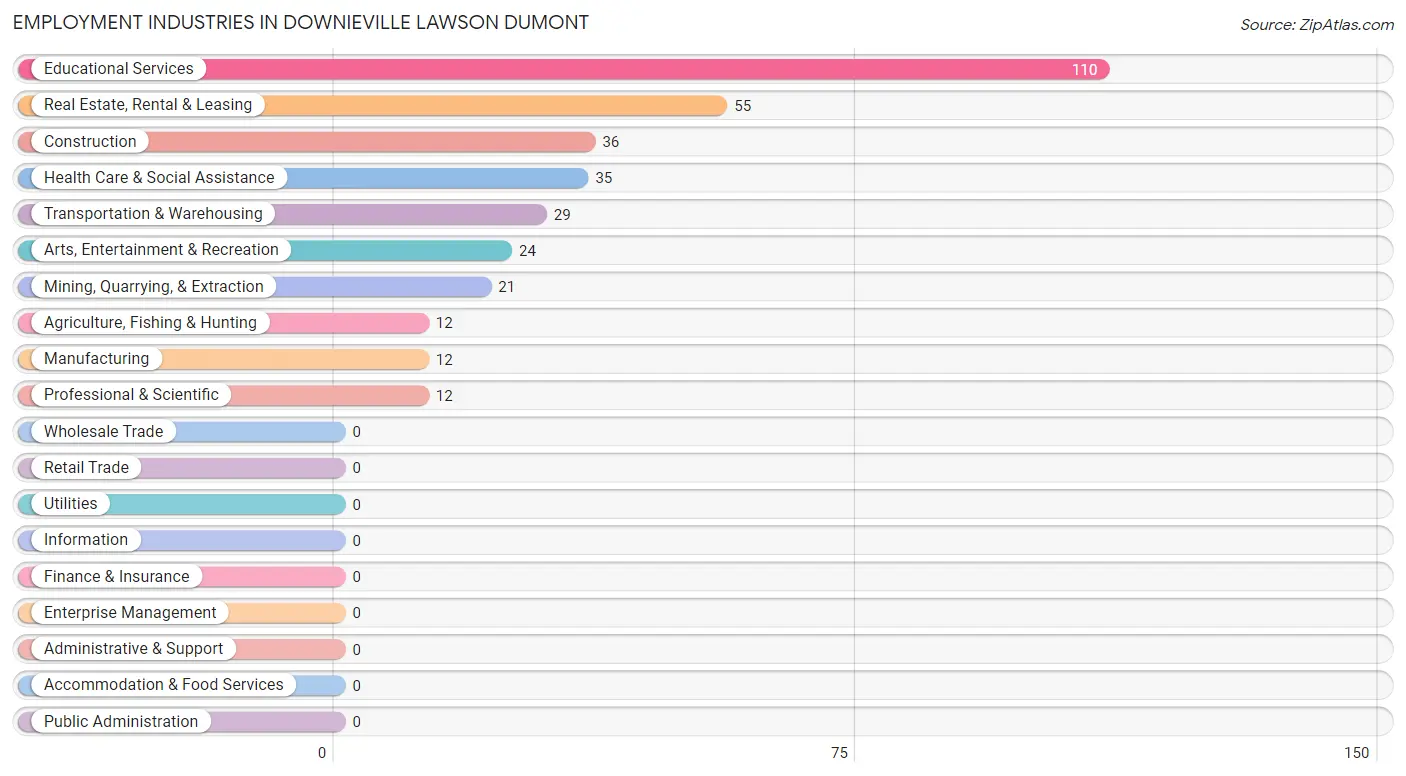
Employment Industries in Downieville Lawson Dumont
The major employment industries in Downieville Lawson Dumont include Educational Services (110 | 30.2%), Real Estate, Rental & Leasing (55 | 15.1%), Construction (36 | 9.9%), Health Care & Social Assistance (35 | 9.6%), and Transportation & Warehousing (29 | 8.0%).
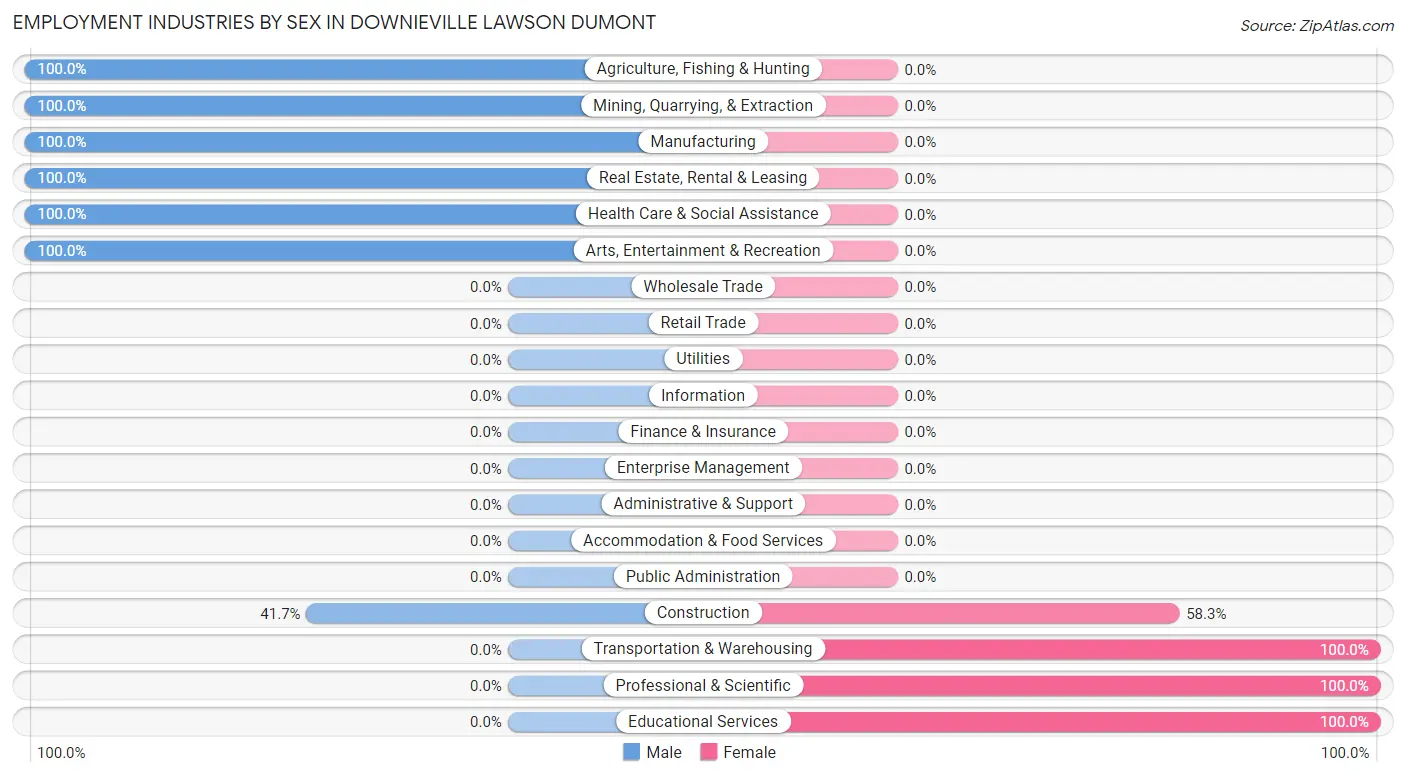
Employment Industries by Sex in Downieville Lawson Dumont
The Downieville Lawson Dumont industries that see more men than women are Agriculture, Fishing & Hunting (100.0%), Mining, Quarrying, & Extraction (100.0%), and Manufacturing (100.0%), whereas the industries that tend to have a higher number of women are Transportation & Warehousing (100.0%), Professional & Scientific (100.0%), and Educational Services (100.0%).
| Industry | Male | Female |
| Agriculture, Fishing & Hunting | 12 (100.0%) | 0 (0.0%) |
| Mining, Quarrying, & Extraction | 21 (100.0%) | 0 (0.0%) |
| Construction | 15 (41.7%) | 21 (58.3%) |
| Manufacturing | 12 (100.0%) | 0 (0.0%) |
| Wholesale Trade | 0 (0.0%) | 0 (0.0%) |
| Retail Trade | 0 (0.0%) | 0 (0.0%) |
| Transportation & Warehousing | 0 (0.0%) | 29 (100.0%) |
| Utilities | 0 (0.0%) | 0 (0.0%) |
| Information | 0 (0.0%) | 0 (0.0%) |
| Finance & Insurance | 0 (0.0%) | 0 (0.0%) |
| Real Estate, Rental & Leasing | 55 (100.0%) | 0 (0.0%) |
| Professional & Scientific | 0 (0.0%) | 12 (100.0%) |
| Enterprise Management | 0 (0.0%) | 0 (0.0%) |
| Administrative & Support | 0 (0.0%) | 0 (0.0%) |
| Educational Services | 0 (0.0%) | 110 (100.0%) |
| Health Care & Social Assistance | 35 (100.0%) | 0 (0.0%) |
| Arts, Entertainment & Recreation | 24 (100.0%) | 0 (0.0%) |
| Accommodation & Food Services | 0 (0.0%) | 0 (0.0%) |
| Public Administration | 0 (0.0%) | 0 (0.0%) |
| Total | 174 (47.8%) | 190 (52.2%) |
Education in Downieville Lawson Dumont
School Enrollment in Downieville Lawson Dumont
| School Level | # Students | % Students |
| Nursery / Preschool | 0 | 0.0% |
| Kindergarten | 0 | 0.0% |
| Elementary School | 0 | 0.0% |
| Middle School | 0 | 0.0% |
| High School | 0 | 0.0% |
| College / Undergraduate | 0 | 0.0% |
| Graduate / Professional | 0 | 0.0% |
| Total | 0 | 0.0% |
School Enrollment by Age by Funding Source in Downieville Lawson Dumont
| Age Bracket | Public School | Private School |
| 3 to 4 Year Olds | 0 (0.0%) | 0 (0.0%) |
| 5 to 9 Year Old | 0 (0.0%) | 0 (0.0%) |
| 10 to 14 Year Olds | 0 (0.0%) | 0 (0.0%) |
| 15 to 17 Year Olds | 0 (0.0%) | 0 (0.0%) |
| 18 to 19 Year Olds | 0 (0.0%) | 0 (0.0%) |
| 20 to 24 Year Olds | 0 (0.0%) | 0 (0.0%) |
| 25 to 34 Year Olds | 0 (0.0%) | 0 (0.0%) |
| 35 Years and over | 0 (0.0%) | 0 (0.0%) |
| Total | 0 (0.0%) | 0 (0.0%) |
Educational Attainment by Field of Study in Downieville Lawson Dumont
Business (110 | 59.5%), science & technology (21 | 11.4%), education (18 | 9.7%), bio, nature & agricultural (12 | 6.5%), and literature & languages (12 | 6.5%) are the most common fields of study among 185 individuals in Downieville Lawson Dumont who have obtained a bachelor's degree or higher.
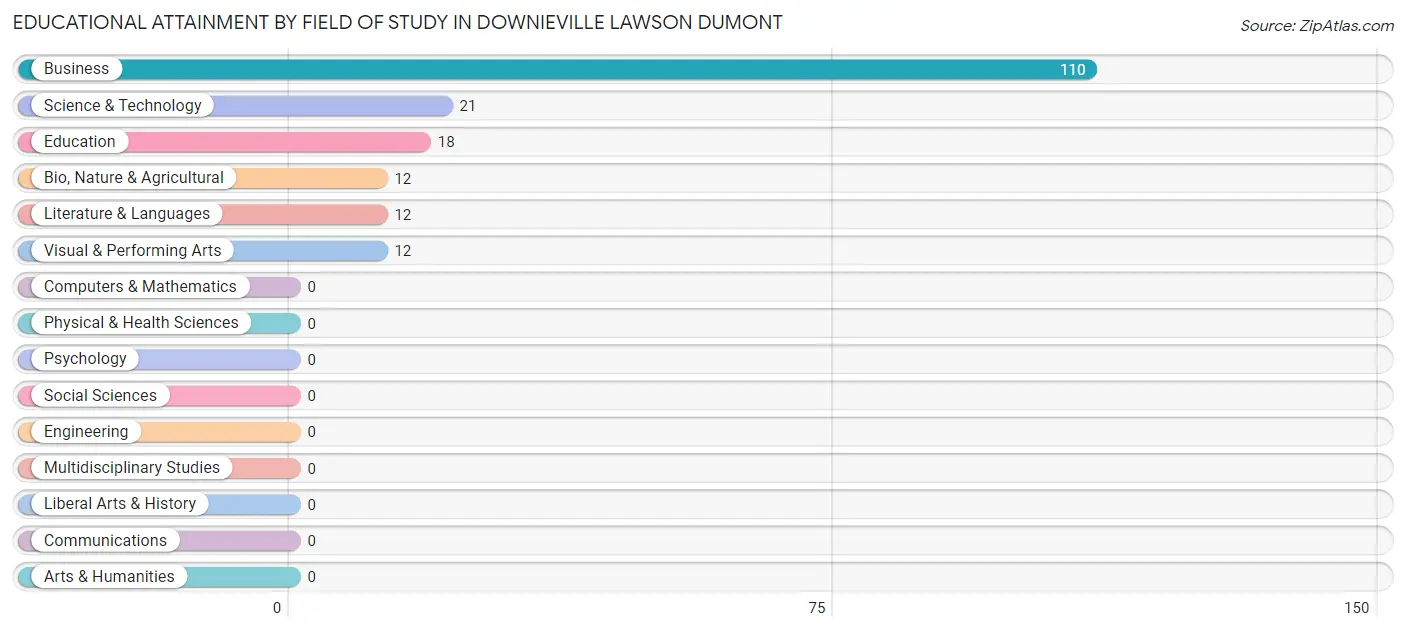
| Field of Study | # Graduates | % Graduates |
| Computers & Mathematics | 0 | 0.0% |
| Bio, Nature & Agricultural | 12 | 6.5% |
| Physical & Health Sciences | 0 | 0.0% |
| Psychology | 0 | 0.0% |
| Social Sciences | 0 | 0.0% |
| Engineering | 0 | 0.0% |
| Multidisciplinary Studies | 0 | 0.0% |
| Science & Technology | 21 | 11.4% |
| Business | 110 | 59.5% |
| Education | 18 | 9.7% |
| Literature & Languages | 12 | 6.5% |
| Liberal Arts & History | 0 | 0.0% |
| Visual & Performing Arts | 12 | 6.5% |
| Communications | 0 | 0.0% |
| Arts & Humanities | 0 | 0.0% |
| Total | 185 | 100.0% |
Transportation & Commute in Downieville Lawson Dumont
Vehicle Availability by Sex in Downieville Lawson Dumont
The most prevalent vehicle ownership categories in Downieville Lawson Dumont are males with 2 vehicles (112, accounting for 70.0%) and females with 2 vehicles (62, making up 140.0%).
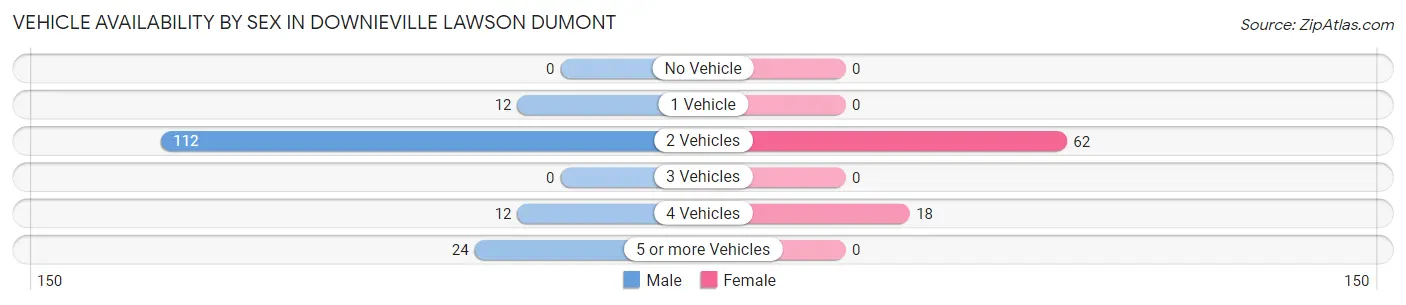
| Vehicles Available | Male | Female |
| No Vehicle | 0 (0.0%) | 0 (0.0%) |
| 1 Vehicle | 12 (7.5%) | 0 (0.0%) |
| 2 Vehicles | 112 (70.0%) | 62 (77.5%) |
| 3 Vehicles | 0 (0.0%) | 0 (0.0%) |
| 4 Vehicles | 12 (7.5%) | 18 (22.5%) |
| 5 or more Vehicles | 24 (15.0%) | 0 (0.0%) |
| Total | 160 (100.0%) | 80 (100.0%) |
Commute Time in Downieville Lawson Dumont
The most frequently occuring commute durations in Downieville Lawson Dumont are less than 5 minutes (67 commuters, 32.4%), 15 to 19 minutes (45 commuters, 21.7%), and 45 to 59 minutes (39 commuters, 18.8%).
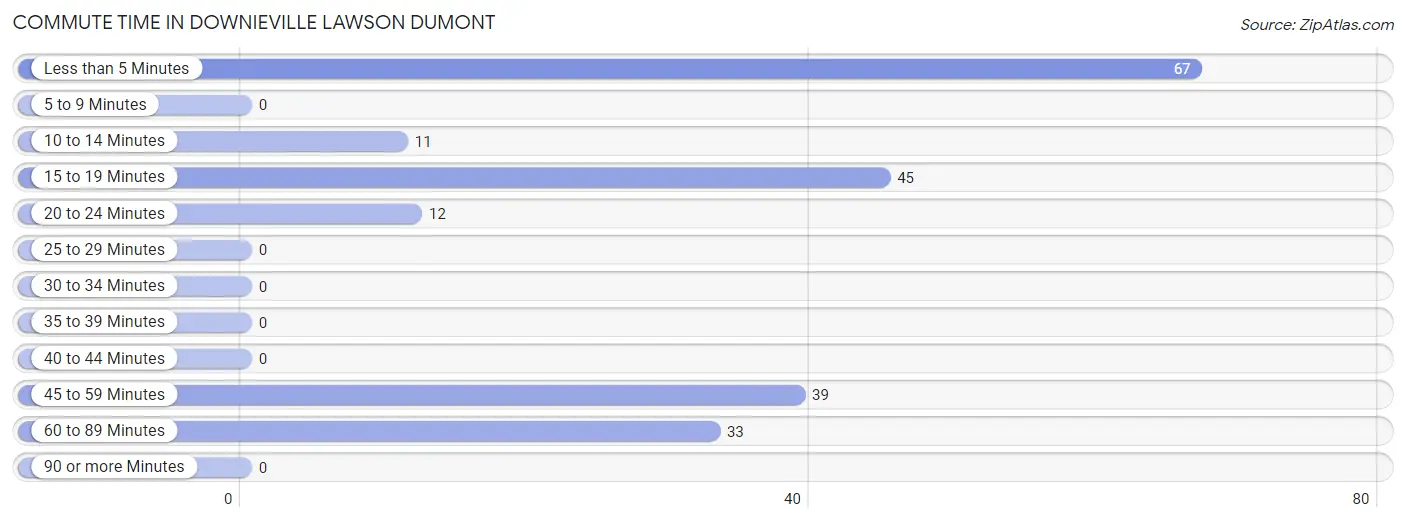
| Commute Time | # Commuters | % Commuters |
| Less than 5 Minutes | 67 | 32.4% |
| 5 to 9 Minutes | 0 | 0.0% |
| 10 to 14 Minutes | 11 | 5.3% |
| 15 to 19 Minutes | 45 | 21.7% |
| 20 to 24 Minutes | 12 | 5.8% |
| 25 to 29 Minutes | 0 | 0.0% |
| 30 to 34 Minutes | 0 | 0.0% |
| 35 to 39 Minutes | 0 | 0.0% |
| 40 to 44 Minutes | 0 | 0.0% |
| 45 to 59 Minutes | 39 | 18.8% |
| 60 to 89 Minutes | 33 | 15.9% |
| 90 or more Minutes | 0 | 0.0% |
Commute Time by Sex in Downieville Lawson Dumont
The most common commute times in Downieville Lawson Dumont are less than 5 minutes (67 commuters, 41.9%) for males and 45 to 59 minutes (18 commuters, 38.3%) for females.
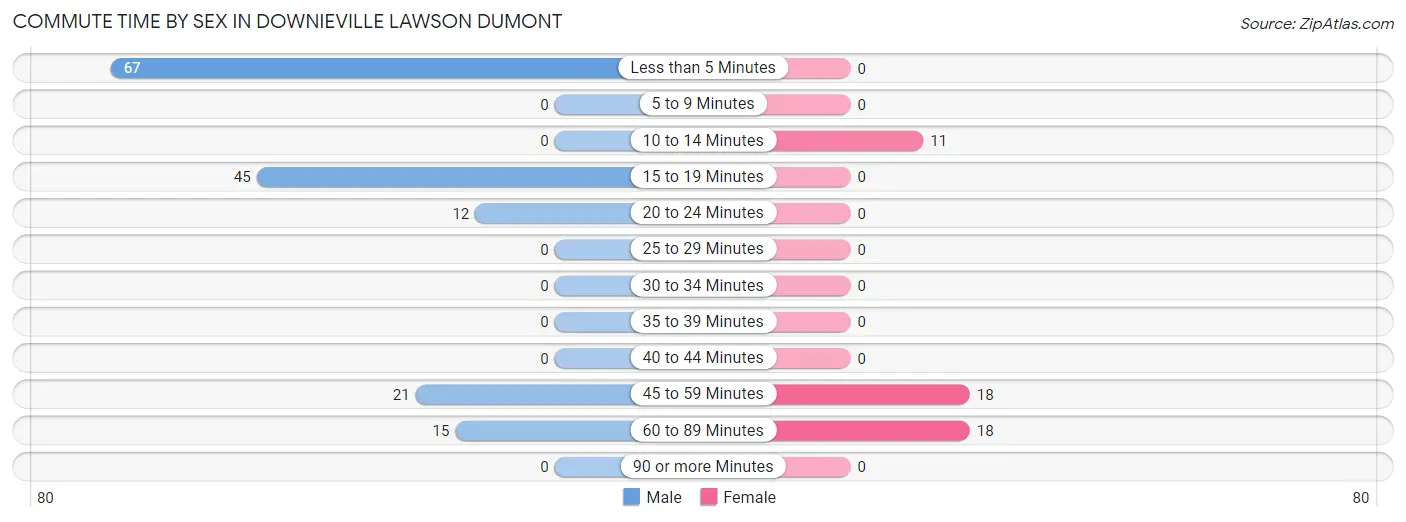
| Commute Time | Male | Female |
| Less than 5 Minutes | 67 (41.9%) | 0 (0.0%) |
| 5 to 9 Minutes | 0 (0.0%) | 0 (0.0%) |
| 10 to 14 Minutes | 0 (0.0%) | 11 (23.4%) |
| 15 to 19 Minutes | 45 (28.1%) | 0 (0.0%) |
| 20 to 24 Minutes | 12 (7.5%) | 0 (0.0%) |
| 25 to 29 Minutes | 0 (0.0%) | 0 (0.0%) |
| 30 to 34 Minutes | 0 (0.0%) | 0 (0.0%) |
| 35 to 39 Minutes | 0 (0.0%) | 0 (0.0%) |
| 40 to 44 Minutes | 0 (0.0%) | 0 (0.0%) |
| 45 to 59 Minutes | 21 (13.1%) | 18 (38.3%) |
| 60 to 89 Minutes | 15 (9.4%) | 18 (38.3%) |
| 90 or more Minutes | 0 (0.0%) | 0 (0.0%) |
Time of Departure to Work by Sex in Downieville Lawson Dumont
The most frequent times of departure to work in Downieville Lawson Dumont are 12:00 AM to 4:59 AM (57, 35.6%) for males and 9:00 AM to 9:59 AM (18, 38.3%) for females.
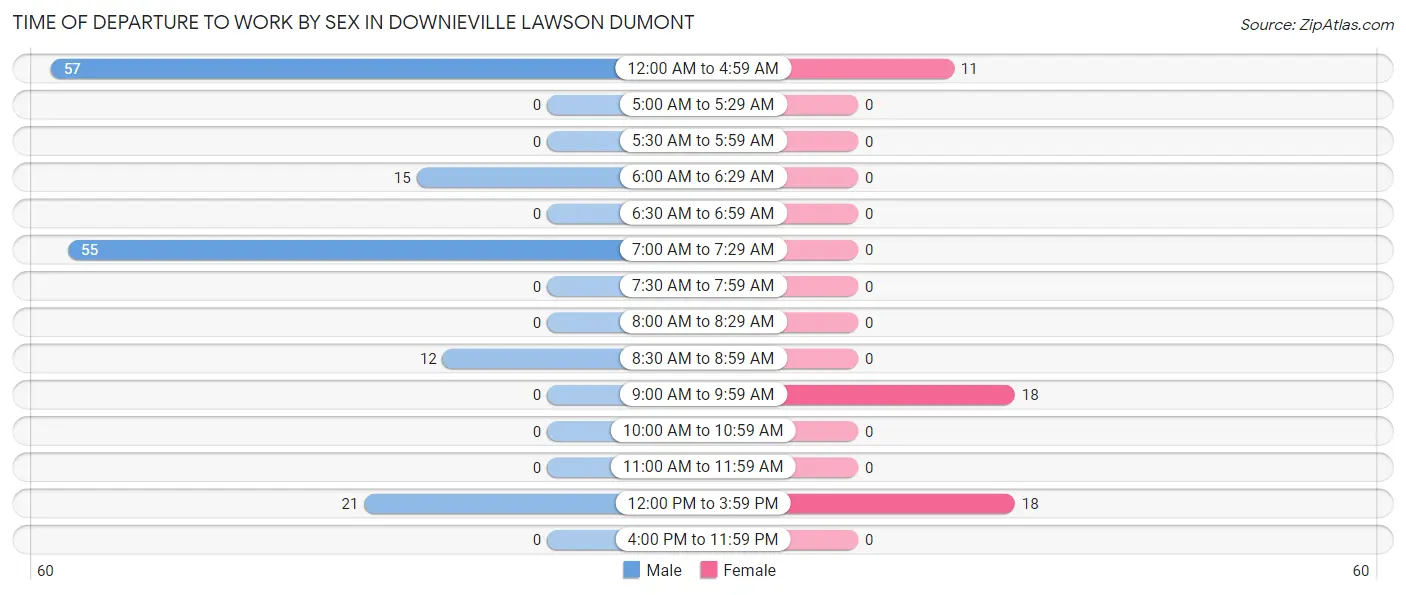
| Time of Departure | Male | Female |
| 12:00 AM to 4:59 AM | 57 (35.6%) | 11 (23.4%) |
| 5:00 AM to 5:29 AM | 0 (0.0%) | 0 (0.0%) |
| 5:30 AM to 5:59 AM | 0 (0.0%) | 0 (0.0%) |
| 6:00 AM to 6:29 AM | 15 (9.4%) | 0 (0.0%) |
| 6:30 AM to 6:59 AM | 0 (0.0%) | 0 (0.0%) |
| 7:00 AM to 7:29 AM | 55 (34.4%) | 0 (0.0%) |
| 7:30 AM to 7:59 AM | 0 (0.0%) | 0 (0.0%) |
| 8:00 AM to 8:29 AM | 0 (0.0%) | 0 (0.0%) |
| 8:30 AM to 8:59 AM | 12 (7.5%) | 0 (0.0%) |
| 9:00 AM to 9:59 AM | 0 (0.0%) | 18 (38.3%) |
| 10:00 AM to 10:59 AM | 0 (0.0%) | 0 (0.0%) |
| 11:00 AM to 11:59 AM | 0 (0.0%) | 0 (0.0%) |
| 12:00 PM to 3:59 PM | 21 (13.1%) | 18 (38.3%) |
| 4:00 PM to 11:59 PM | 0 (0.0%) | 0 (0.0%) |
| Total | 160 (100.0%) | 47 (100.0%) |
Housing Occupancy in Downieville Lawson Dumont
Occupancy by Ownership in Downieville Lawson Dumont
Of the total 264 dwellings in Downieville Lawson Dumont, owner-occupied units account for 222 (84.1%), while renter-occupied units make up 42 (15.9%).
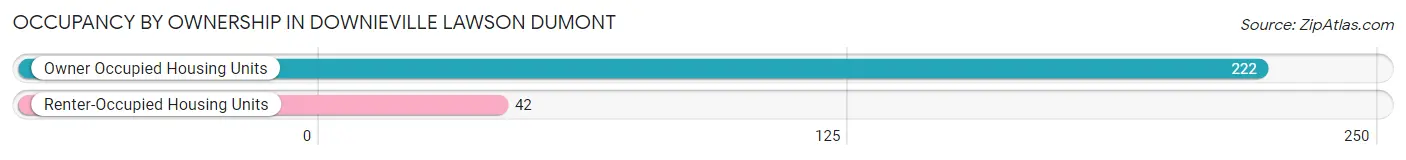
| Occupancy | # Housing Units | % Housing Units |
| Owner Occupied Housing Units | 222 | 84.1% |
| Renter-Occupied Housing Units | 42 | 15.9% |
| Total Occupied Housing Units | 264 | 100.0% |
Occupancy by Household Size in Downieville Lawson Dumont
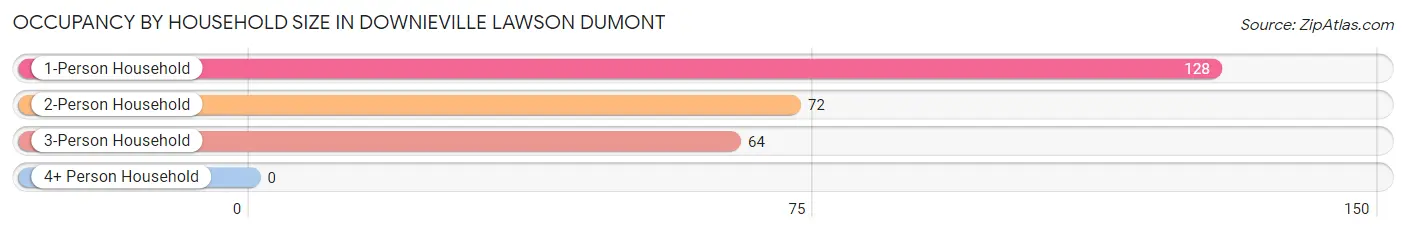
| Household Size | # Housing Units | % Housing Units |
| 1-Person Household | 128 | 48.5% |
| 2-Person Household | 72 | 27.3% |
| 3-Person Household | 64 | 24.2% |
| 4+ Person Household | 0 | 0.0% |
| Total Housing Units | 264 | 100.0% |
Occupancy by Ownership by Household Size in Downieville Lawson Dumont
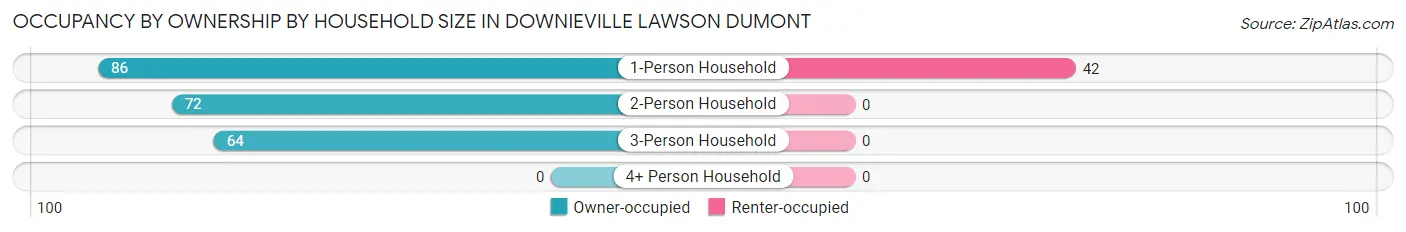
| Household Size | Owner-occupied | Renter-occupied |
| 1-Person Household | 86 (67.2%) | 42 (32.8%) |
| 2-Person Household | 72 (100.0%) | 0 (0.0%) |
| 3-Person Household | 64 (100.0%) | 0 (0.0%) |
| 4+ Person Household | 0 (0.0%) | 0 (0.0%) |
| Total Housing Units | 222 (84.1%) | 42 (15.9%) |
Occupancy by Educational Attainment in Downieville Lawson Dumont
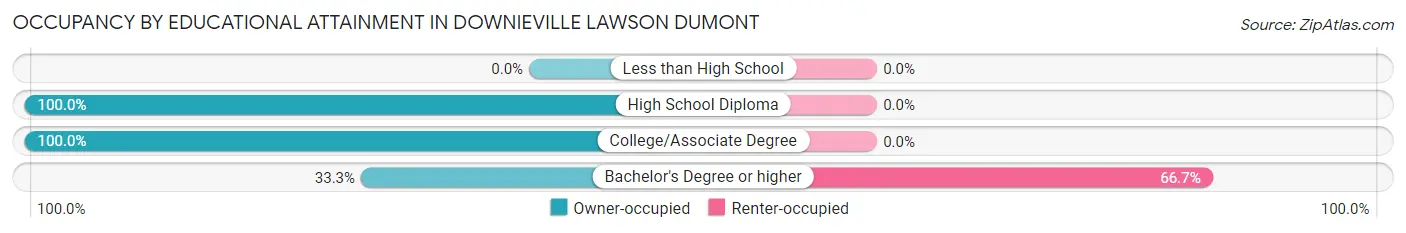
| Household Size | Owner-occupied | Renter-occupied |
| Less than High School | 0 (0.0%) | 0 (0.0%) |
| High School Diploma | 87 (100.0%) | 0 (0.0%) |
| College/Associate Degree | 114 (100.0%) | 0 (0.0%) |
| Bachelor's Degree or higher | 21 (33.3%) | 42 (66.7%) |
Occupancy by Age of Householder in Downieville Lawson Dumont
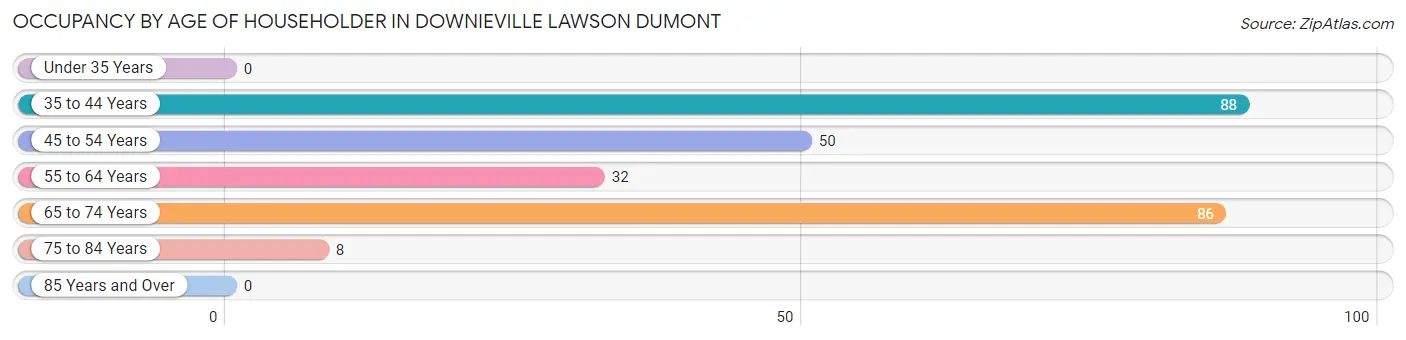
| Age Bracket | # Households | % Households |
| Under 35 Years | 0 | 0.0% |
| 35 to 44 Years | 88 | 33.3% |
| 45 to 54 Years | 50 | 18.9% |
| 55 to 64 Years | 32 | 12.1% |
| 65 to 74 Years | 86 | 32.6% |
| 75 to 84 Years | 8 | 3.0% |
| 85 Years and Over | 0 | 0.0% |
| Total | 264 | 100.0% |
Housing Finances in Downieville Lawson Dumont
Median Income by Occupancy in Downieville Lawson Dumont
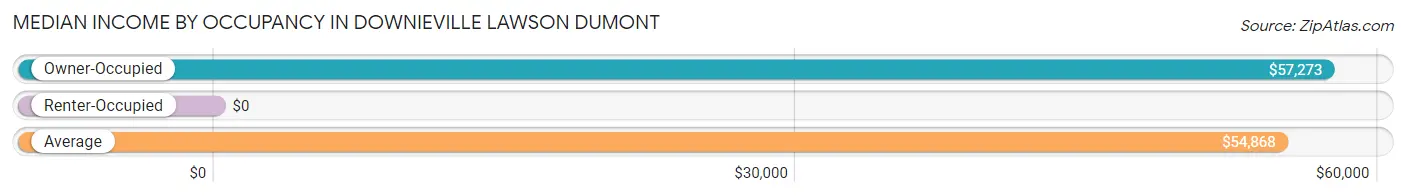
| Occupancy Type | # Households | Median Income |
| Owner-Occupied | 222 (84.1%) | $57,273 |
| Renter-Occupied | 42 (15.9%) | $0 |
| Average | 264 (100.0%) | $54,868 |
Occupancy by Householder Income Bracket in Downieville Lawson Dumont
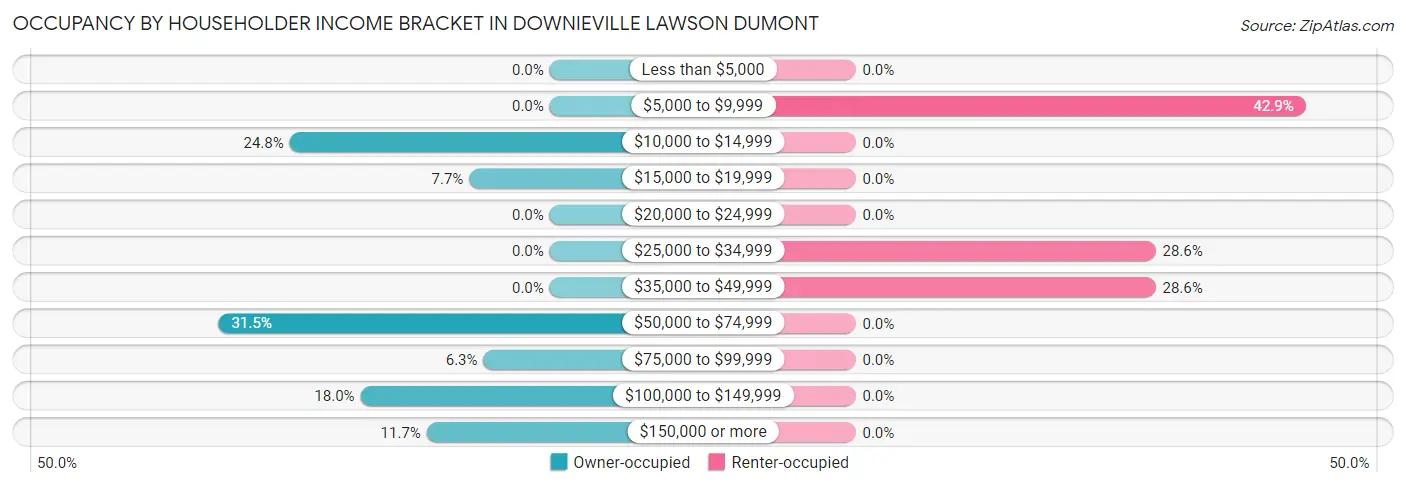
| Income Bracket | Owner-occupied | Renter-occupied |
| Less than $5,000 | 0 (0.0%) | 0 (0.0%) |
| $5,000 to $9,999 | 0 (0.0%) | 18 (42.9%) |
| $10,000 to $14,999 | 55 (24.8%) | 0 (0.0%) |
| $15,000 to $19,999 | 17 (7.7%) | 0 (0.0%) |
| $20,000 to $24,999 | 0 (0.0%) | 0 (0.0%) |
| $25,000 to $34,999 | 0 (0.0%) | 12 (28.6%) |
| $35,000 to $49,999 | 0 (0.0%) | 12 (28.6%) |
| $50,000 to $74,999 | 70 (31.5%) | 0 (0.0%) |
| $75,000 to $99,999 | 14 (6.3%) | 0 (0.0%) |
| $100,000 to $149,999 | 40 (18.0%) | 0 (0.0%) |
| $150,000 or more | 26 (11.7%) | 0 (0.0%) |
| Total | 222 (100.0%) | 42 (100.0%) |
Monthly Housing Cost Tiers in Downieville Lawson Dumont
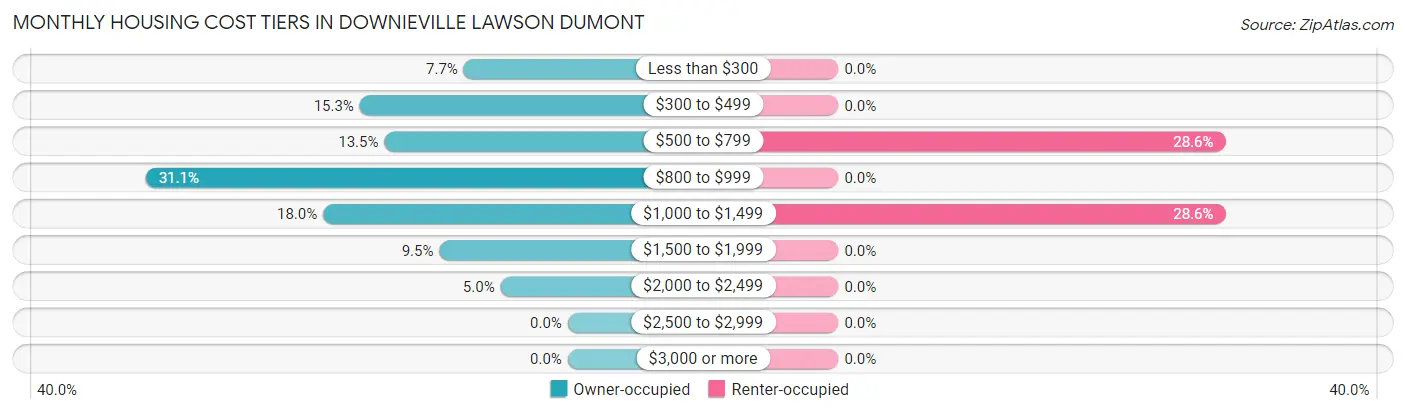
| Monthly Cost | Owner-occupied | Renter-occupied |
| Less than $300 | 17 (7.7%) | 0 (0.0%) |
| $300 to $499 | 34 (15.3%) | 0 (0.0%) |
| $500 to $799 | 30 (13.5%) | 12 (28.6%) |
| $800 to $999 | 69 (31.1%) | 0 (0.0%) |
| $1,000 to $1,499 | 40 (18.0%) | 12 (28.6%) |
| $1,500 to $1,999 | 21 (9.5%) | 0 (0.0%) |
| $2,000 to $2,499 | 11 (5.0%) | 0 (0.0%) |
| $2,500 to $2,999 | 0 (0.0%) | 0 (0.0%) |
| $3,000 or more | 0 (0.0%) | 0 (0.0%) |
| Total | 222 (100.0%) | 42 (100.0%) |
Physical Housing Characteristics in Downieville Lawson Dumont
Housing Structures in Downieville Lawson Dumont
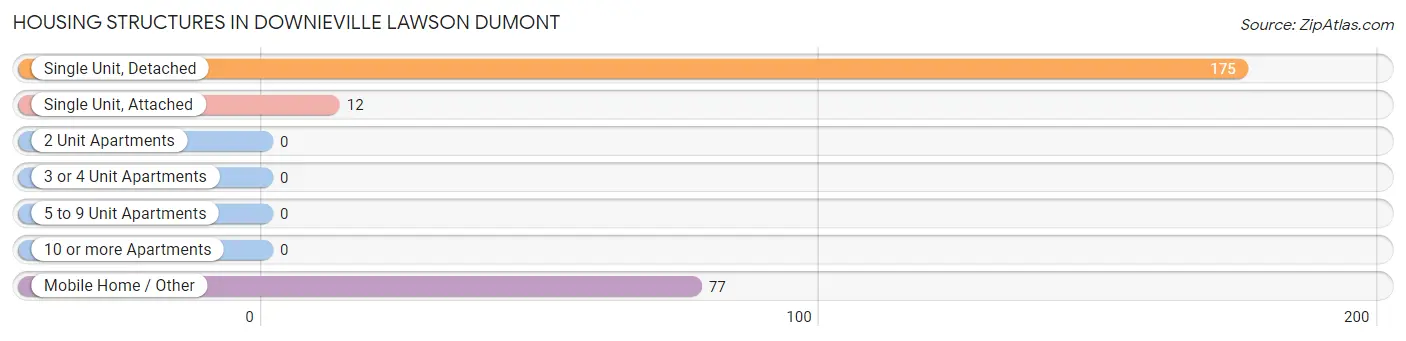
| Structure Type | # Housing Units | % Housing Units |
| Single Unit, Detached | 175 | 66.3% |
| Single Unit, Attached | 12 | 4.5% |
| 2 Unit Apartments | 0 | 0.0% |
| 3 or 4 Unit Apartments | 0 | 0.0% |
| 5 to 9 Unit Apartments | 0 | 0.0% |
| 10 or more Apartments | 0 | 0.0% |
| Mobile Home / Other | 77 | 29.2% |
| Total | 264 | 100.0% |
Housing Structures by Occupancy in Downieville Lawson Dumont
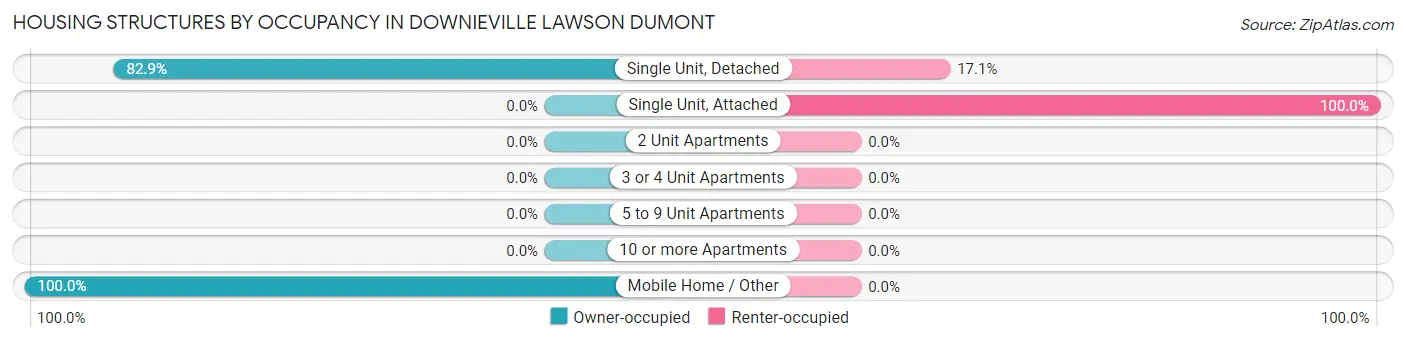
| Structure Type | Owner-occupied | Renter-occupied |
| Single Unit, Detached | 145 (82.9%) | 30 (17.1%) |
| Single Unit, Attached | 0 (0.0%) | 12 (100.0%) |
| 2 Unit Apartments | 0 (0.0%) | 0 (0.0%) |
| 3 or 4 Unit Apartments | 0 (0.0%) | 0 (0.0%) |
| 5 to 9 Unit Apartments | 0 (0.0%) | 0 (0.0%) |
| 10 or more Apartments | 0 (0.0%) | 0 (0.0%) |
| Mobile Home / Other | 77 (100.0%) | 0 (0.0%) |
| Total | 222 (84.1%) | 42 (15.9%) |
Housing Structures by Number of Rooms in Downieville Lawson Dumont
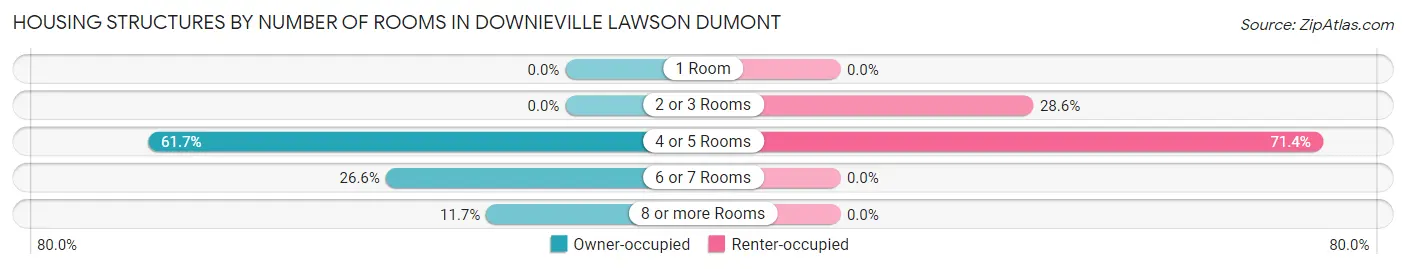
| Number of Rooms | Owner-occupied | Renter-occupied |
| 1 Room | 0 (0.0%) | 0 (0.0%) |
| 2 or 3 Rooms | 0 (0.0%) | 12 (28.6%) |
| 4 or 5 Rooms | 137 (61.7%) | 30 (71.4%) |
| 6 or 7 Rooms | 59 (26.6%) | 0 (0.0%) |
| 8 or more Rooms | 26 (11.7%) | 0 (0.0%) |
| Total | 222 (100.0%) | 42 (100.0%) |
Housing Structure by Heating Type in Downieville Lawson Dumont
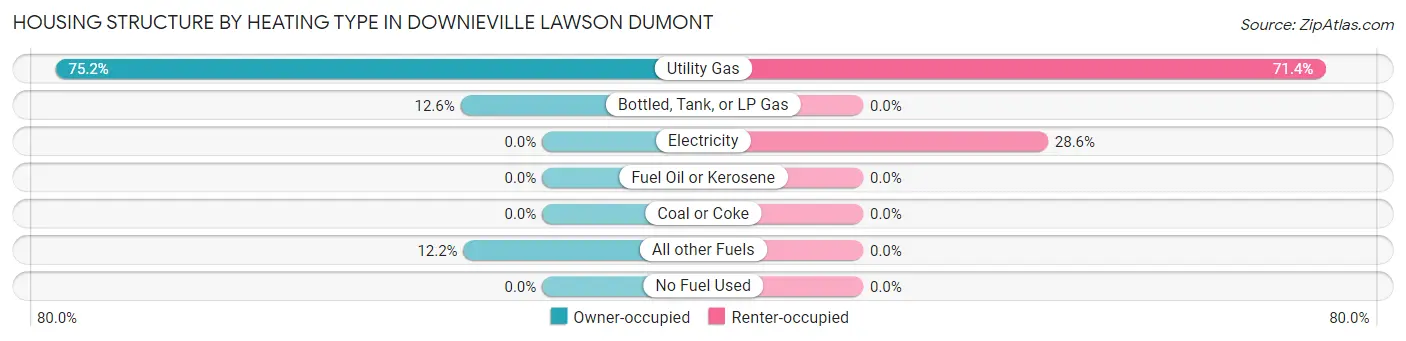
| Heating Type | Owner-occupied | Renter-occupied |
| Utility Gas | 167 (75.2%) | 30 (71.4%) |
| Bottled, Tank, or LP Gas | 28 (12.6%) | 0 (0.0%) |
| Electricity | 0 (0.0%) | 12 (28.6%) |
| Fuel Oil or Kerosene | 0 (0.0%) | 0 (0.0%) |
| Coal or Coke | 0 (0.0%) | 0 (0.0%) |
| All other Fuels | 27 (12.2%) | 0 (0.0%) |
| No Fuel Used | 0 (0.0%) | 0 (0.0%) |
| Total | 222 (100.0%) | 42 (100.0%) |
Household Vehicle Usage in Downieville Lawson Dumont
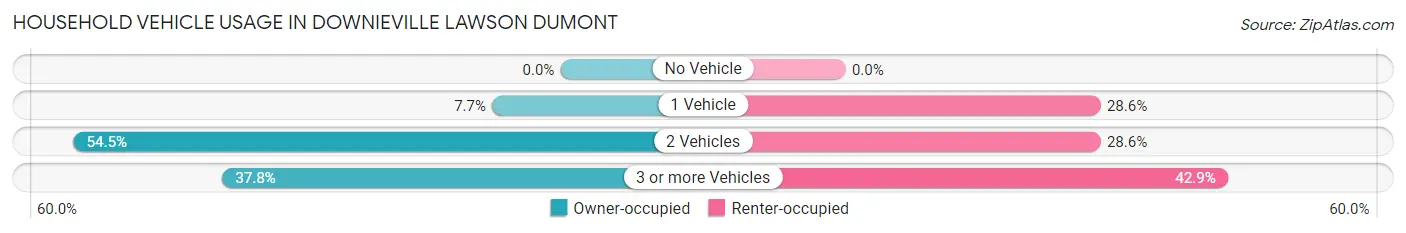
| Vehicles per Household | Owner-occupied | Renter-occupied |
| No Vehicle | 0 (0.0%) | 0 (0.0%) |
| 1 Vehicle | 17 (7.7%) | 12 (28.6%) |
| 2 Vehicles | 121 (54.5%) | 12 (28.6%) |
| 3 or more Vehicles | 84 (37.8%) | 18 (42.9%) |
| Total | 222 (100.0%) | 42 (100.0%) |
Real Estate & Mortgages in Downieville Lawson Dumont
Real Estate and Mortgage Overview in Downieville Lawson Dumont
| Characteristic | Without Mortgage | With Mortgage |
| Housing Units | 150 | 72 |
| Median Property Value | - | - |
| Median Household Income | - | - |
| Monthly Housing Costs | $625 | $0 |
| Real Estate Taxes | $199 | $0 |
Property Value by Mortgage Status in Downieville Lawson Dumont
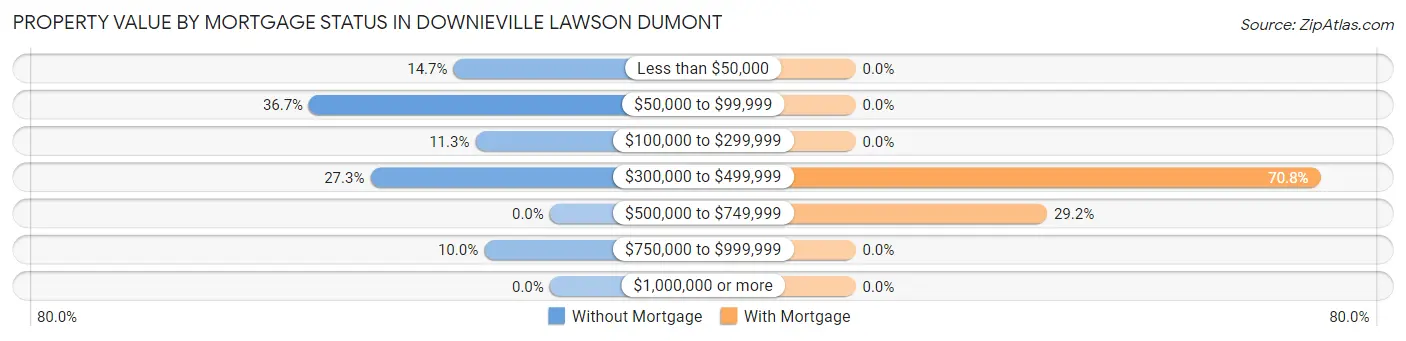
| Property Value | Without Mortgage | With Mortgage |
| Less than $50,000 | 22 (14.7%) | 0 (0.0%) |
| $50,000 to $99,999 | 55 (36.7%) | 0 (0.0%) |
| $100,000 to $299,999 | 17 (11.3%) | 0 (0.0%) |
| $300,000 to $499,999 | 41 (27.3%) | 51 (70.8%) |
| $500,000 to $749,999 | 0 (0.0%) | 21 (29.2%) |
| $750,000 to $999,999 | 15 (10.0%) | 0 (0.0%) |
| $1,000,000 or more | 0 (0.0%) | 0 (0.0%) |
| Total | 150 (100.0%) | 72 (100.0%) |
Household Income by Mortgage Status in Downieville Lawson Dumont
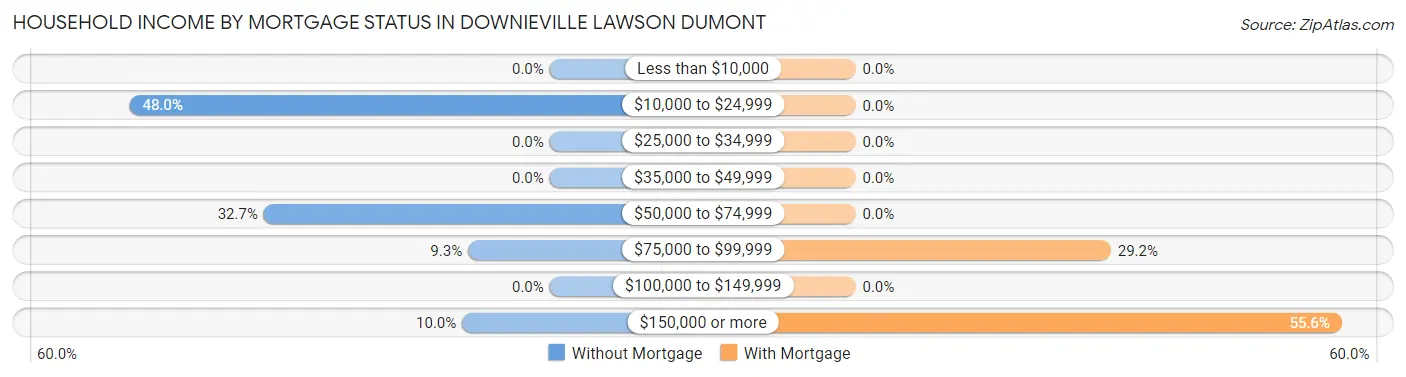
| Household Income | Without Mortgage | With Mortgage |
| Less than $10,000 | 0 (0.0%) | 0 (0.0%) |
| $10,000 to $24,999 | 72 (48.0%) | 0 (0.0%) |
| $25,000 to $34,999 | 0 (0.0%) | 0 (0.0%) |
| $35,000 to $49,999 | 0 (0.0%) | 0 (0.0%) |
| $50,000 to $74,999 | 49 (32.7%) | 0 (0.0%) |
| $75,000 to $99,999 | 14 (9.3%) | 21 (29.2%) |
| $100,000 to $149,999 | 0 (0.0%) | 0 (0.0%) |
| $150,000 or more | 15 (10.0%) | 40 (55.6%) |
| Total | 150 (100.0%) | 72 (100.0%) |
Property Value to Household Income Ratio in Downieville Lawson Dumont
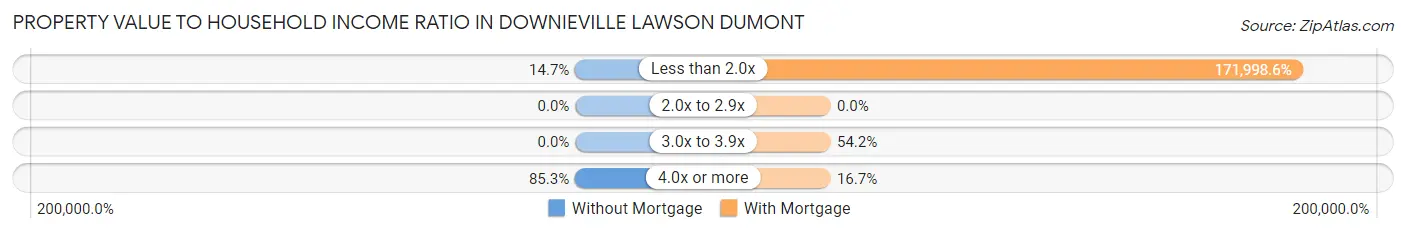
| Value-to-Income Ratio | Without Mortgage | With Mortgage |
| Less than 2.0x | 22 (14.7%) | 123,839 (171,998.6%) |
| 2.0x to 2.9x | 0 (0.0%) | 0 (0.0%) |
| 3.0x to 3.9x | 0 (0.0%) | 39 (54.2%) |
| 4.0x or more | 128 (85.3%) | 12 (16.7%) |
| Total | 150 (100.0%) | 72 (100.0%) |
Real Estate Taxes by Mortgage Status in Downieville Lawson Dumont
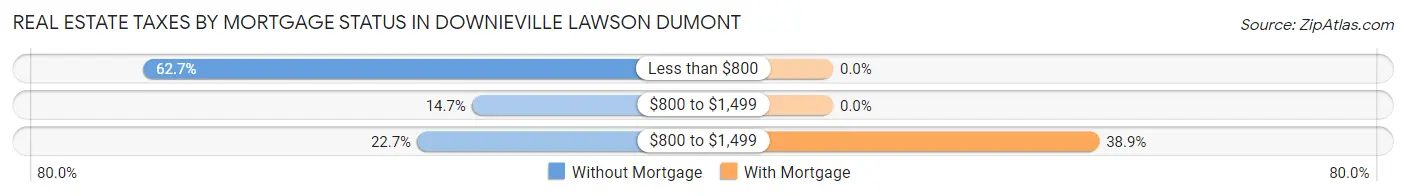
| Property Taxes | Without Mortgage | With Mortgage |
| Less than $800 | 94 (62.7%) | 0 (0.0%) |
| $800 to $1,499 | 22 (14.7%) | 0 (0.0%) |
| $800 to $1,499 | 34 (22.7%) | 28 (38.9%) |
| Total | 150 (100.0%) | 72 (100.0%) |
Health & Disability in Downieville Lawson Dumont
Health Insurance Coverage by Age in Downieville Lawson Dumont
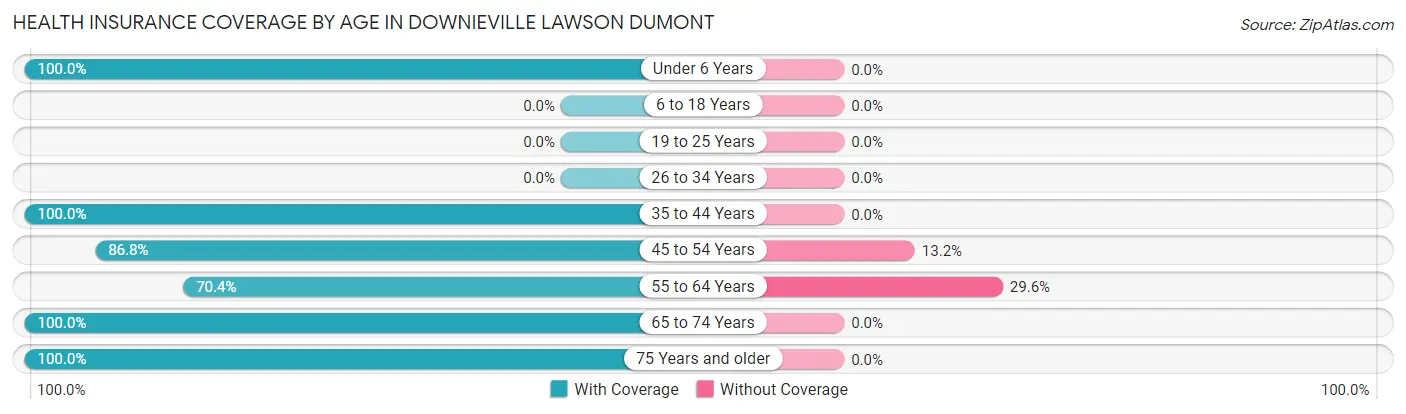
| Age Bracket | With Coverage | Without Coverage |
| Under 6 Years | 17 (100.0%) | 0 (0.0%) |
| 6 to 18 Years | 0 (0.0%) | 0 (0.0%) |
| 19 to 25 Years | 0 (0.0%) | 0 (0.0%) |
| 26 to 34 Years | 0 (0.0%) | 0 (0.0%) |
| 35 to 44 Years | 106 (100.0%) | 0 (0.0%) |
| 45 to 54 Years | 178 (86.8%) | 27 (13.2%) |
| 55 to 64 Years | 50 (70.4%) | 21 (29.6%) |
| 65 to 74 Years | 131 (100.0%) | 0 (0.0%) |
| 75 Years and older | 28 (100.0%) | 0 (0.0%) |
| Total | 510 (91.4%) | 48 (8.6%) |
Health Insurance Coverage by Citizenship Status in Downieville Lawson Dumont
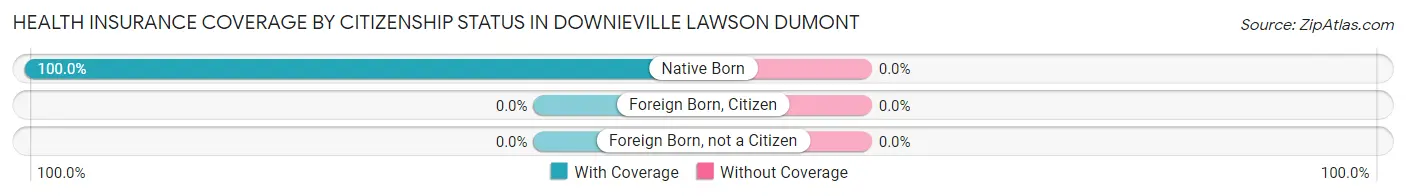
| Citizenship Status | With Coverage | Without Coverage |
| Native Born | 17 (100.0%) | 0 (0.0%) |
| Foreign Born, Citizen | 0 (0.0%) | 0 (0.0%) |
| Foreign Born, not a Citizen | 0 (0.0%) | 0 (0.0%) |
Health Insurance Coverage by Household Income in Downieville Lawson Dumont
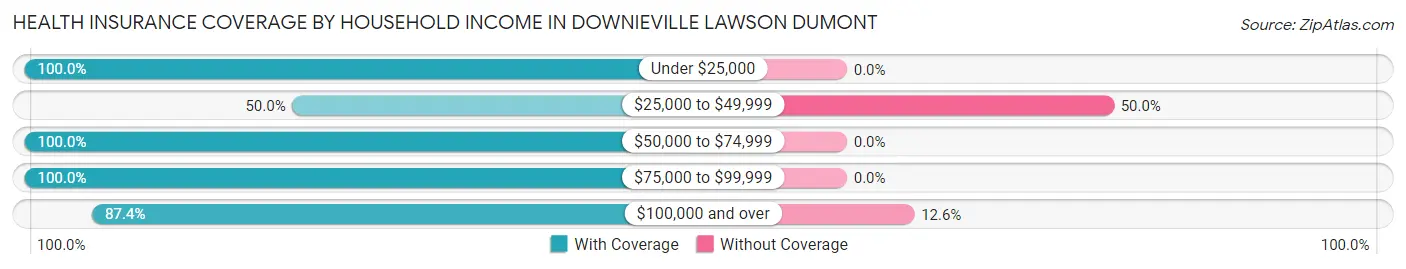
| Household Income | With Coverage | Without Coverage |
| Under $25,000 | 90 (100.0%) | 0 (0.0%) |
| $25,000 to $49,999 | 12 (50.0%) | 12 (50.0%) |
| $50,000 to $74,999 | 145 (100.0%) | 0 (0.0%) |
| $75,000 to $99,999 | 14 (100.0%) | 0 (0.0%) |
| $100,000 and over | 249 (87.4%) | 36 (12.6%) |
Public vs Private Health Insurance Coverage by Age in Downieville Lawson Dumont
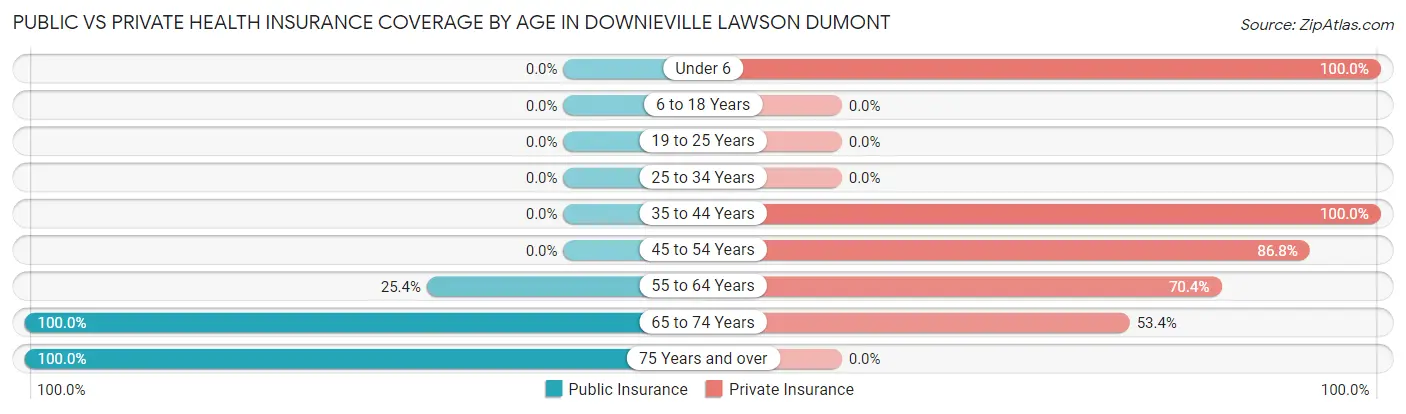
| Age Bracket | Public Insurance | Private Insurance |
| Under 6 | 0 (0.0%) | 17 (100.0%) |
| 6 to 18 Years | 0 (0.0%) | 0 (0.0%) |
| 19 to 25 Years | 0 (0.0%) | 0 (0.0%) |
| 25 to 34 Years | 0 (0.0%) | 0 (0.0%) |
| 35 to 44 Years | 0 (0.0%) | 106 (100.0%) |
| 45 to 54 Years | 0 (0.0%) | 178 (86.8%) |
| 55 to 64 Years | 18 (25.4%) | 50 (70.4%) |
| 65 to 74 Years | 131 (100.0%) | 70 (53.4%) |
| 75 Years and over | 28 (100.0%) | 0 (0.0%) |
| Total | 177 (31.7%) | 421 (75.4%) |
Disability Status by Sex by Age in Downieville Lawson Dumont
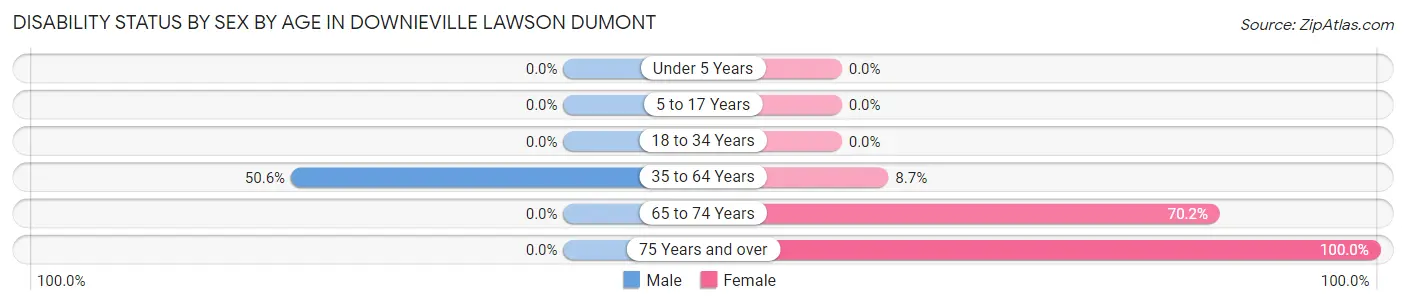
| Age Bracket | Male | Female |
| Under 5 Years | 0 (0.0%) | 0 (0.0%) |
| 5 to 17 Years | 0 (0.0%) | 0 (0.0%) |
| 18 to 34 Years | 0 (0.0%) | 0 (0.0%) |
| 35 to 64 Years | 88 (50.6%) | 18 (8.6%) |
| 65 to 74 Years | 0 (0.0%) | 47 (70.2%) |
| 75 Years and over | 0 (0.0%) | 8 (100.0%) |
Disability Class by Sex by Age in Downieville Lawson Dumont
Disability Class: Hearing Difficulty
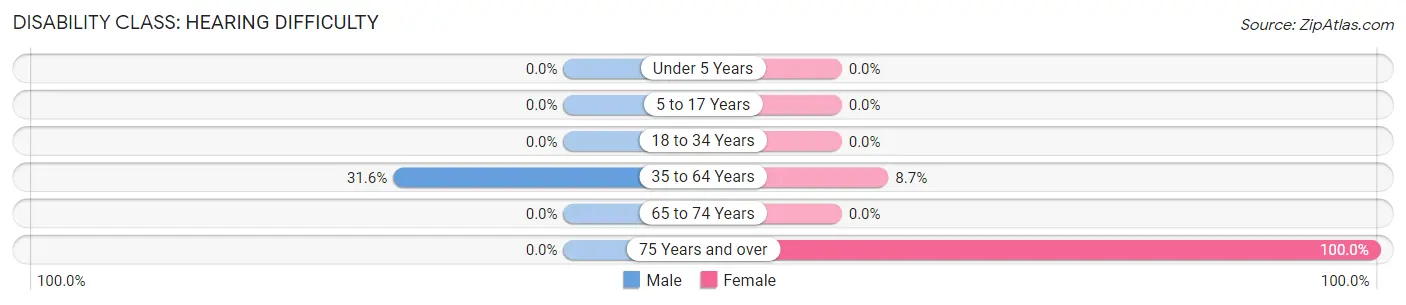
| Age Bracket | Male | Female |
| Under 5 Years | 0 (0.0%) | 0 (0.0%) |
| 5 to 17 Years | 0 (0.0%) | 0 (0.0%) |
| 18 to 34 Years | 0 (0.0%) | 0 (0.0%) |
| 35 to 64 Years | 55 (31.6%) | 18 (8.6%) |
| 65 to 74 Years | 0 (0.0%) | 0 (0.0%) |
| 75 Years and over | 0 (0.0%) | 8 (100.0%) |
Disability Class: Vision Difficulty
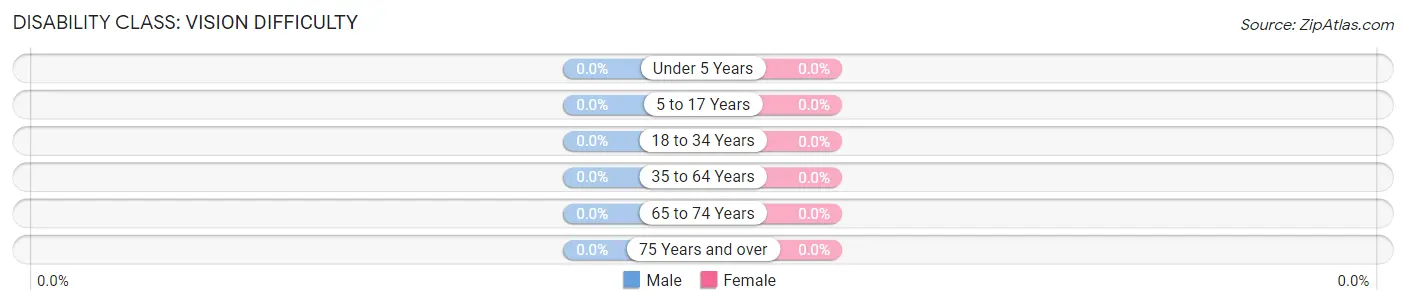
| Age Bracket | Male | Female |
| Under 5 Years | 0 (0.0%) | 0 (0.0%) |
| 5 to 17 Years | 0 (0.0%) | 0 (0.0%) |
| 18 to 34 Years | 0 (0.0%) | 0 (0.0%) |
| 35 to 64 Years | 0 (0.0%) | 0 (0.0%) |
| 65 to 74 Years | 0 (0.0%) | 0 (0.0%) |
| 75 Years and over | 0 (0.0%) | 0 (0.0%) |
Disability Class: Cognitive Difficulty
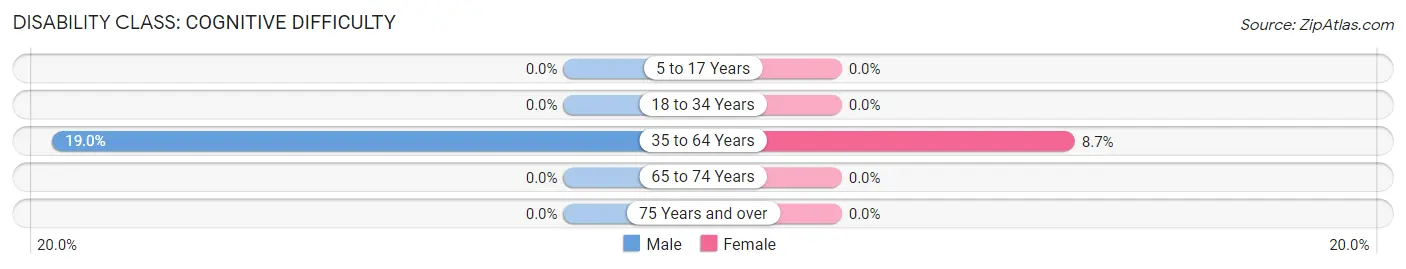
| Age Bracket | Male | Female |
| 5 to 17 Years | 0 (0.0%) | 0 (0.0%) |
| 18 to 34 Years | 0 (0.0%) | 0 (0.0%) |
| 35 to 64 Years | 33 (19.0%) | 18 (8.6%) |
| 65 to 74 Years | 0 (0.0%) | 0 (0.0%) |
| 75 Years and over | 0 (0.0%) | 0 (0.0%) |
Disability Class: Ambulatory Difficulty
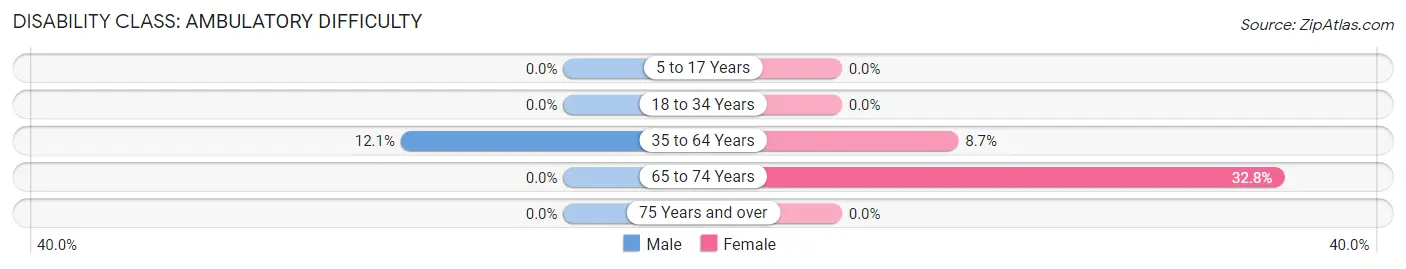
| Age Bracket | Male | Female |
| 5 to 17 Years | 0 (0.0%) | 0 (0.0%) |
| 18 to 34 Years | 0 (0.0%) | 0 (0.0%) |
| 35 to 64 Years | 21 (12.1%) | 18 (8.6%) |
| 65 to 74 Years | 0 (0.0%) | 22 (32.8%) |
| 75 Years and over | 0 (0.0%) | 0 (0.0%) |
Disability Class: Self-Care Difficulty
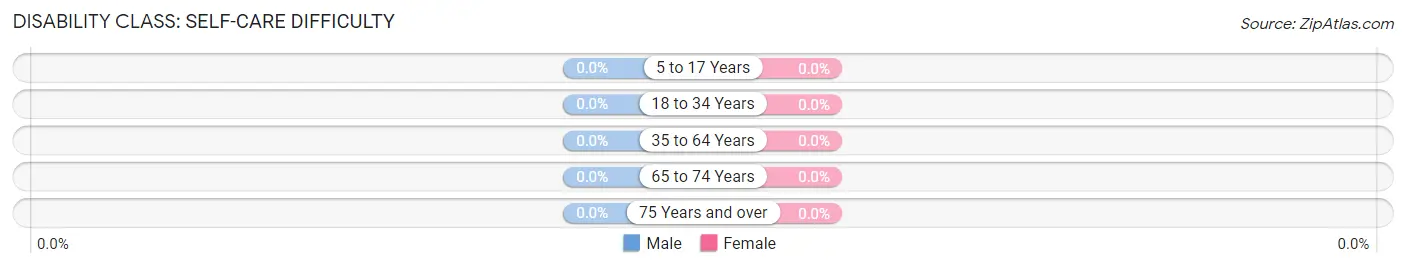
| Age Bracket | Male | Female |
| 5 to 17 Years | 0 (0.0%) | 0 (0.0%) |
| 18 to 34 Years | 0 (0.0%) | 0 (0.0%) |
| 35 to 64 Years | 0 (0.0%) | 0 (0.0%) |
| 65 to 74 Years | 0 (0.0%) | 0 (0.0%) |
| 75 Years and over | 0 (0.0%) | 0 (0.0%) |
Technology Access in Downieville Lawson Dumont
Computing Device Access in Downieville Lawson Dumont
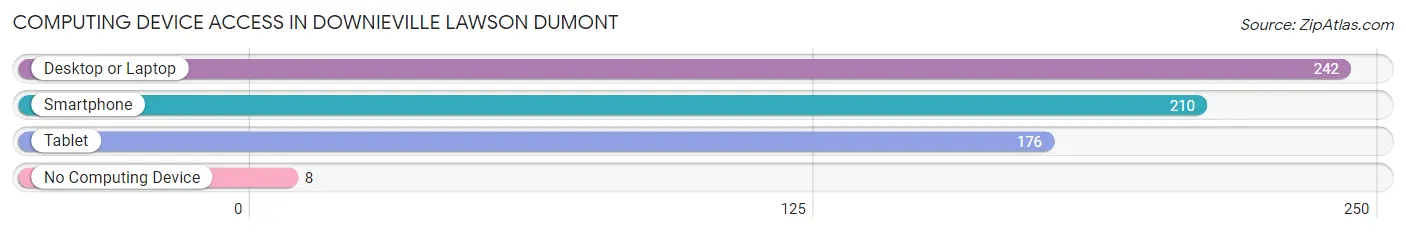
| Device Type | # Households | % Households |
| Desktop or Laptop | 242 | 91.7% |
| Smartphone | 210 | 79.5% |
| Tablet | 176 | 66.7% |
| No Computing Device | 8 | 3.0% |
| Total | 264 | 100.0% |
Internet Access in Downieville Lawson Dumont
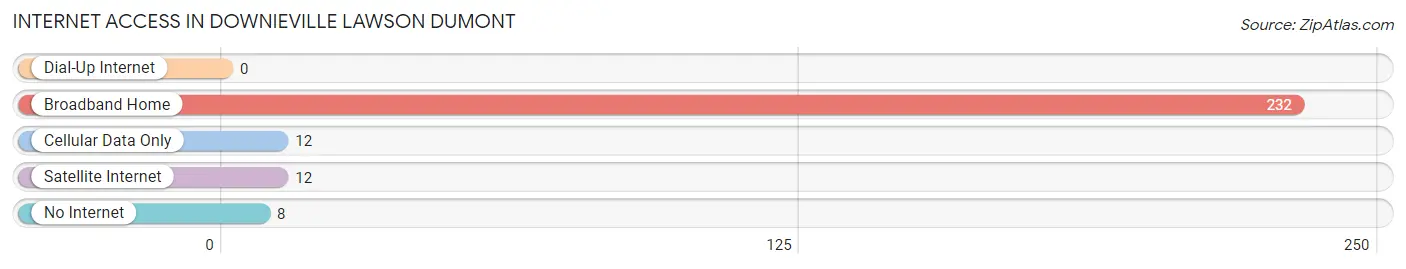
| Internet Type | # Households | % Households |
| Dial-Up Internet | 0 | 0.0% |
| Broadband Home | 232 | 87.9% |
| Cellular Data Only | 12 | 4.5% |
| Satellite Internet | 12 | 4.5% |
| No Internet | 8 | 3.0% |
| Total | 264 | 100.0% |
Downieville Lawson Dumont Summary
Downieville Lawson Dumont, CO is a small unincorporated community located in the foothills of the Rocky Mountains in Clear Creek County, Colorado. The town is situated at an elevation of 8,400 feet and is surrounded by the Arapaho National Forest. The town was founded in 1859 by prospectors who were searching for gold in the area. The town was named after two of the prospectors, John Downie and William Lawson.
History
Downieville Lawson Dumont was founded in 1859 by prospectors John Downie and William Lawson. The two men were searching for gold in the area and found a rich vein of ore in the nearby hills. The town was named after the two men and quickly grew as more prospectors moved to the area. The town was incorporated in 1876 and was home to a variety of businesses, including a hotel, saloon, general store, and post office.
The town was a popular destination for miners and prospectors during the late 19th century. The town was also home to a variety of other businesses, including a blacksmith, livery stable, and a school. The town was also home to a variety of churches, including the Methodist Episcopal Church, the Presbyterian Church, and the Catholic Church.
The town experienced a decline in population during the early 20th century as the gold rush ended and the mining industry declined. The town was also affected by the Great Depression and World War II. The population of the town decreased from a peak of over 500 in the late 19th century to just over 100 in the early 21st century.
Geography
Downieville Lawson Dumont is located in Clear Creek County, Colorado. The town is situated at an elevation of 8,400 feet and is surrounded by the Arapaho National Forest. The town is located in the foothills of the Rocky Mountains and is approximately 25 miles west of Denver. The town is located on the banks of Clear Creek and is surrounded by mountains and forests.
The town is located in a semi-arid climate and experiences hot summers and cold winters. The average temperature in the summer is around 70 degrees Fahrenheit and the average temperature in the winter is around 20 degrees Fahrenheit. The town receives an average of 18 inches of precipitation per year.
Economy
Downieville Lawson Dumont is a small unincorporated community and does not have a large economy. The town is home to a variety of small businesses, including a general store, a post office, and a few restaurants. The town is also home to a variety of outdoor recreation activities, including camping, fishing, and hiking.
The town is also home to a variety of tourist attractions, including the historic Downieville Lawson Dumont Cemetery and the nearby Arapaho National Forest. The town is also home to a variety of festivals and events, including the annual Downieville Lawson Dumont Days celebration.
Demographics
As of the 2010 census, the population of Downieville Lawson Dumont was 109. The town is predominantly white, with 95.4% of the population identifying as white. The town is also home to a small Hispanic population, with 4.6% of the population identifying as Hispanic or Latino. The median household income in the town is $45,000 and the median home value is $220,000.
Common Questions
What is Per Capita Income in Downieville Lawson Dumont?
Per Capita income in Downieville Lawson Dumont is $43,417.
What is the Median Household income in Downieville Lawson Dumont?
Median Household Income in Downieville Lawson Dumont is $54,868.
What is Inequality or Gini Index in Downieville Lawson Dumont?
Inequality or Gini Index in Downieville Lawson Dumont is 0.47.
What is the Total Population of Downieville Lawson Dumont?
Total Population of Downieville Lawson Dumont is 558.
What is the Total Male Population of Downieville Lawson Dumont?
Total Male Population of Downieville Lawson Dumont is 275.
What is the Total Female Population of Downieville Lawson Dumont?
Total Female Population of Downieville Lawson Dumont is 283.
What is the Ratio of Males per 100 Females in Downieville Lawson Dumont?
There are 97.17 Males per 100 Females in Downieville Lawson Dumont.
What is the Ratio of Females per 100 Males in Downieville Lawson Dumont?
There are 102.91 Females per 100 Males in Downieville Lawson Dumont.
What is the Median Population Age in Downieville Lawson Dumont?
Median Population Age in Downieville Lawson Dumont is 52.8 Years.
What is the Average Family Size in Downieville Lawson Dumont
Average Family Size in Downieville Lawson Dumont is 3.2 People.
What is the Average Household Size in Downieville Lawson Dumont
Average Household Size in Downieville Lawson Dumont is 2.1 People.
How Large is the Labor Force in Downieville Lawson Dumont?
There are 364 People in the Labor Forcein in Downieville Lawson Dumont.
What is the Percentage of People in the Labor Force in Downieville Lawson Dumont?
67.3% of People are in the Labor Force in Downieville Lawson Dumont.