Zip Codes with the Highest Percentage of Population Employed in Health Diagnosing & Treating in Pueblo, CO
RELATED REPORTS & OPTIONS
Health Diagnosing & Treating
Pueblo
Compare Zip Codes
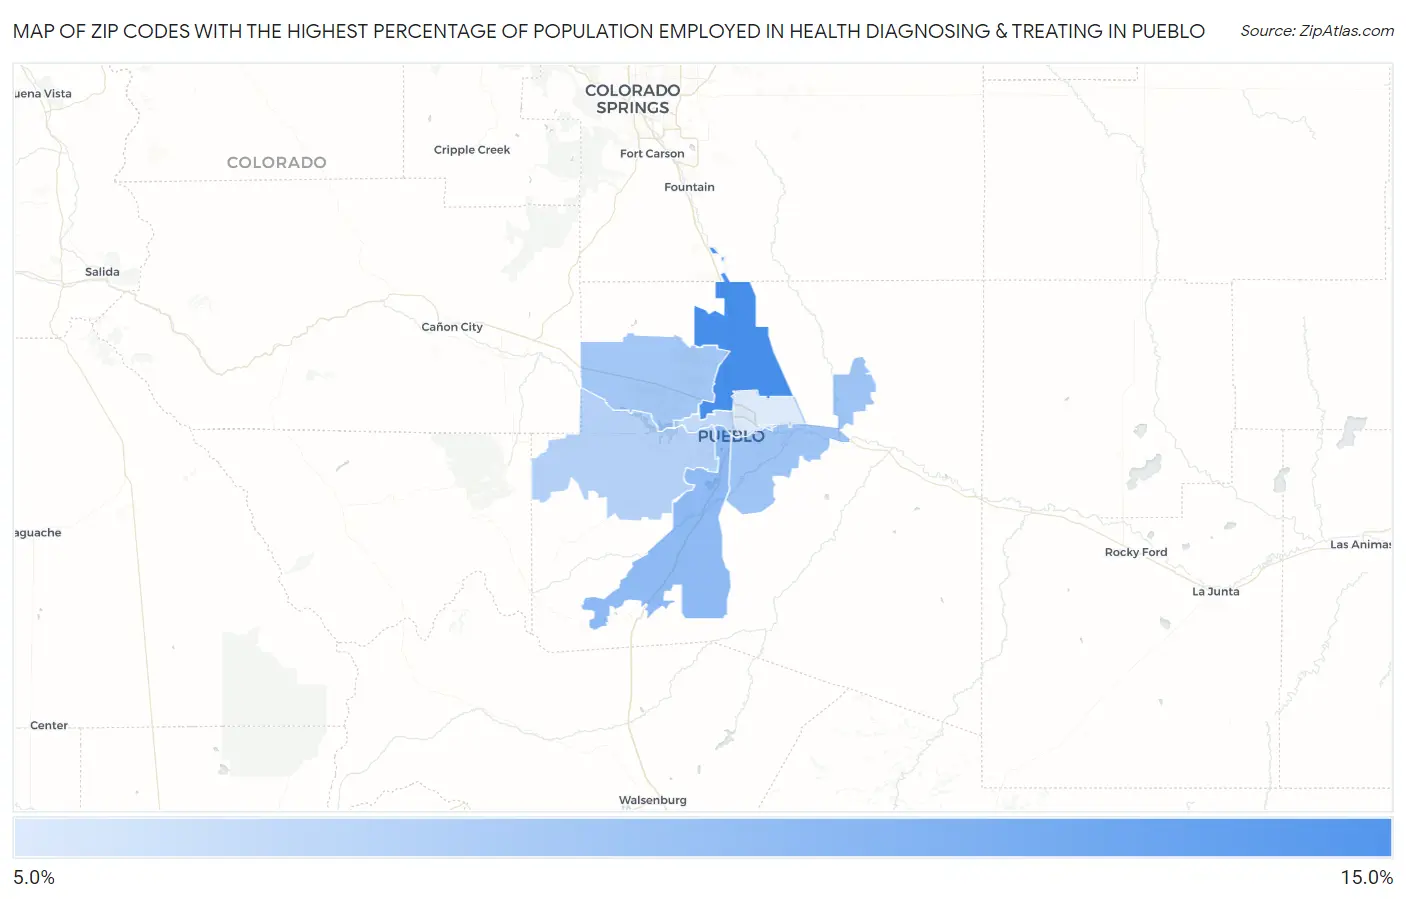
Map of Zip Codes with the Highest Percentage of Population Employed in Health Diagnosing & Treating in Pueblo
5.1%
12.2%
Zip Codes with the Highest Percentage of Population Employed in Health Diagnosing & Treating in Pueblo, CO
| Zip Code | % Employed | vs State | vs National | |
| 1. | 81008 | 12.2% | 5.8%(+6.42)#32 | 6.2%(+5.98)#2,091 |
| 2. | 81004 | 8.8% | 5.8%(+2.98)#70 | 6.2%(+2.54)#5,777 |
| 3. | 81006 | 8.0% | 5.8%(+2.17)#89 | 6.2%(+1.73)#7,571 |
| 4. | 81007 | 7.8% | 5.8%(+1.98)#98 | 6.2%(+1.54)#8,026 |
| 5. | 81005 | 7.0% | 5.8%(+1.19)#139 | 6.2%(+0.752)#10,364 |
| 6. | 81003 | 6.3% | 5.8%(+0.530)#169 | 6.2%(+0.093)#12,618 |
| 7. | 81001 | 5.1% | 5.8%(-0.701)#240 | 6.2%(-1.14)#17,304 |
1
Common Questions
What are the Top 5 Zip Codes with the Highest Percentage of Population Employed in Health Diagnosing & Treating in Pueblo, CO?
Top 5 Zip Codes with the Highest Percentage of Population Employed in Health Diagnosing & Treating in Pueblo, CO are:
What zip code has the Highest Percentage of Population Employed in Health Diagnosing & Treating in Pueblo, CO?
81008 has the Highest Percentage of Population Employed in Health Diagnosing & Treating in Pueblo, CO with 12.2%.
What is the Percentage of Population Employed in Health Diagnosing & Treating in Pueblo, CO?
Percentage of Population Employed in Health Diagnosing & Treating in Pueblo is 7.3%.
What is the Percentage of Population Employed in Health Diagnosing & Treating in Colorado?
Percentage of Population Employed in Health Diagnosing & Treating in Colorado is 5.8%.
What is the Percentage of Population Employed in Health Diagnosing & Treating in the United States?
Percentage of Population Employed in Health Diagnosing & Treating in the United States is 6.2%.