Zip Codes with the Highest Percentage of Population Employed in Health Diagnosing & Treating in Montrose, CO
RELATED REPORTS & OPTIONS
Health Diagnosing & Treating
Montrose
Compare Zip Codes
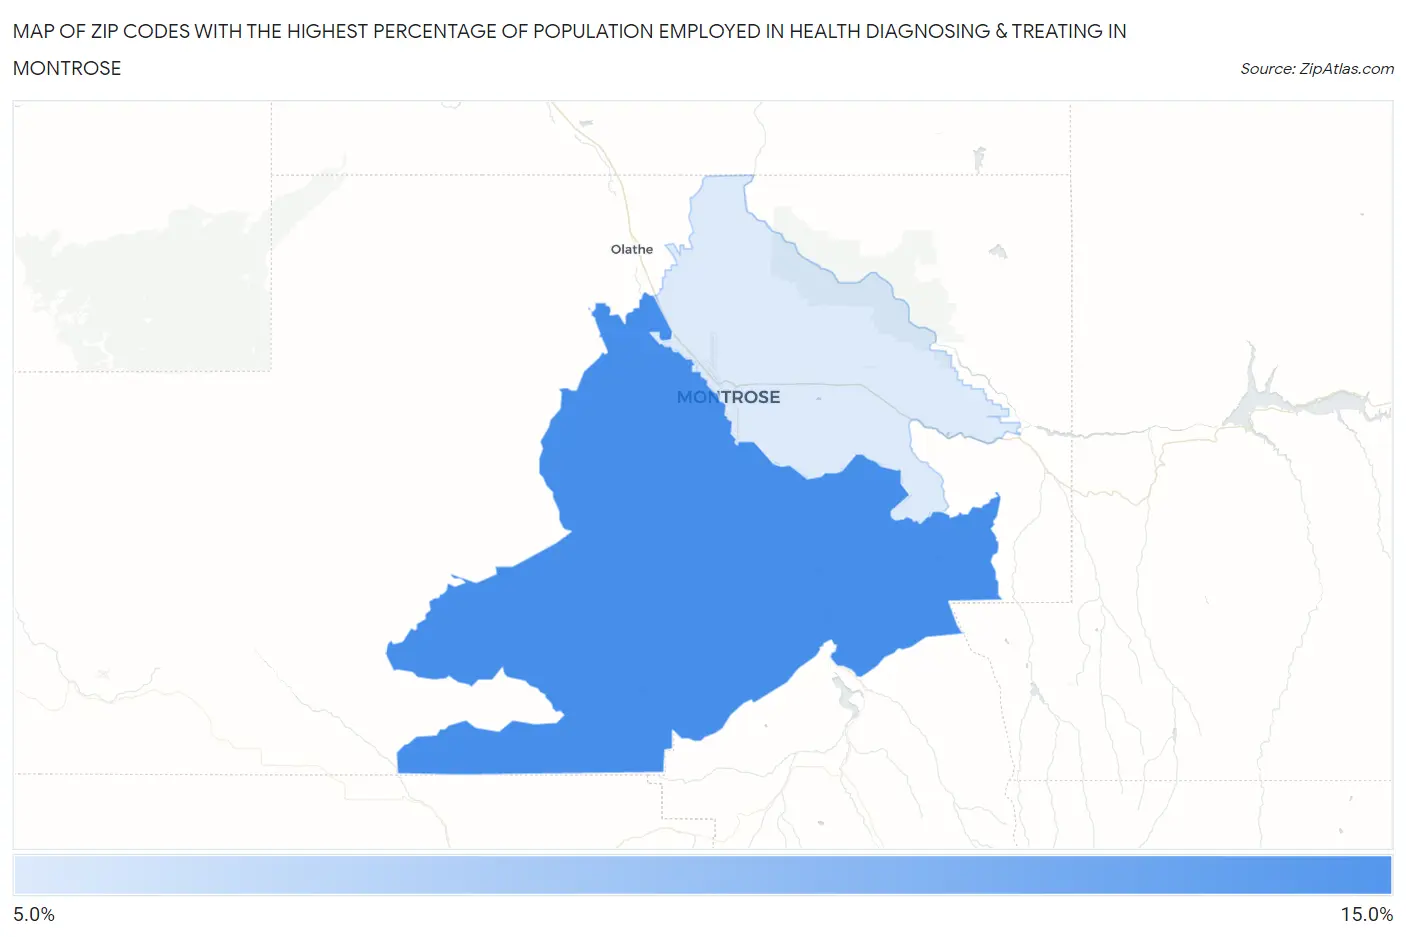
Map of Zip Codes with the Highest Percentage of Population Employed in Health Diagnosing & Treating in Montrose
6.9%
11.2%
Zip Codes with the Highest Percentage of Population Employed in Health Diagnosing & Treating in Montrose, CO
| Zip Code | % Employed | vs State | vs National | |
| 1. | 81403 | 11.2% | 5.8%(+5.37)#35 | 6.2%(+4.94)#2,758 |
| 2. | 81401 | 6.9% | 5.8%(+1.06)#147 | 6.2%(+0.620)#10,794 |
1
Common Questions
What are the Top Zip Codes with the Highest Percentage of Population Employed in Health Diagnosing & Treating in Montrose, CO?
Top Zip Codes with the Highest Percentage of Population Employed in Health Diagnosing & Treating in Montrose, CO are:
What zip code has the Highest Percentage of Population Employed in Health Diagnosing & Treating in Montrose, CO?
81403 has the Highest Percentage of Population Employed in Health Diagnosing & Treating in Montrose, CO with 11.2%.
What is the Percentage of Population Employed in Health Diagnosing & Treating in Montrose, CO?
Percentage of Population Employed in Health Diagnosing & Treating in Montrose is 8.2%.
What is the Percentage of Population Employed in Health Diagnosing & Treating in Colorado?
Percentage of Population Employed in Health Diagnosing & Treating in Colorado is 5.8%.
What is the Percentage of Population Employed in Health Diagnosing & Treating in the United States?
Percentage of Population Employed in Health Diagnosing & Treating in the United States is 6.2%.