Zip Codes with the Highest Percentage of Population Employed in Health Diagnosing & Treating in Arvada, CO
RELATED REPORTS & OPTIONS
Health Diagnosing & Treating
Arvada
Compare Zip Codes
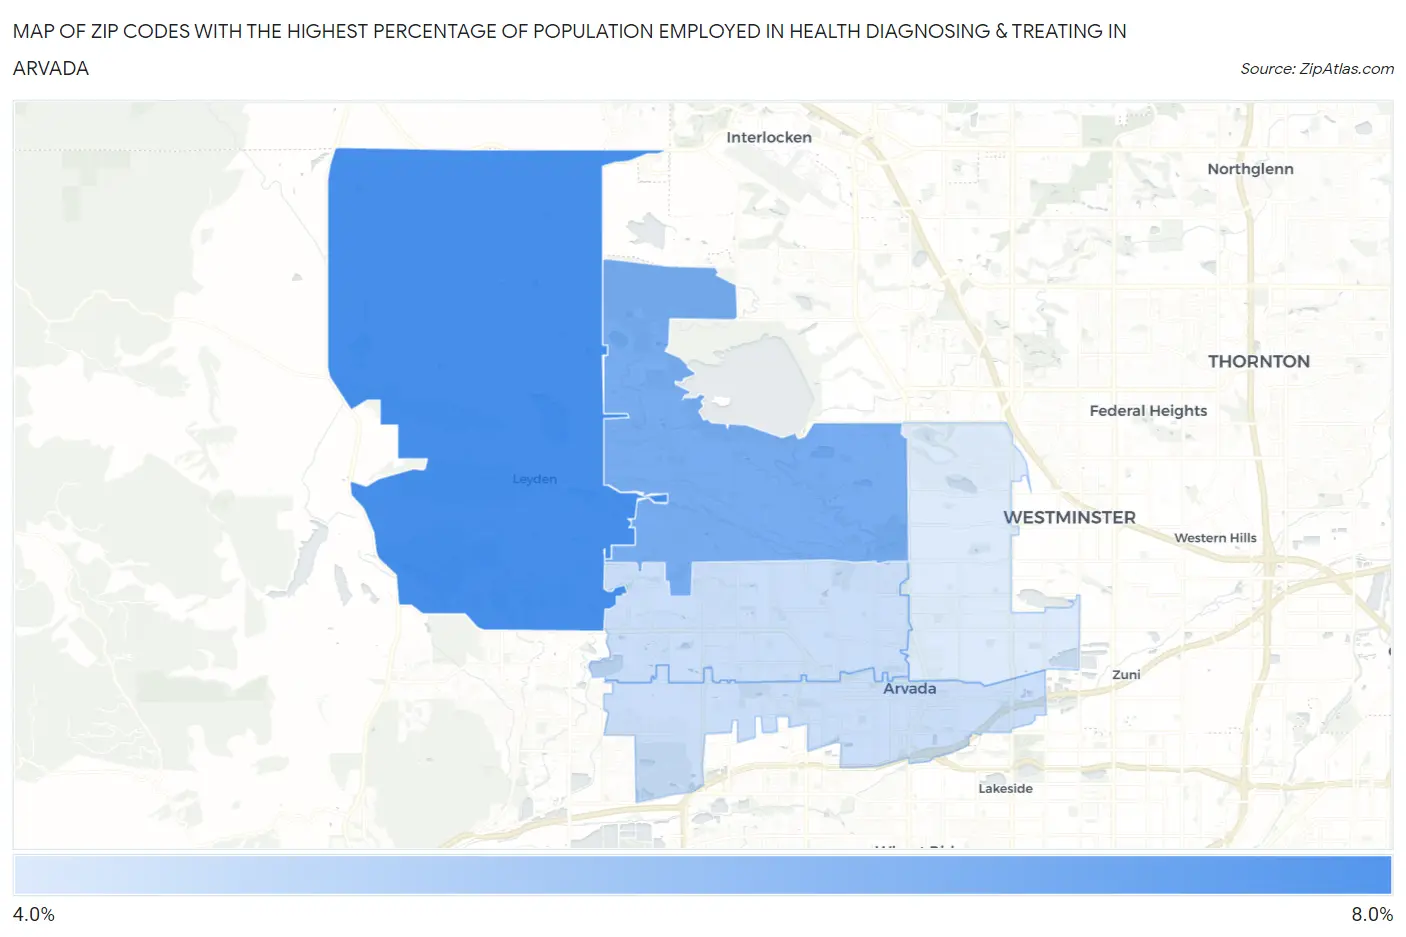
Map of Zip Codes with the Highest Percentage of Population Employed in Health Diagnosing & Treating in Arvada
4.5%
7.0%
Zip Codes with the Highest Percentage of Population Employed in Health Diagnosing & Treating in Arvada, CO
| Zip Code | % Employed | vs State | vs National | |
| 1. | 80007 | 7.0% | 5.8%(+1.23)#137 | 6.2%(+0.792)#10,243 |
| 2. | 80005 | 6.2% | 5.8%(+0.397)#177 | 6.2%(-0.040)#13,131 |
| 3. | 80004 | 4.8% | 5.8%(-0.976)#261 | 6.2%(-1.41)#18,367 |
| 4. | 80002 | 4.8% | 5.8%(-0.993)#264 | 6.2%(-1.43)#18,448 |
| 5. | 80003 | 4.5% | 5.8%(-1.30)#278 | 6.2%(-1.74)#19,611 |
1
Common Questions
What are the Top 3 Zip Codes with the Highest Percentage of Population Employed in Health Diagnosing & Treating in Arvada, CO?
Top 3 Zip Codes with the Highest Percentage of Population Employed in Health Diagnosing & Treating in Arvada, CO are:
What zip code has the Highest Percentage of Population Employed in Health Diagnosing & Treating in Arvada, CO?
80007 has the Highest Percentage of Population Employed in Health Diagnosing & Treating in Arvada, CO with 7.0%.
What is the Percentage of Population Employed in Health Diagnosing & Treating in Arvada, CO?
Percentage of Population Employed in Health Diagnosing & Treating in Arvada is 5.7%.
What is the Percentage of Population Employed in Health Diagnosing & Treating in Colorado?
Percentage of Population Employed in Health Diagnosing & Treating in Colorado is 5.8%.
What is the Percentage of Population Employed in Health Diagnosing & Treating in the United States?
Percentage of Population Employed in Health Diagnosing & Treating in the United States is 6.2%.