Zip Codes with the Highest Percentage of Population Employed in Health Diagnosing & Treating in Englewood, CO
RELATED REPORTS & OPTIONS
Health Diagnosing & Treating
Englewood
Compare Zip Codes
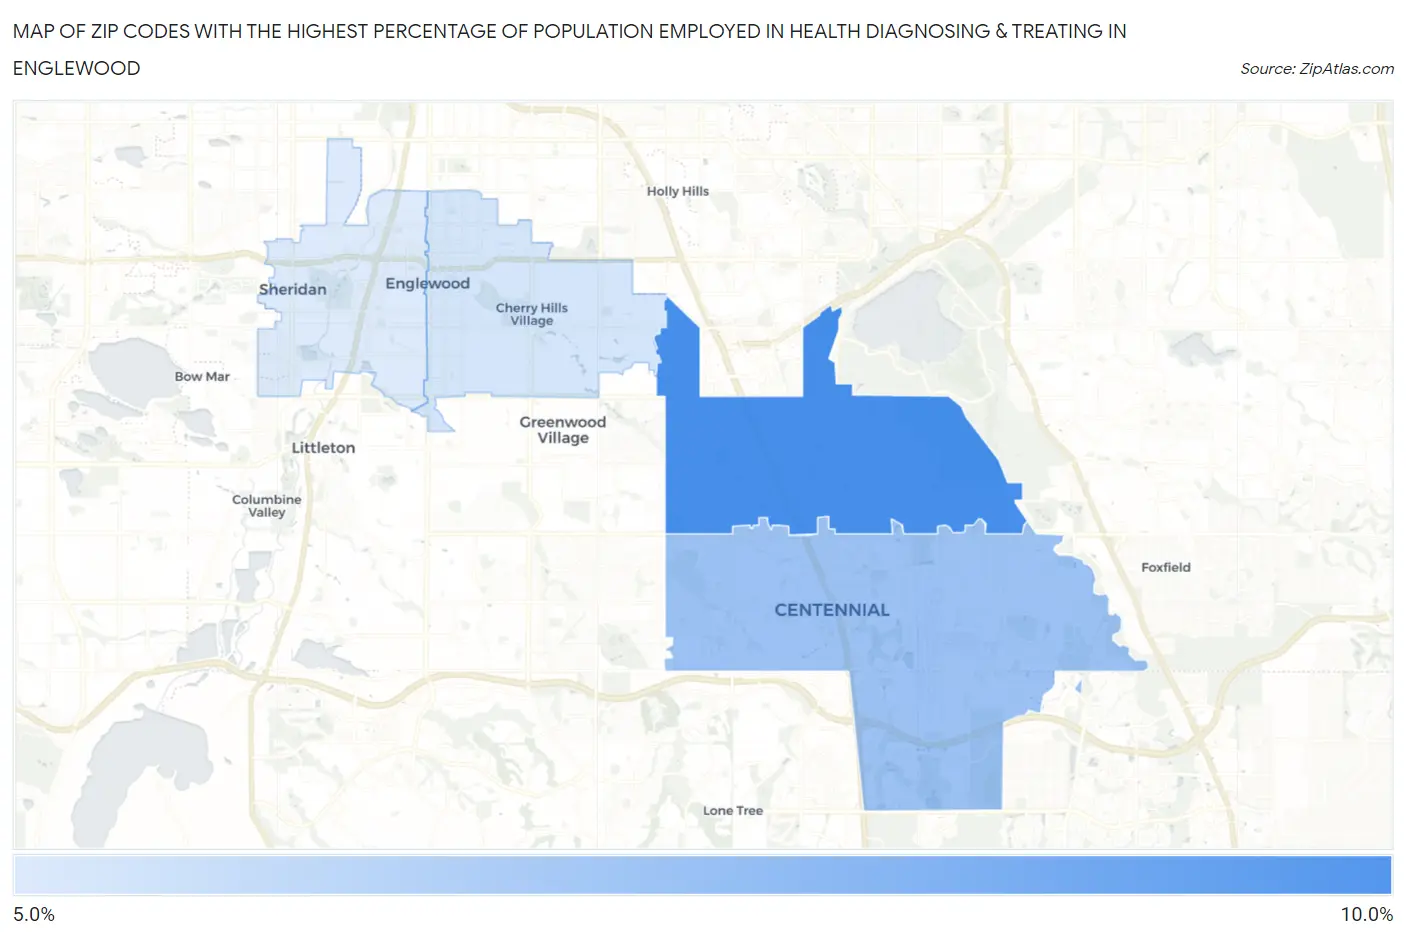
Map of Zip Codes with the Highest Percentage of Population Employed in Health Diagnosing & Treating in Englewood
5.7%
8.7%
Zip Codes with the Highest Percentage of Population Employed in Health Diagnosing & Treating in Englewood, CO
| Zip Code | % Employed | vs State | vs National | |
| 1. | 80111 | 8.7% | 5.8%(+2.90)#76 | 6.2%(+2.46)#5,923 |
| 2. | 80112 | 7.0% | 5.8%(+1.14)#141 | 6.2%(+0.706)#10,514 |
| 3. | 80113 | 5.8% | 5.8%(+0.041)#193 | 6.2%(-0.396)#14,417 |
| 4. | 80110 | 5.7% | 5.8%(-0.127)#208 | 6.2%(-0.564)#15,057 |
1
Common Questions
What are the Top 3 Zip Codes with the Highest Percentage of Population Employed in Health Diagnosing & Treating in Englewood, CO?
Top 3 Zip Codes with the Highest Percentage of Population Employed in Health Diagnosing & Treating in Englewood, CO are:
What zip code has the Highest Percentage of Population Employed in Health Diagnosing & Treating in Englewood, CO?
80111 has the Highest Percentage of Population Employed in Health Diagnosing & Treating in Englewood, CO with 8.7%.
What is the Percentage of Population Employed in Health Diagnosing & Treating in Englewood, CO?
Percentage of Population Employed in Health Diagnosing & Treating in Englewood is 4.8%.
What is the Percentage of Population Employed in Health Diagnosing & Treating in Colorado?
Percentage of Population Employed in Health Diagnosing & Treating in Colorado is 5.8%.
What is the Percentage of Population Employed in Health Diagnosing & Treating in the United States?
Percentage of Population Employed in Health Diagnosing & Treating in the United States is 6.2%.