Starkville, CO Map & Demographics
Starkville Map
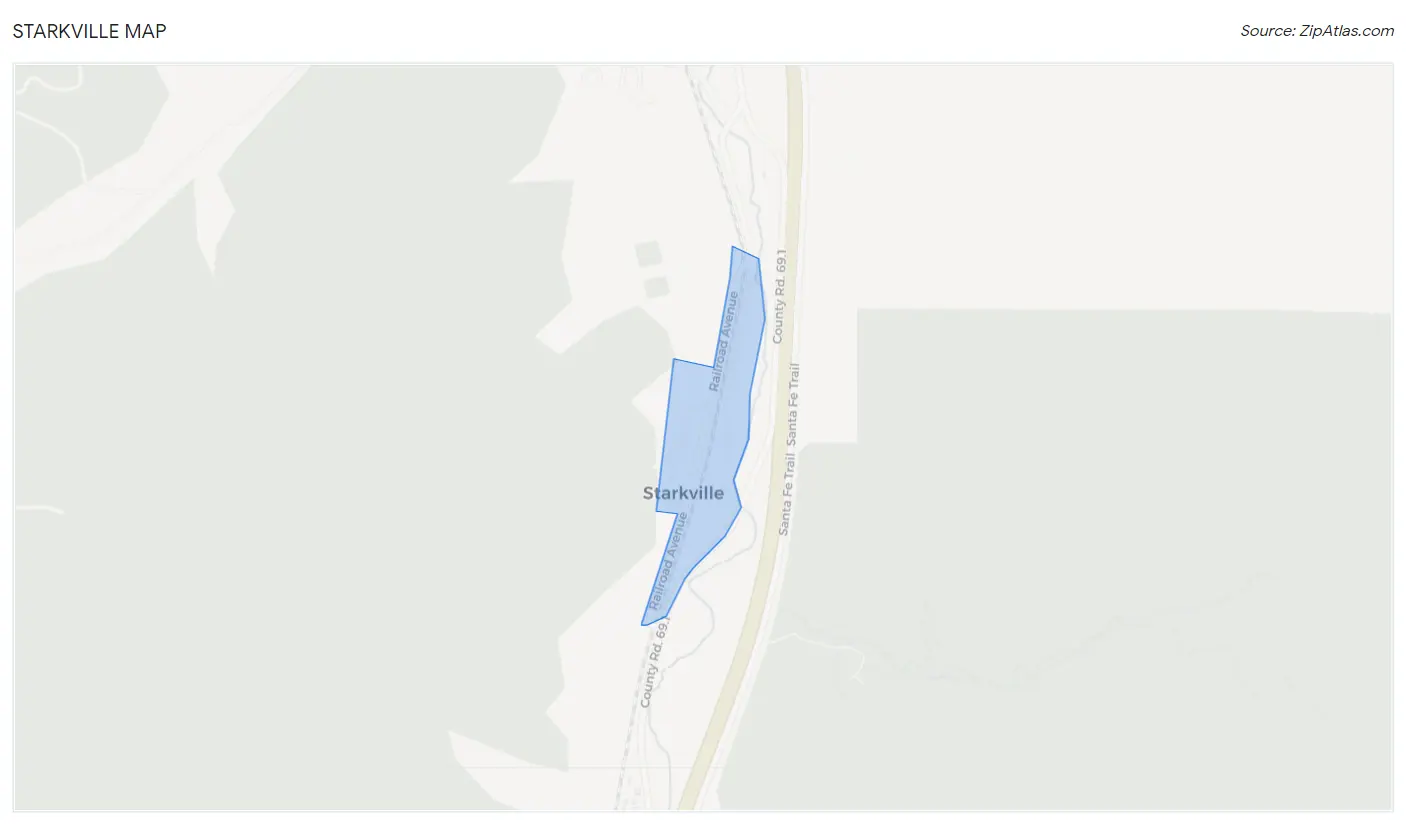
Starkville Overview
$28,849
PER CAPITA INCOME
$70,850
AVG FAMILY INCOME
$70,600
AVG HOUSEHOLD INCOME
0.22
INEQUALITY / GINI INDEX
182
TOTAL POPULATION
81
MALE POPULATION
101
FEMALE POPULATION
80.20
MALES / 100 FEMALES
124.69
FEMALES / 100 MALES
67.3
MEDIAN AGE
2.1
AVG FAMILY SIZE
2.0
AVG HOUSEHOLD SIZE
36
LABOR FORCE [ PEOPLE ]
20.8%
PERCENT IN LABOR FORCE
Starkville Area Codes
Income in Starkville
Income Overview in Starkville
Per Capita Income in Starkville is $28,849, while median incomes of families and households are $70,850 and $70,600 respectively.
| Characteristic | Number | Measure |
| Per Capita Income | 182 | $28,849 |
| Median Family Income | 82 | $70,850 |
| Mean Family Income | 82 | $62,774 |
| Median Household Income | 92 | $70,600 |
| Mean Household Income | 92 | $57,549 |
| Income Deficit | 82 | $0 |
| Wage / Income Gap (%) | 182 | 0.00% |
| Wage / Income Gap ($) | 182 | 100.00¢ per $1 |
| Gini / Inequality Index | 182 | 0.22 |
Earnings by Sex in Starkville
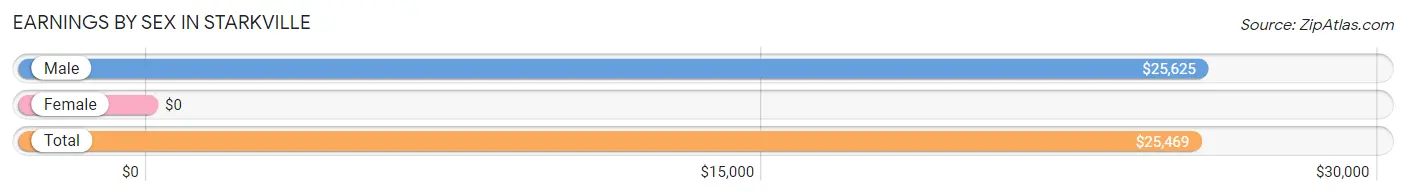
| Sex | Number | Average Earnings |
| Male | 16 (34.0%) | $25,625 |
| Female | 31 (66.0%) | $0 |
| Total | 47 (100.0%) | $25,469 |
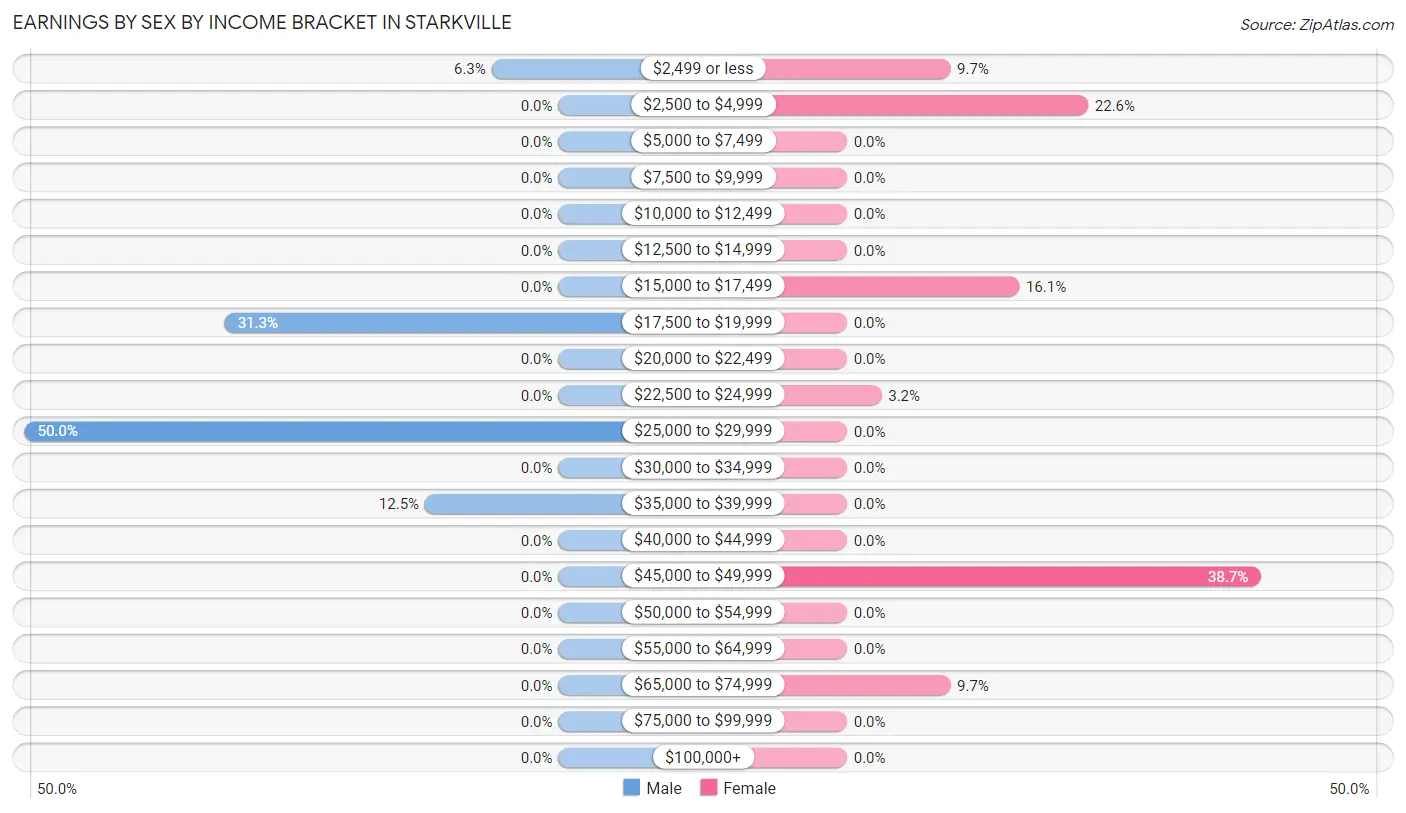
Earnings by Sex by Income Bracket in Starkville
The most common earnings brackets in Starkville are $25,000 to $29,999 for men (8 | 50.0%) and $45,000 to $49,999 for women (12 | 38.7%).
| Income | Male | Female |
| $2,499 or less | 1 (6.2%) | 3 (9.7%) |
| $2,500 to $4,999 | 0 (0.0%) | 7 (22.6%) |
| $5,000 to $7,499 | 0 (0.0%) | 0 (0.0%) |
| $7,500 to $9,999 | 0 (0.0%) | 0 (0.0%) |
| $10,000 to $12,499 | 0 (0.0%) | 0 (0.0%) |
| $12,500 to $14,999 | 0 (0.0%) | 0 (0.0%) |
| $15,000 to $17,499 | 0 (0.0%) | 5 (16.1%) |
| $17,500 to $19,999 | 5 (31.2%) | 0 (0.0%) |
| $20,000 to $22,499 | 0 (0.0%) | 0 (0.0%) |
| $22,500 to $24,999 | 0 (0.0%) | 1 (3.2%) |
| $25,000 to $29,999 | 8 (50.0%) | 0 (0.0%) |
| $30,000 to $34,999 | 0 (0.0%) | 0 (0.0%) |
| $35,000 to $39,999 | 2 (12.5%) | 0 (0.0%) |
| $40,000 to $44,999 | 0 (0.0%) | 0 (0.0%) |
| $45,000 to $49,999 | 0 (0.0%) | 12 (38.7%) |
| $50,000 to $54,999 | 0 (0.0%) | 0 (0.0%) |
| $55,000 to $64,999 | 0 (0.0%) | 0 (0.0%) |
| $65,000 to $74,999 | 0 (0.0%) | 3 (9.7%) |
| $75,000 to $99,999 | 0 (0.0%) | 0 (0.0%) |
| $100,000+ | 0 (0.0%) | 0 (0.0%) |
| Total | 16 (100.0%) | 31 (100.0%) |
Earnings by Sex by Educational Attainment in Starkville
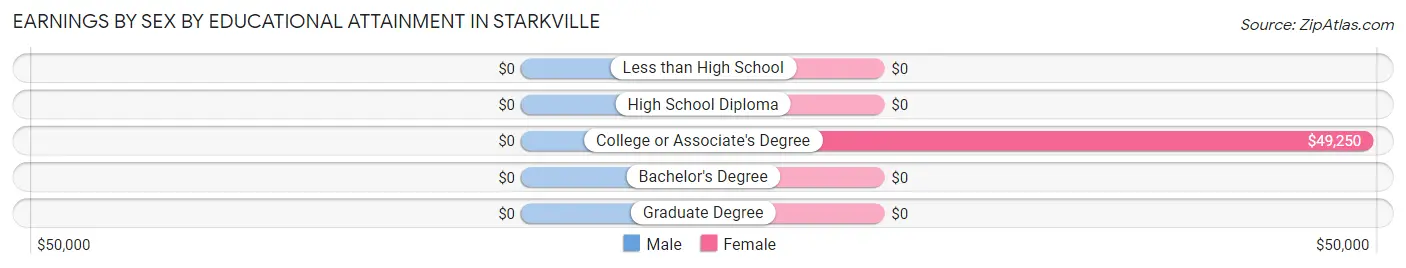
| Educational Attainment | Male Income | Female Income |
| Less than High School | - | - |
| High School Diploma | - | - |
| College or Associate's Degree | - | - |
| Bachelor's Degree | - | - |
| Graduate Degree | - | - |
| Total | $25,625 | $0 |
Family Income in Starkville
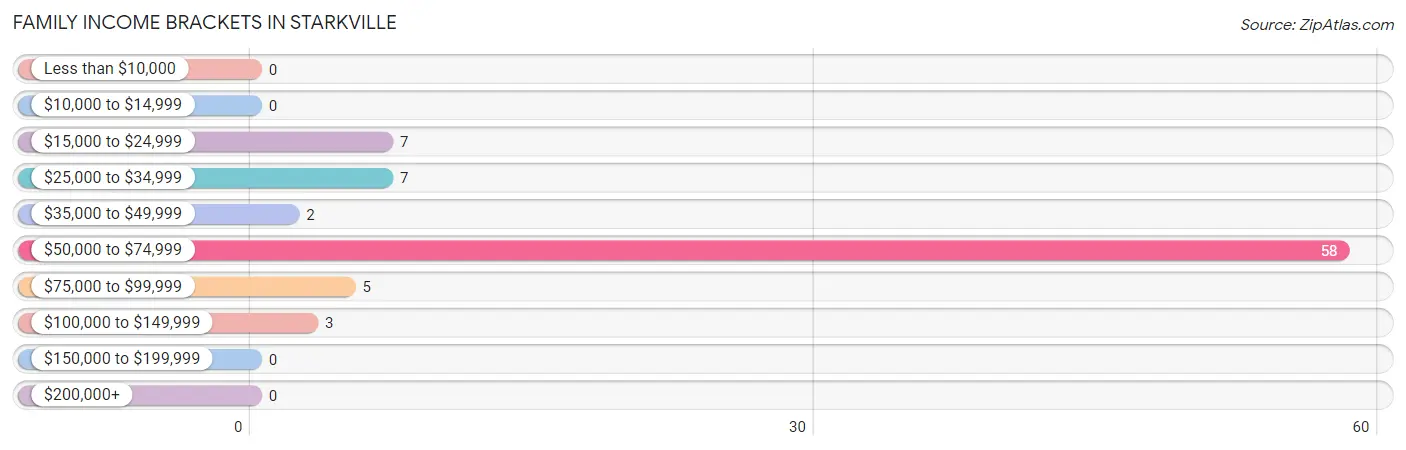
Family Income Brackets in Starkville
According to the Starkville family income data, there are 58 families falling into the $50,000 to $74,999 income range, which is the most common income bracket and makes up 70.7% of all families.
| Income Bracket | # Families | % Families |
| Less than $10,000 | 0 | 0.0% |
| $10,000 to $14,999 | 0 | 0.0% |
| $15,000 to $24,999 | 7 | 8.5% |
| $25,000 to $34,999 | 7 | 8.5% |
| $35,000 to $49,999 | 2 | 2.4% |
| $50,000 to $74,999 | 58 | 70.7% |
| $75,000 to $99,999 | 5 | 6.1% |
| $100,000 to $149,999 | 3 | 3.7% |
| $150,000 to $199,999 | 0 | 0.0% |
| $200,000+ | 0 | 0.0% |
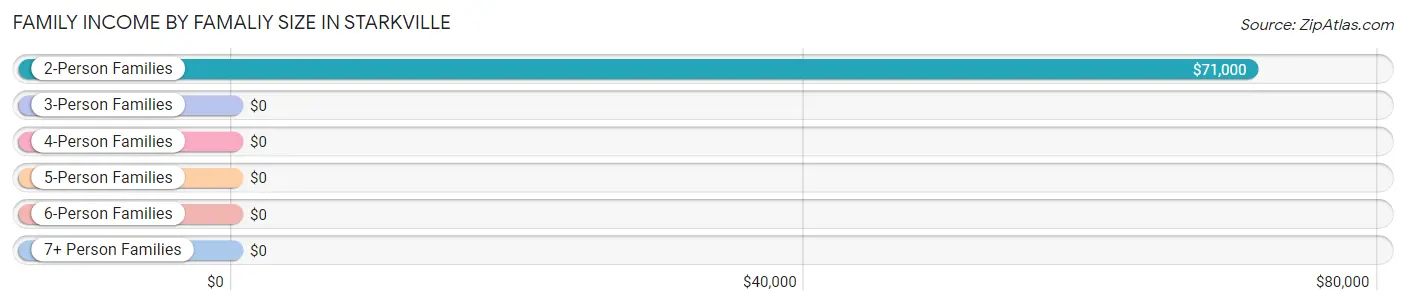
Family Income by Famaliy Size in Starkville
2-person families (76 | 92.7%) account for the highest median family income in Starkville with $71,000 per family, while 2-person families (76 | 92.7%) have the highest median income of $35,500 per family member.
| Income Bracket | # Families | Median Income |
| 2-Person Families | 76 (92.7%) | $71,000 |
| 3-Person Families | 5 (6.1%) | $0 |
| 4-Person Families | 1 (1.2%) | $0 |
| 5-Person Families | 0 (0.0%) | $0 |
| 6-Person Families | 0 (0.0%) | $0 |
| 7+ Person Families | 0 (0.0%) | $0 |
| Total | 82 (100.0%) | $70,850 |
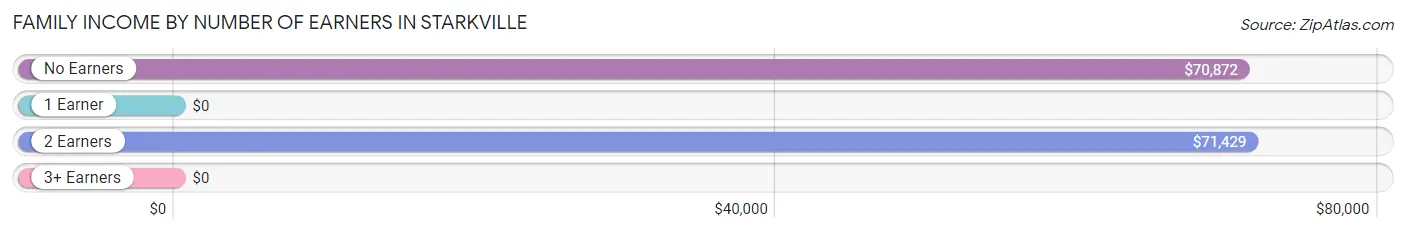
Family Income by Number of Earners in Starkville
| Number of Earners | # Families | Median Income |
| No Earners | 56 (68.3%) | $70,872 |
| 1 Earner | 4 (4.9%) | $0 |
| 2 Earners | 22 (26.8%) | $71,429 |
| 3+ Earners | 0 (0.0%) | $0 |
| Total | 82 (100.0%) | $70,850 |
Household Income in Starkville
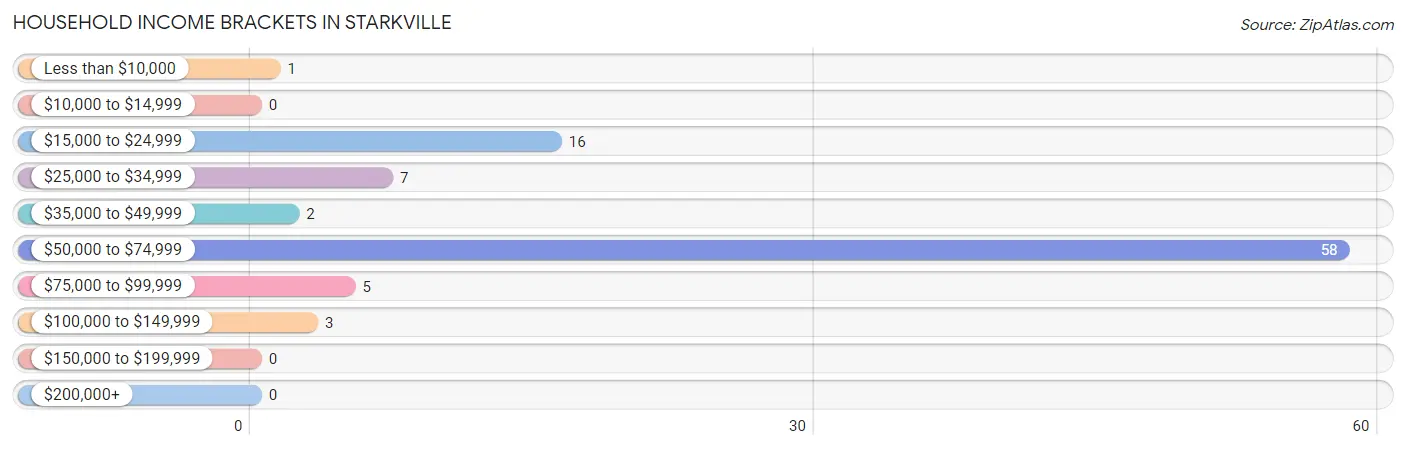
Household Income Brackets in Starkville
With 58 households falling in the category, the $50,000 to $74,999 income range is the most frequent in Starkville, accounting for 63.0% of all households.
| Income Bracket | # Households | % Households |
| Less than $10,000 | 1 | 1.1% |
| $10,000 to $14,999 | 0 | 0.0% |
| $15,000 to $24,999 | 16 | 17.4% |
| $25,000 to $34,999 | 7 | 7.6% |
| $35,000 to $49,999 | 2 | 2.2% |
| $50,000 to $74,999 | 58 | 63.0% |
| $75,000 to $99,999 | 5 | 5.4% |
| $100,000 to $149,999 | 3 | 3.3% |
| $150,000 to $199,999 | 0 | 0.0% |
| $200,000+ | 0 | 0.0% |
Household Income by Householder Age in Starkville
The median household income in Starkville is $70,600, with the highest median household income of $70,875 found in the 65+ years age bracket for the primary householder. A total of 65 households (70.7%) fall into this category.
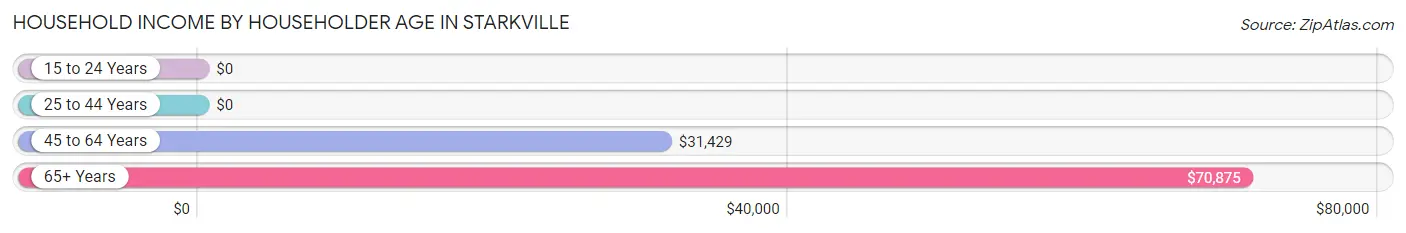
| Income Bracket | # Households | Median Income |
| 15 to 24 Years | 0 (0.0%) | $0 |
| 25 to 44 Years | 1 (1.1%) | $0 |
| 45 to 64 Years | 26 (28.3%) | $31,429 |
| 65+ Years | 65 (70.7%) | $70,875 |
| Total | 92 (100.0%) | $70,600 |
Poverty in Starkville
Income Below Poverty by Sex and Age in Starkville
With 7.4% poverty level for males and 6.9% for females among the residents of Starkville, 16 and 17 year old males and 12 to 14 year old females are the most vulnerable to poverty, with 5 males (100.0%) and 4 females (50.0%) in their respective age groups living below the poverty level.
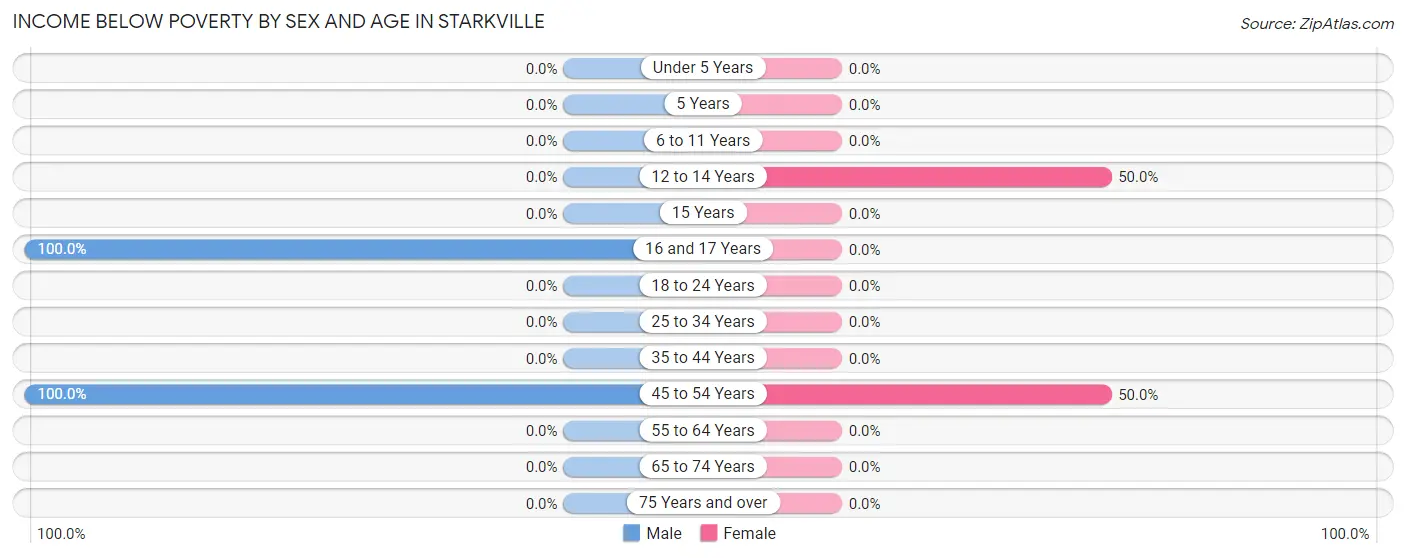
| Age Bracket | Male | Female |
| Under 5 Years | 0 (0.0%) | 0 (0.0%) |
| 5 Years | 0 (0.0%) | 0 (0.0%) |
| 6 to 11 Years | 0 (0.0%) | 0 (0.0%) |
| 12 to 14 Years | 0 (0.0%) | 4 (50.0%) |
| 15 Years | 0 (0.0%) | 0 (0.0%) |
| 16 and 17 Years | 5 (100.0%) | 0 (0.0%) |
| 18 to 24 Years | 0 (0.0%) | 0 (0.0%) |
| 25 to 34 Years | 0 (0.0%) | 0 (0.0%) |
| 35 to 44 Years | 0 (0.0%) | 0 (0.0%) |
| 45 to 54 Years | 1 (100.0%) | 3 (50.0%) |
| 55 to 64 Years | 0 (0.0%) | 0 (0.0%) |
| 65 to 74 Years | 0 (0.0%) | 0 (0.0%) |
| 75 Years and over | 0 (0.0%) | 0 (0.0%) |
| Total | 6 (7.4%) | 7 (6.9%) |
Income Above Poverty by Sex and Age in Starkville
According to the poverty statistics in Starkville, males aged 6 to 11 years and females aged 16 and 17 years are the age groups that are most secure financially, with 100.0% of males and 100.0% of females in these age groups living above the poverty line.
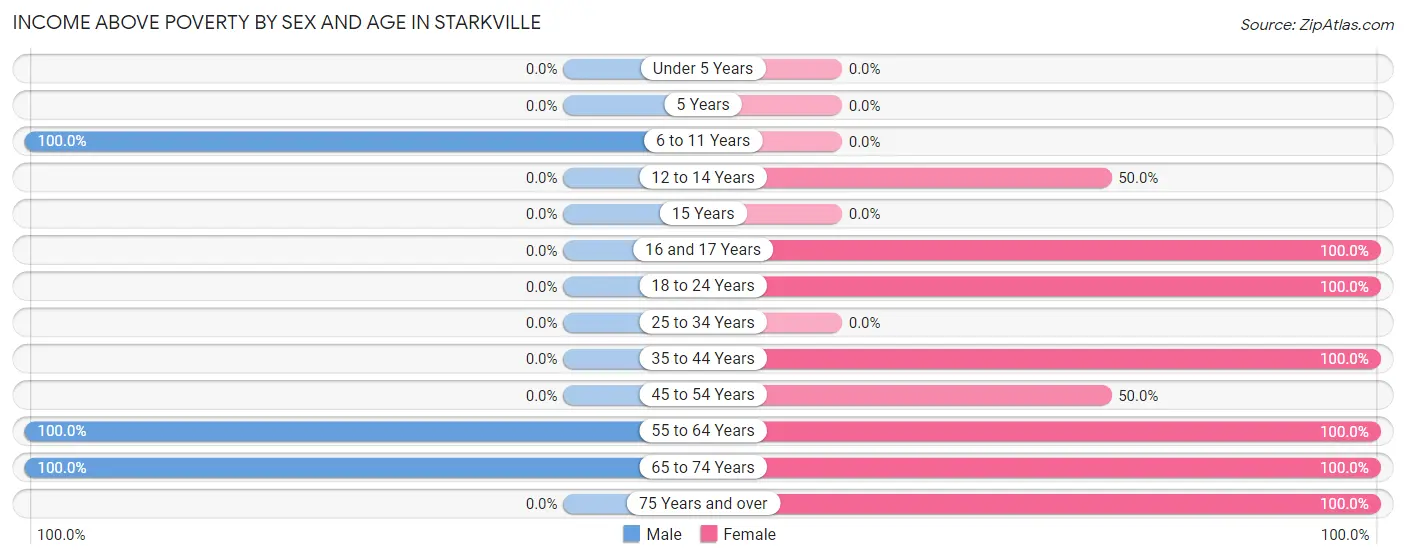
| Age Bracket | Male | Female |
| Under 5 Years | 0 (0.0%) | 0 (0.0%) |
| 5 Years | 0 (0.0%) | 0 (0.0%) |
| 6 to 11 Years | 1 (100.0%) | 0 (0.0%) |
| 12 to 14 Years | 0 (0.0%) | 4 (50.0%) |
| 15 Years | 0 (0.0%) | 0 (0.0%) |
| 16 and 17 Years | 0 (0.0%) | 2 (100.0%) |
| 18 to 24 Years | 0 (0.0%) | 5 (100.0%) |
| 25 to 34 Years | 0 (0.0%) | 0 (0.0%) |
| 35 to 44 Years | 0 (0.0%) | 1 (100.0%) |
| 45 to 54 Years | 0 (0.0%) | 3 (50.0%) |
| 55 to 64 Years | 20 (100.0%) | 14 (100.0%) |
| 65 to 74 Years | 54 (100.0%) | 57 (100.0%) |
| 75 Years and over | 0 (0.0%) | 8 (100.0%) |
| Total | 75 (92.6%) | 94 (93.1%) |
Income Below Poverty Among Married-Couple Families in Starkville
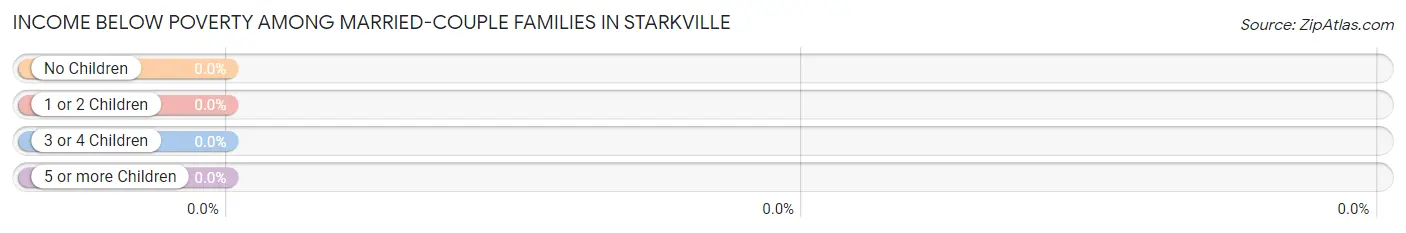
| Children | Above Poverty | Below Poverty |
| No Children | 65 (100.0%) | 0 (0.0%) |
| 1 or 2 Children | 2 (100.0%) | 0 (0.0%) |
| 3 or 4 Children | 0 (0.0%) | 0 (0.0%) |
| 5 or more Children | 0 (0.0%) | 0 (0.0%) |
| Total | 67 (100.0%) | 0 (0.0%) |
Income Below Poverty Among Single-Parent Households in Starkville
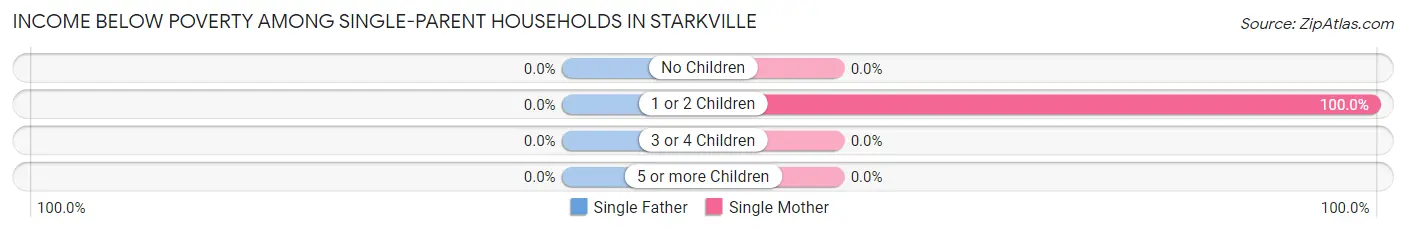
| Children | Single Father | Single Mother |
| No Children | 0 (0.0%) | 0 (0.0%) |
| 1 or 2 Children | 0 (0.0%) | 3 (100.0%) |
| 3 or 4 Children | 0 (0.0%) | 0 (0.0%) |
| 5 or more Children | 0 (0.0%) | 0 (0.0%) |
| Total | 0 (0.0%) | 3 (20.0%) |
Income Below Poverty Among Married-Couple vs Single-Parent Households in Starkville
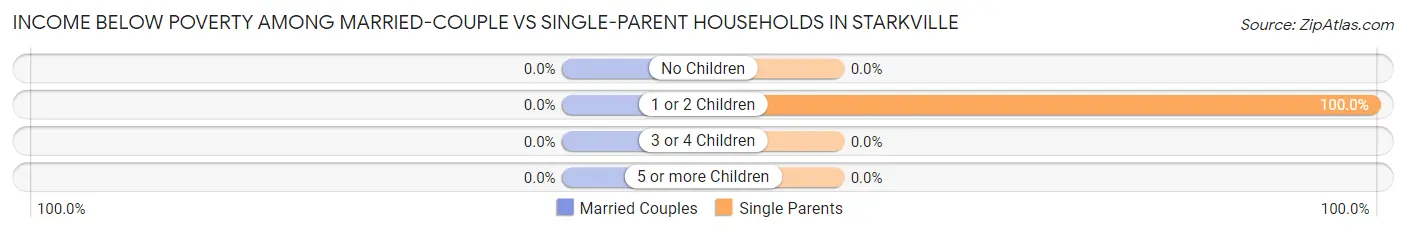
| Children | Married-Couple Families | Single-Parent Households |
| No Children | 0 (0.0%) | 0 (0.0%) |
| 1 or 2 Children | 0 (0.0%) | 3 (100.0%) |
| 3 or 4 Children | 0 (0.0%) | 0 (0.0%) |
| 5 or more Children | 0 (0.0%) | 0 (0.0%) |
| Total | 0 (0.0%) | 3 (20.0%) |
Race in Starkville
The most populous races in Starkville are White / Caucasian (133 | 73.1%), Hispanic or Latino (71 | 39.0%), and Native / Alaskan (32 | 17.6%).
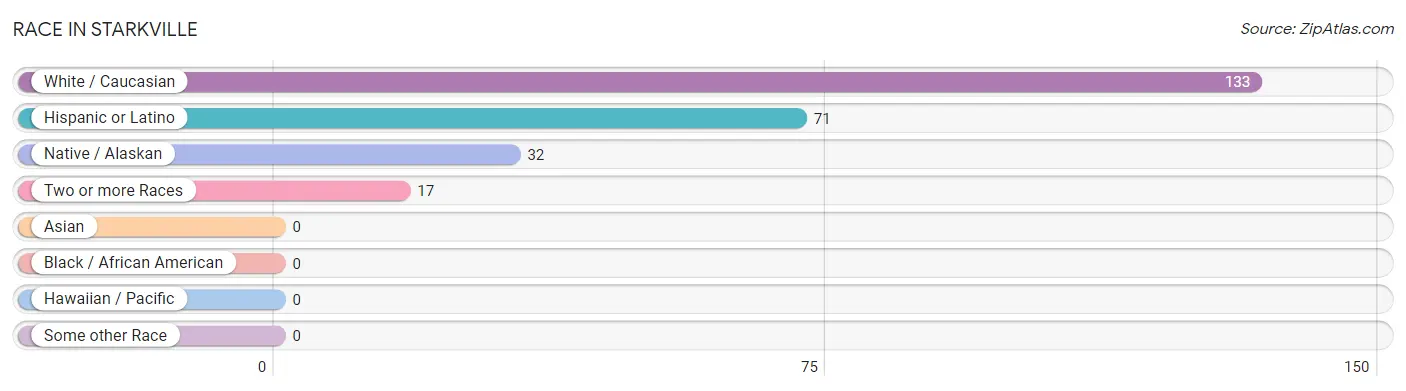
| Race | # Population | % Population |
| Asian | 0 | 0.0% |
| Black / African American | 0 | 0.0% |
| Hawaiian / Pacific | 0 | 0.0% |
| Hispanic or Latino | 71 | 39.0% |
| Native / Alaskan | 32 | 17.6% |
| White / Caucasian | 133 | 73.1% |
| Two or more Races | 17 | 9.3% |
| Some other Race | 0 | 0.0% |
| Total | 182 | 100.0% |
Ancestry in Starkville
The most populous ancestries reported in Starkville are Mexican (46 | 25.3%), Polish (45 | 24.7%), Norwegian (43 | 23.6%), Spanish (15 | 8.2%), and Apache (8 | 4.4%), together accounting for 86.3% of all Starkville residents.
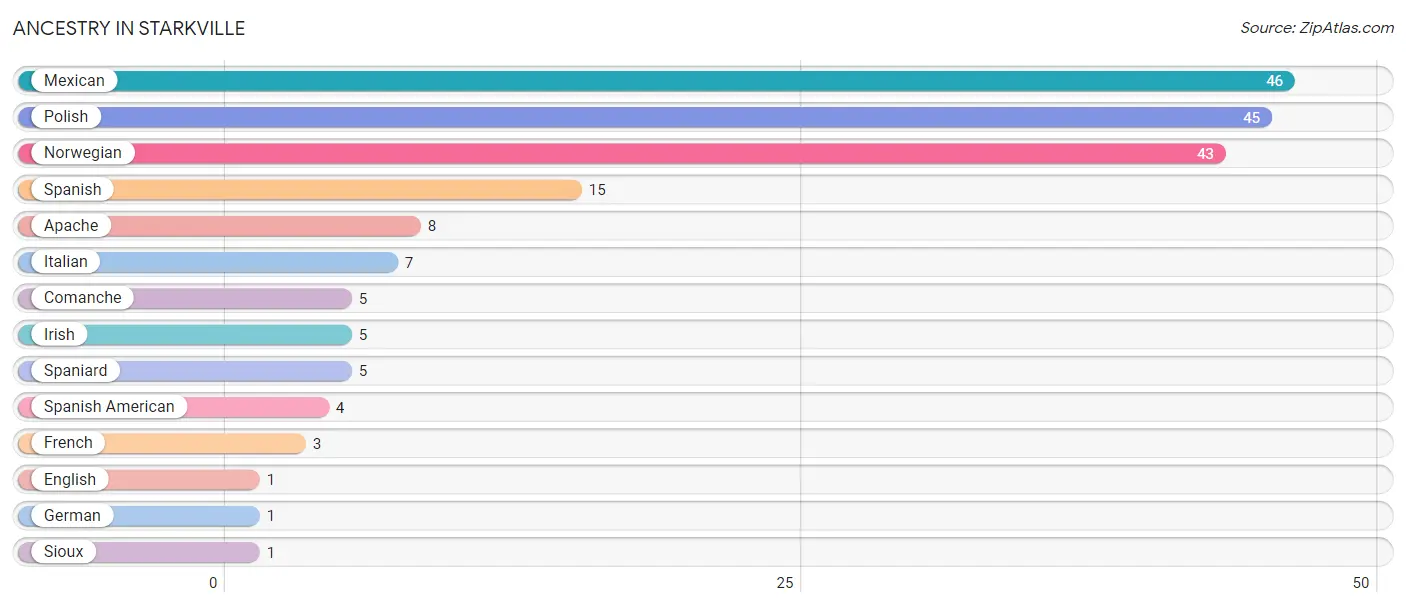
| Ancestry | # Population | % Population |
| Apache | 8 | 4.4% |
| Comanche | 5 | 2.8% |
| English | 1 | 0.5% |
| French | 3 | 1.7% |
| German | 1 | 0.5% |
| Irish | 5 | 2.8% |
| Italian | 7 | 3.8% |
| Mexican | 46 | 25.3% |
| Norwegian | 43 | 23.6% |
| Polish | 45 | 24.7% |
| Sioux | 1 | 0.5% |
| Spaniard | 5 | 2.8% |
| Spanish | 15 | 8.2% |
| Spanish American | 4 | 2.2% | View All 14 Rows |
Immigrants in Starkville

| Immigration Origin | # Population | % Population | View All 0 Rows |
Sex and Age in Starkville
Sex and Age in Starkville
The most populous age groups in Starkville are 65 to 69 Years (54 | 66.7%) for men and 65 to 69 Years (57 | 56.4%) for women.
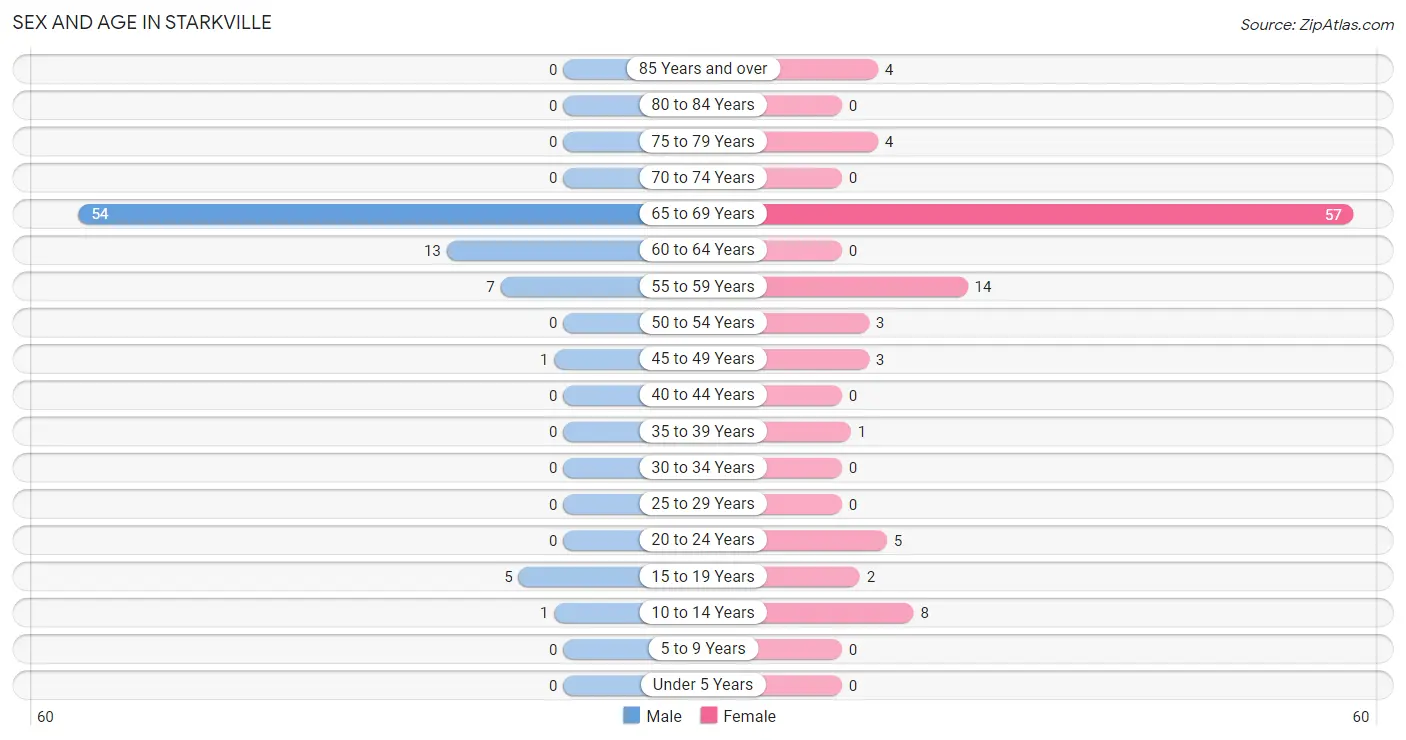
| Age Bracket | Male | Female |
| Under 5 Years | 0 (0.0%) | 0 (0.0%) |
| 5 to 9 Years | 0 (0.0%) | 0 (0.0%) |
| 10 to 14 Years | 1 (1.2%) | 8 (7.9%) |
| 15 to 19 Years | 5 (6.2%) | 2 (2.0%) |
| 20 to 24 Years | 0 (0.0%) | 5 (5.0%) |
| 25 to 29 Years | 0 (0.0%) | 0 (0.0%) |
| 30 to 34 Years | 0 (0.0%) | 0 (0.0%) |
| 35 to 39 Years | 0 (0.0%) | 1 (1.0%) |
| 40 to 44 Years | 0 (0.0%) | 0 (0.0%) |
| 45 to 49 Years | 1 (1.2%) | 3 (3.0%) |
| 50 to 54 Years | 0 (0.0%) | 3 (3.0%) |
| 55 to 59 Years | 7 (8.6%) | 14 (13.9%) |
| 60 to 64 Years | 13 (16.1%) | 0 (0.0%) |
| 65 to 69 Years | 54 (66.7%) | 57 (56.4%) |
| 70 to 74 Years | 0 (0.0%) | 0 (0.0%) |
| 75 to 79 Years | 0 (0.0%) | 4 (4.0%) |
| 80 to 84 Years | 0 (0.0%) | 0 (0.0%) |
| 85 Years and over | 0 (0.0%) | 4 (4.0%) |
| Total | 81 (100.0%) | 101 (100.0%) |
Families and Households in Starkville
Median Family Size in Starkville
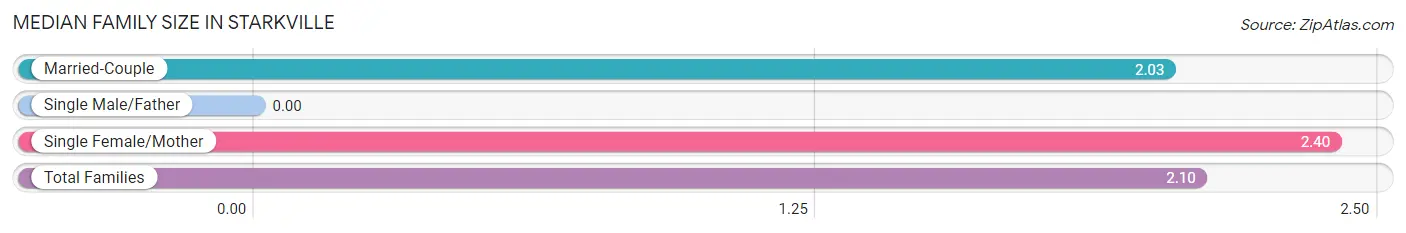
| Family Type | # Families | Family Size |
| Married-Couple | 67 (81.7%) | 2.03 |
| Single Male/Father | 0 (0.0%) | - |
| Single Female/Mother | 15 (18.3%) | 2.40 |
| Total Families | 82 (100.0%) | 2.10 |
Median Household Size in Starkville
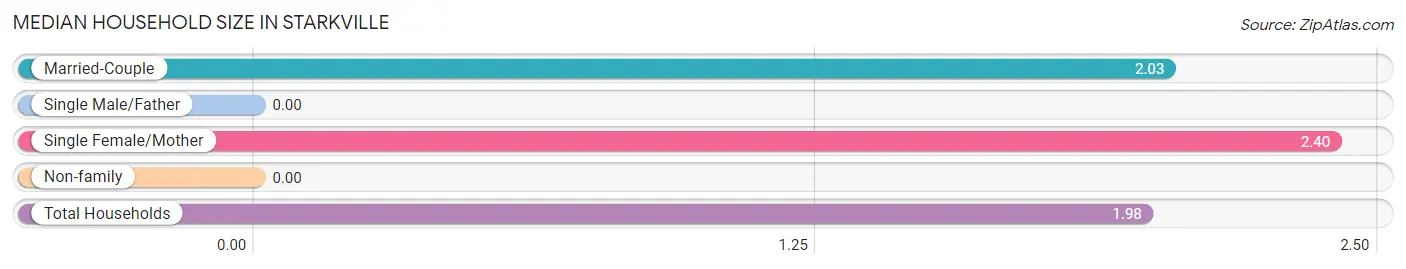
| Household Type | # Households | Household Size |
| Married-Couple | 67 (72.8%) | 2.03 |
| Single Male/Father | 0 (0.0%) | - |
| Single Female/Mother | 15 (16.3%) | 2.40 |
| Non-family | 10 (10.9%) | - |
| Total Households | 92 (100.0%) | 1.98 |
Household Size by Marriage Status in Starkville
Out of a total of 92 households in Starkville, 82 (89.1%) are family households, while 10 (10.9%) are nonfamily households. The most numerous type of family households are 2-person households, comprising 76, and the most common type of nonfamily households are 1-person households, comprising 10.
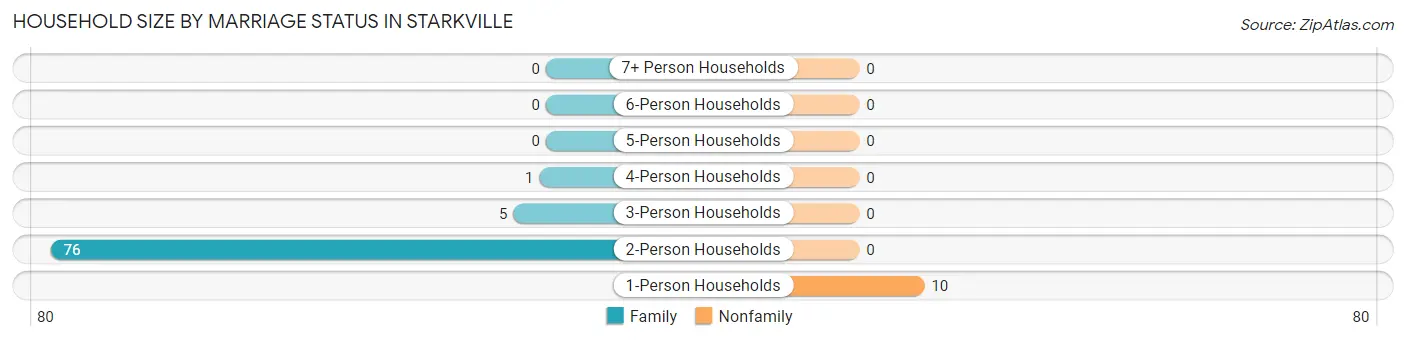
| Household Size | Family Households | Nonfamily Households |
| 1-Person Households | - | 10 (10.9%) |
| 2-Person Households | 76 (82.6%) | 0 (0.0%) |
| 3-Person Households | 5 (5.4%) | 0 (0.0%) |
| 4-Person Households | 1 (1.1%) | 0 (0.0%) |
| 5-Person Households | 0 (0.0%) | 0 (0.0%) |
| 6-Person Households | 0 (0.0%) | 0 (0.0%) |
| 7+ Person Households | 0 (0.0%) | 0 (0.0%) |
| Total | 82 (89.1%) | 10 (10.9%) |
Female Fertility in Starkville
Fertility by Age in Starkville
| Age Bracket | Women with Births | Births / 1,000 Women |
| 15 to 19 years | 0 (0.0%) | 0.0 |
| 20 to 34 years | 0 (0.0%) | 0.0 |
| 35 to 50 years | 0 (0.0%) | 0.0 |
| Total | 0 (0.0%) | 0.0 |
Fertility by Age by Marriage Status in Starkville
| Age Bracket | Married | Unmarried |
| 15 to 19 years | 0 (0.0%) | 0 (0.0%) |
| 20 to 34 years | 0 (0.0%) | 0 (0.0%) |
| 35 to 50 years | 0 (0.0%) | 0 (0.0%) |
| Total | 0 (0.0%) | 0 (0.0%) |
Fertility by Education in Starkville
| Educational Attainment | Women with Births | Births / 1,000 Women |
| Less than High School | 0 (0.0%) | 0.0 |
| High School Diploma | 0 (0.0%) | 0.0 |
| College or Associate's Degree | 0 (0.0%) | 0.0 |
| Bachelor's Degree | 0 (0.0%) | 0.0 |
| Graduate Degree | 0 (0.0%) | 0.0 |
| Total | 0 (0.0%) | 0.0 |
Fertility by Education by Marriage Status in Starkville
| Educational Attainment | Married | Unmarried |
| Less than High School | 0 (0.0%) | 0 (0.0%) |
| High School Diploma | 0 (0.0%) | 0 (0.0%) |
| College or Associate's Degree | 0 (0.0%) | 0 (0.0%) |
| Bachelor's Degree | 0 (0.0%) | 0 (0.0%) |
| Graduate Degree | 0 (0.0%) | 0 (0.0%) |
| Total | 0 (0.0%) | 0 (0.0%) |
Employment Characteristics in Starkville
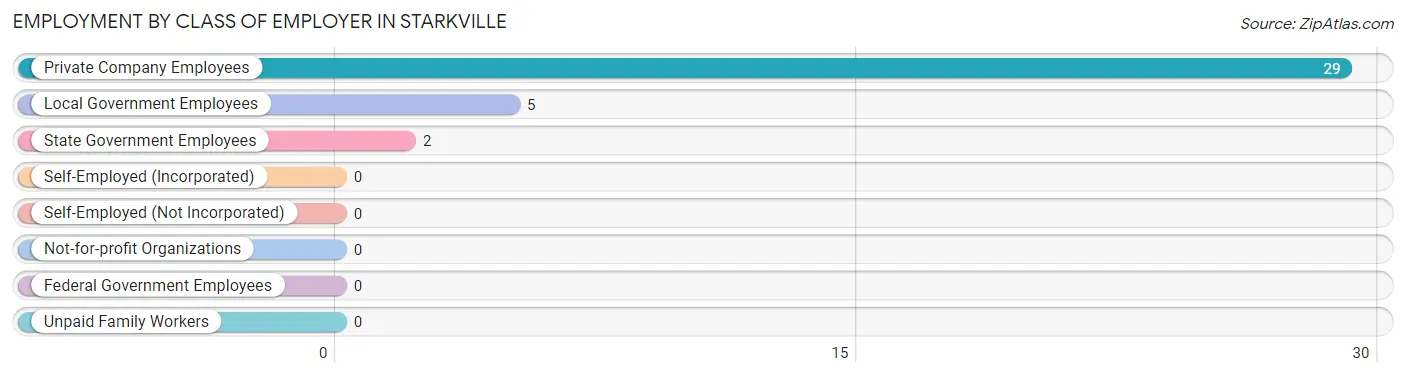
Employment by Class of Employer in Starkville
Among the 36 employed individuals in Starkville, private company employees (29 | 80.6%), local government employees (5 | 13.9%), and state government employees (2 | 5.6%) make up the most common classes of employment.
| Employer Class | # Employees | % Employees |
| Private Company Employees | 29 | 80.6% |
| Self-Employed (Incorporated) | 0 | 0.0% |
| Self-Employed (Not Incorporated) | 0 | 0.0% |
| Not-for-profit Organizations | 0 | 0.0% |
| Local Government Employees | 5 | 13.9% |
| State Government Employees | 2 | 5.6% |
| Federal Government Employees | 0 | 0.0% |
| Unpaid Family Workers | 0 | 0.0% |
| Total | 36 | 100.0% |
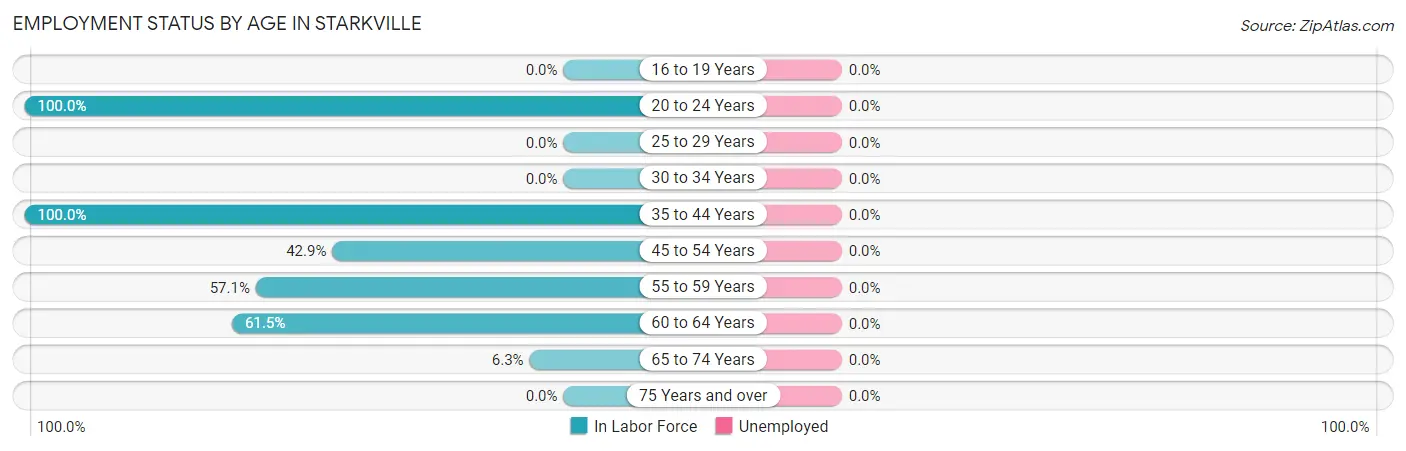
Employment Status by Age in Starkville
| Age Bracket | In Labor Force | Unemployed |
| 16 to 19 Years | 0 (0.0%) | 0 (0.0%) |
| 20 to 24 Years | 5 (100.0%) | 0 (0.0%) |
| 25 to 29 Years | 0 (0.0%) | 0 (0.0%) |
| 30 to 34 Years | 0 (0.0%) | 0 (0.0%) |
| 35 to 44 Years | 1 (100.0%) | 0 (0.0%) |
| 45 to 54 Years | 3 (42.9%) | 0 (0.0%) |
| 55 to 59 Years | 12 (57.1%) | 0 (0.0%) |
| 60 to 64 Years | 8 (61.5%) | 0 (0.0%) |
| 65 to 74 Years | 7 (6.3%) | 0 (0.0%) |
| 75 Years and over | 0 (0.0%) | 0 (0.0%) |
| Total | 36 (20.8%) | 0 (0.0%) |
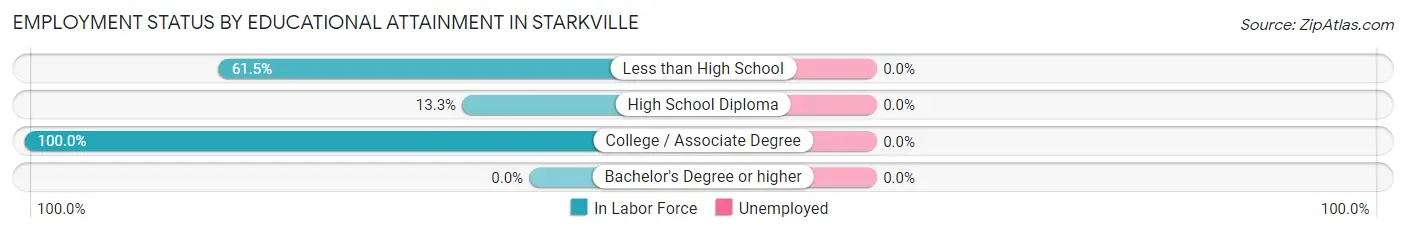
Employment Status by Educational Attainment in Starkville
| Educational Attainment | In Labor Force | Unemployed |
| Less than High School | 8 (61.5%) | 0 (0.0%) |
| High School Diploma | 2 (13.3%) | 0 (0.0%) |
| College / Associate Degree | 14 (100.0%) | 0 (0.0%) |
| Bachelor's Degree or higher | 0 (0.0%) | 0 (0.0%) |
| Total | 24 (57.1%) | 0 (0.0%) |
Employment Occupations by Sex in Starkville
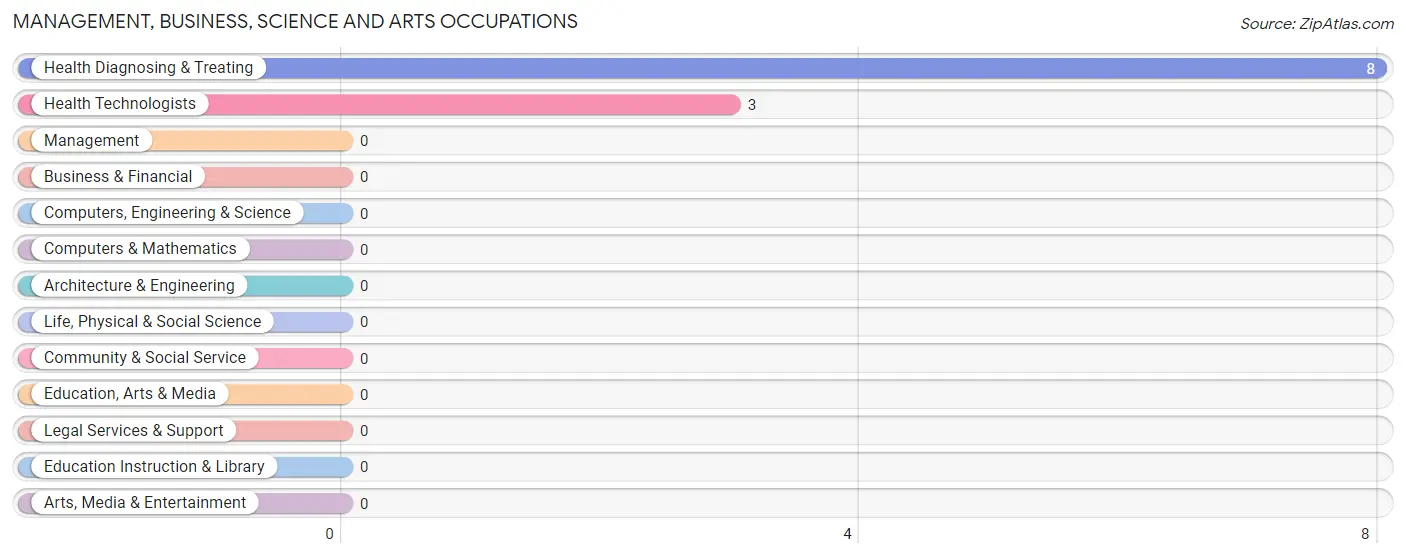
Management, Business, Science and Arts Occupations
The most common Management, Business, Science and Arts occupations in Starkville are Health Diagnosing & Treating (8 | 22.2%), and Health Technologists (3 | 8.3%).
Management, Business, Science and Arts Occupations by Sex
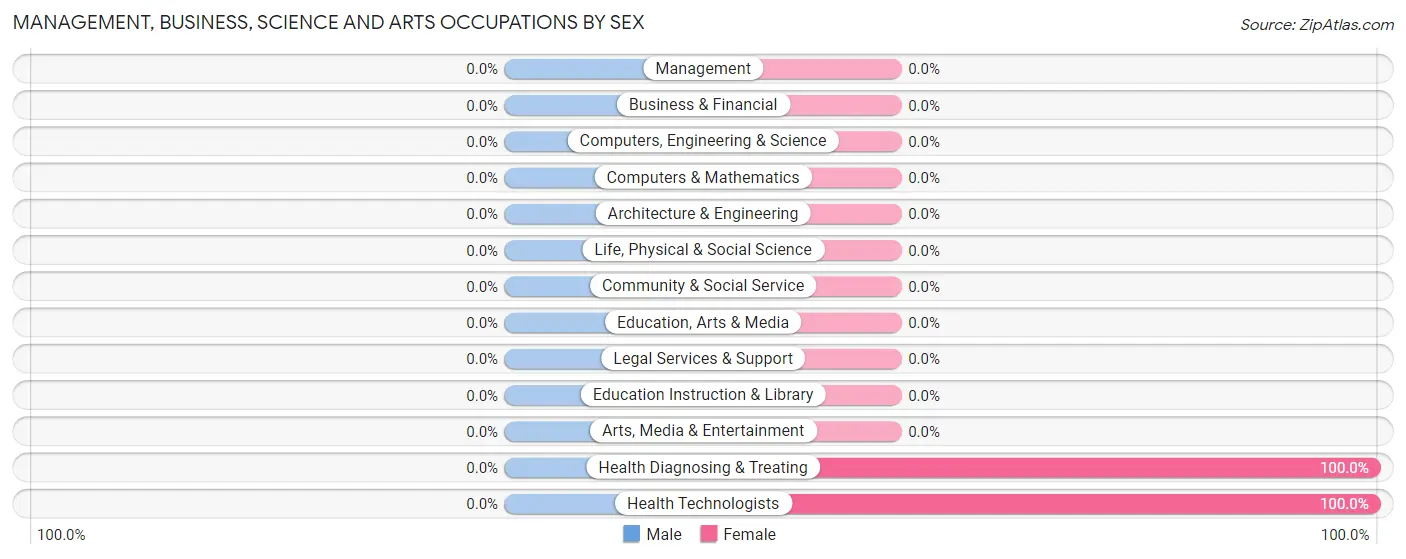
| Occupation | Male | Female |
| Management | 0 (0.0%) | 0 (0.0%) |
| Business & Financial | 0 (0.0%) | 0 (0.0%) |
| Computers, Engineering & Science | 0 (0.0%) | 0 (0.0%) |
| Computers & Mathematics | 0 (0.0%) | 0 (0.0%) |
| Architecture & Engineering | 0 (0.0%) | 0 (0.0%) |
| Life, Physical & Social Science | 0 (0.0%) | 0 (0.0%) |
| Community & Social Service | 0 (0.0%) | 0 (0.0%) |
| Education, Arts & Media | 0 (0.0%) | 0 (0.0%) |
| Legal Services & Support | 0 (0.0%) | 0 (0.0%) |
| Education Instruction & Library | 0 (0.0%) | 0 (0.0%) |
| Arts, Media & Entertainment | 0 (0.0%) | 0 (0.0%) |
| Health Diagnosing & Treating | 0 (0.0%) | 8 (100.0%) |
| Health Technologists | 0 (0.0%) | 3 (100.0%) |
| Total (Category) | 0 (0.0%) | 8 (100.0%) |
| Total (Overall) | 15 (41.7%) | 21 (58.3%) |
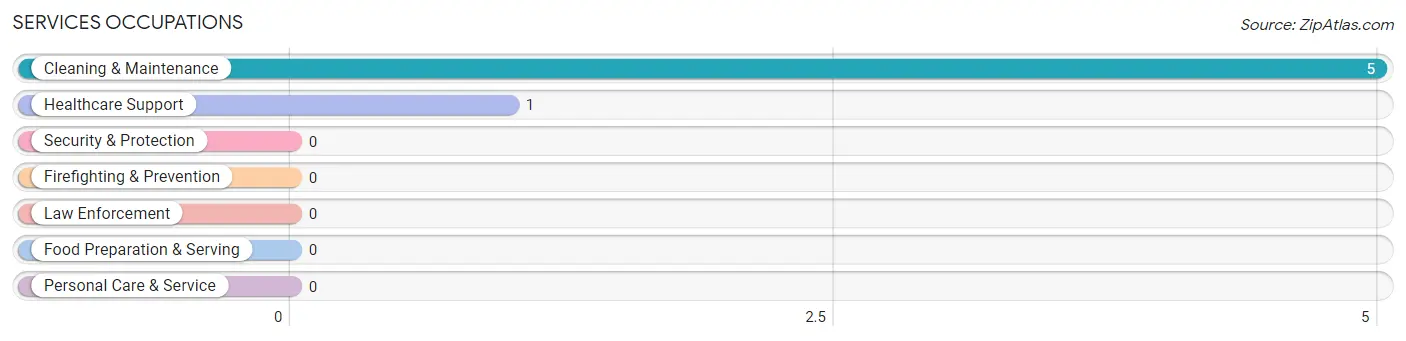
Services Occupations
The most common Services occupations in Starkville are Cleaning & Maintenance (5 | 13.9%), and Healthcare Support (1 | 2.8%).
Services Occupations by Sex
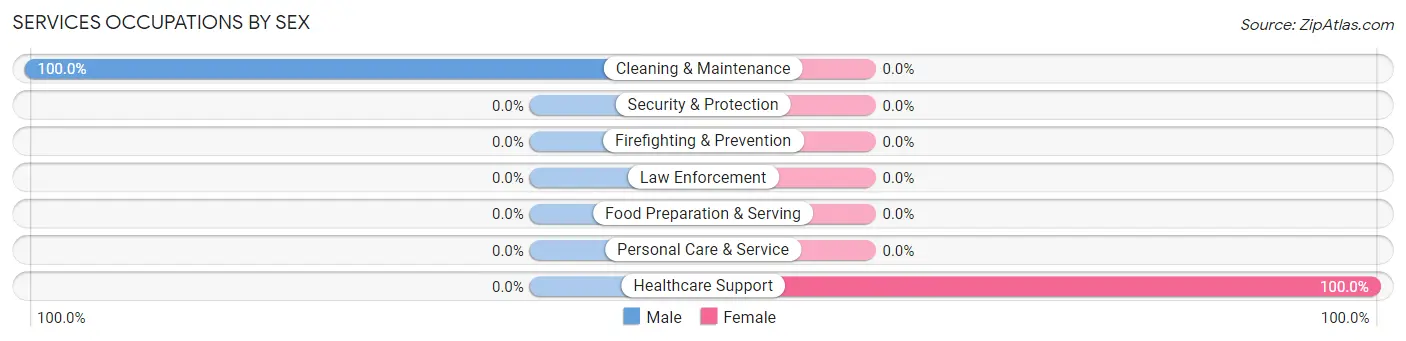
| Occupation | Male | Female |
| Healthcare Support | 0 (0.0%) | 1 (100.0%) |
| Security & Protection | 0 (0.0%) | 0 (0.0%) |
| Firefighting & Prevention | 0 (0.0%) | 0 (0.0%) |
| Law Enforcement | 0 (0.0%) | 0 (0.0%) |
| Food Preparation & Serving | 0 (0.0%) | 0 (0.0%) |
| Cleaning & Maintenance | 5 (100.0%) | 0 (0.0%) |
| Personal Care & Service | 0 (0.0%) | 0 (0.0%) |
| Total (Category) | 5 (83.3%) | 1 (16.7%) |
| Total (Overall) | 15 (41.7%) | 21 (58.3%) |
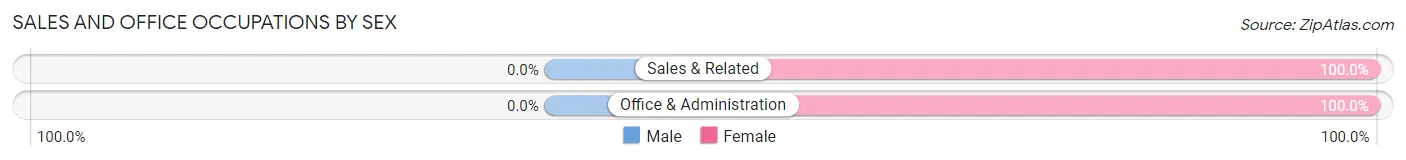
Sales and Office Occupations
The most common Sales and Office occupations in Starkville are Office & Administration (7 | 19.4%), and Sales & Related (5 | 13.9%).
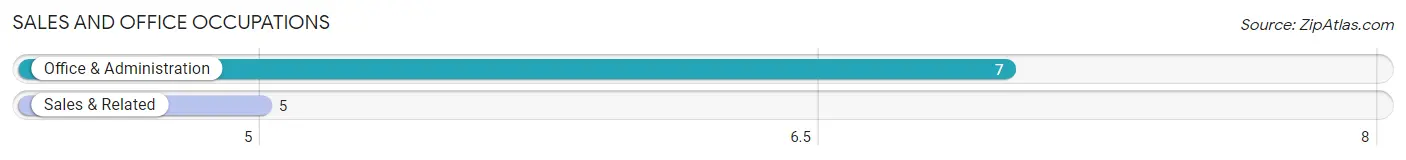
Sales and Office Occupations by Sex
| Occupation | Male | Female |
| Sales & Related | 0 (0.0%) | 5 (100.0%) |
| Office & Administration | 0 (0.0%) | 7 (100.0%) |
| Total (Category) | 0 (0.0%) | 12 (100.0%) |
| Total (Overall) | 15 (41.7%) | 21 (58.3%) |
Natural Resources, Construction and Maintenance Occupations
The most common Natural Resources, Construction and Maintenance occupations in Starkville are , and Construction & Extraction (2 | 5.6%).
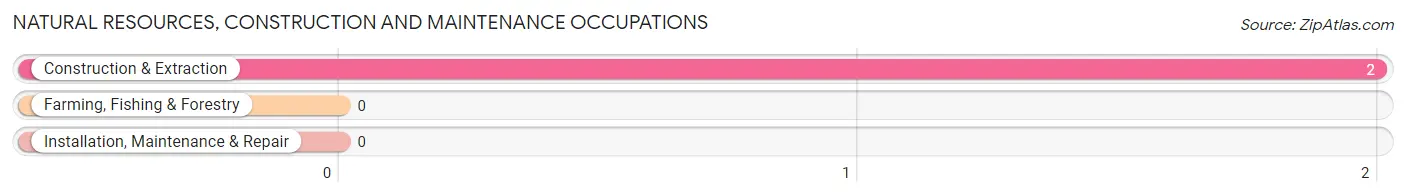
Natural Resources, Construction and Maintenance Occupations by Sex
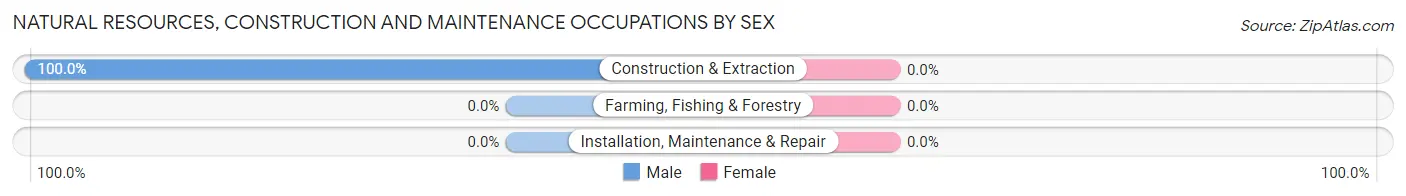
| Occupation | Male | Female |
| Farming, Fishing & Forestry | 0 (0.0%) | 0 (0.0%) |
| Construction & Extraction | 2 (100.0%) | 0 (0.0%) |
| Installation, Maintenance & Repair | 0 (0.0%) | 0 (0.0%) |
| Total (Category) | 2 (100.0%) | 0 (0.0%) |
| Total (Overall) | 15 (41.7%) | 21 (58.3%) |
Production, Transportation and Moving Occupations
The most common Production, Transportation and Moving occupations in Starkville are , and Transportation (8 | 22.2%).
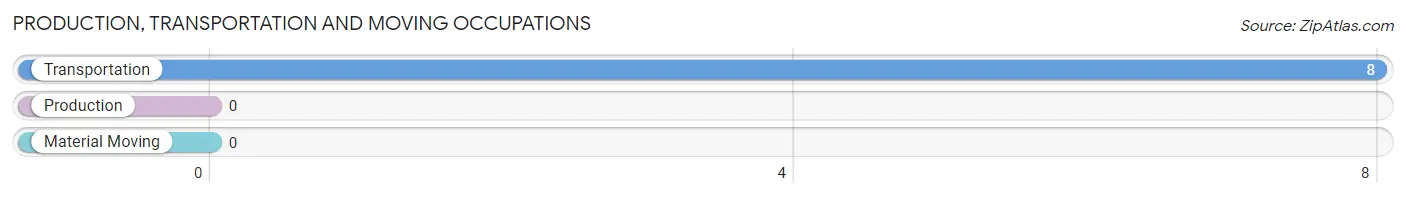
Production, Transportation and Moving Occupations by Sex
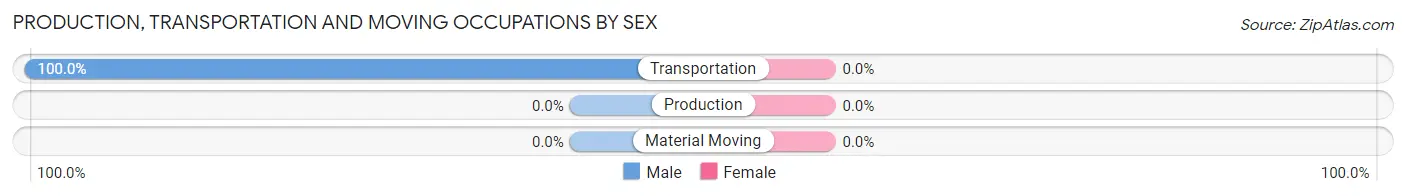
| Occupation | Male | Female |
| Production | 0 (0.0%) | 0 (0.0%) |
| Transportation | 8 (100.0%) | 0 (0.0%) |
| Material Moving | 0 (0.0%) | 0 (0.0%) |
| Total (Category) | 8 (100.0%) | 0 (0.0%) |
| Total (Overall) | 15 (41.7%) | 21 (58.3%) |
Employment Industries by Sex in Starkville
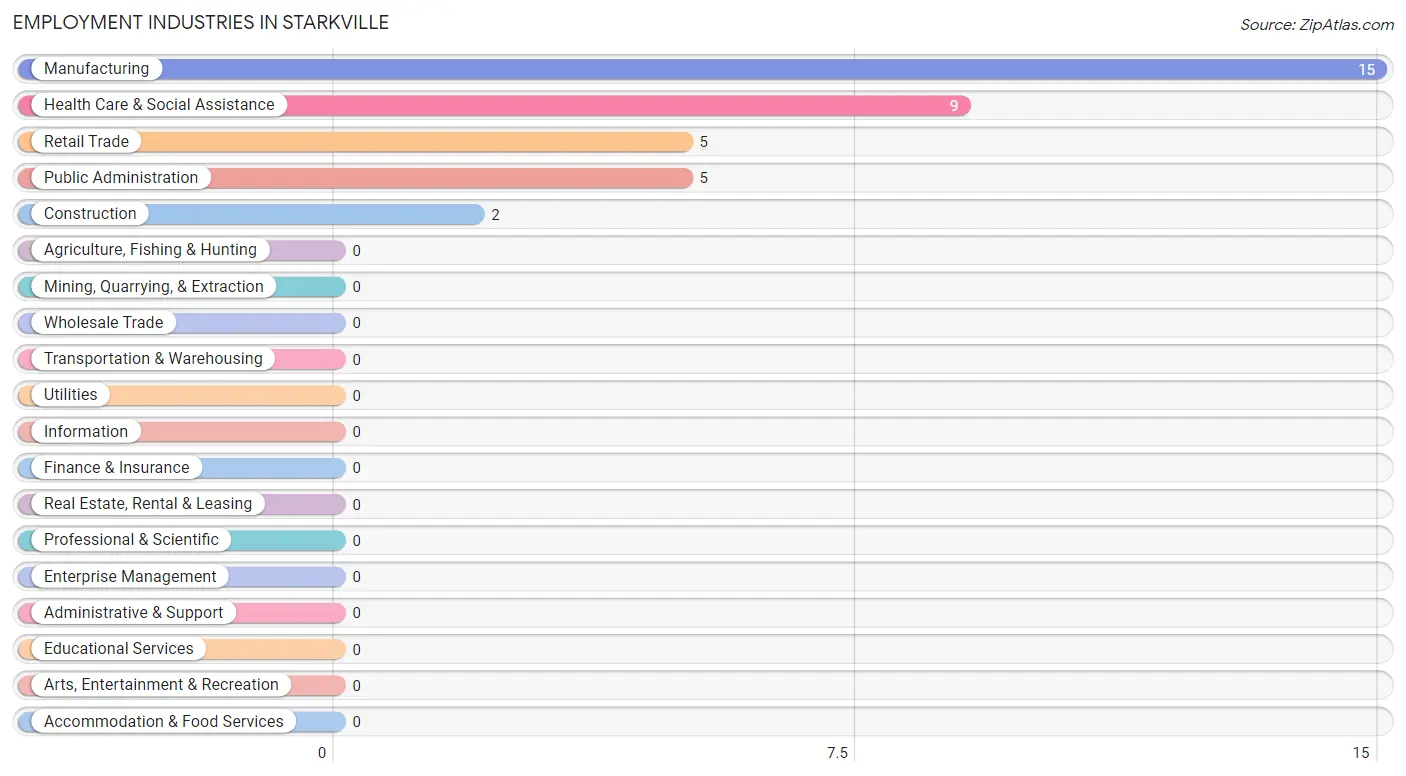
Employment Industries in Starkville
The major employment industries in Starkville include Manufacturing (15 | 41.7%), Health Care & Social Assistance (9 | 25.0%), Retail Trade (5 | 13.9%), Public Administration (5 | 13.9%), and Construction (2 | 5.6%).
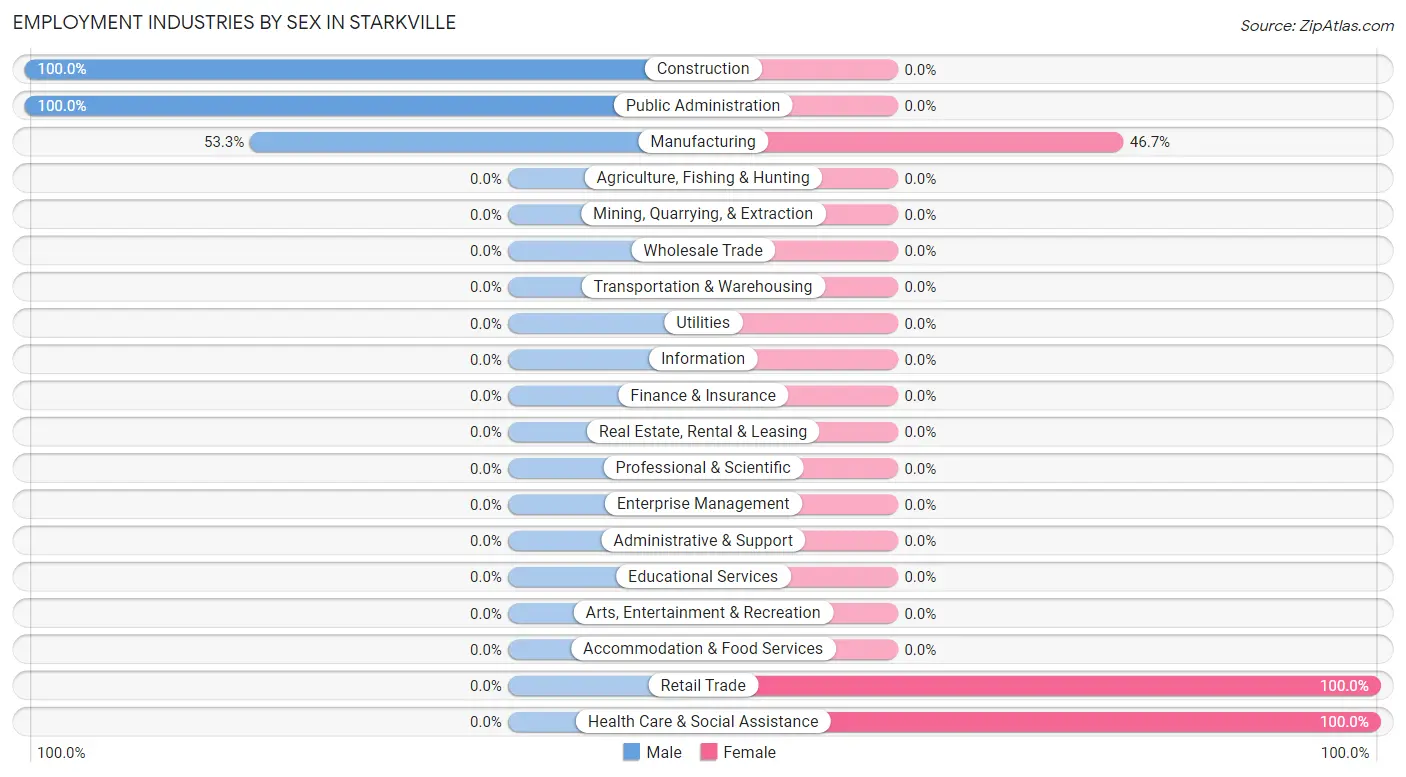
Employment Industries by Sex in Starkville
The Starkville industries that see more men than women are Construction (100.0%), Public Administration (100.0%), and Manufacturing (53.3%), whereas the industries that tend to have a higher number of women are Retail Trade (100.0%), Health Care & Social Assistance (100.0%), and Manufacturing (46.7%).
| Industry | Male | Female |
| Agriculture, Fishing & Hunting | 0 (0.0%) | 0 (0.0%) |
| Mining, Quarrying, & Extraction | 0 (0.0%) | 0 (0.0%) |
| Construction | 2 (100.0%) | 0 (0.0%) |
| Manufacturing | 8 (53.3%) | 7 (46.7%) |
| Wholesale Trade | 0 (0.0%) | 0 (0.0%) |
| Retail Trade | 0 (0.0%) | 5 (100.0%) |
| Transportation & Warehousing | 0 (0.0%) | 0 (0.0%) |
| Utilities | 0 (0.0%) | 0 (0.0%) |
| Information | 0 (0.0%) | 0 (0.0%) |
| Finance & Insurance | 0 (0.0%) | 0 (0.0%) |
| Real Estate, Rental & Leasing | 0 (0.0%) | 0 (0.0%) |
| Professional & Scientific | 0 (0.0%) | 0 (0.0%) |
| Enterprise Management | 0 (0.0%) | 0 (0.0%) |
| Administrative & Support | 0 (0.0%) | 0 (0.0%) |
| Educational Services | 0 (0.0%) | 0 (0.0%) |
| Health Care & Social Assistance | 0 (0.0%) | 9 (100.0%) |
| Arts, Entertainment & Recreation | 0 (0.0%) | 0 (0.0%) |
| Accommodation & Food Services | 0 (0.0%) | 0 (0.0%) |
| Public Administration | 5 (100.0%) | 0 (0.0%) |
| Total | 15 (41.7%) | 21 (58.3%) |
Education in Starkville
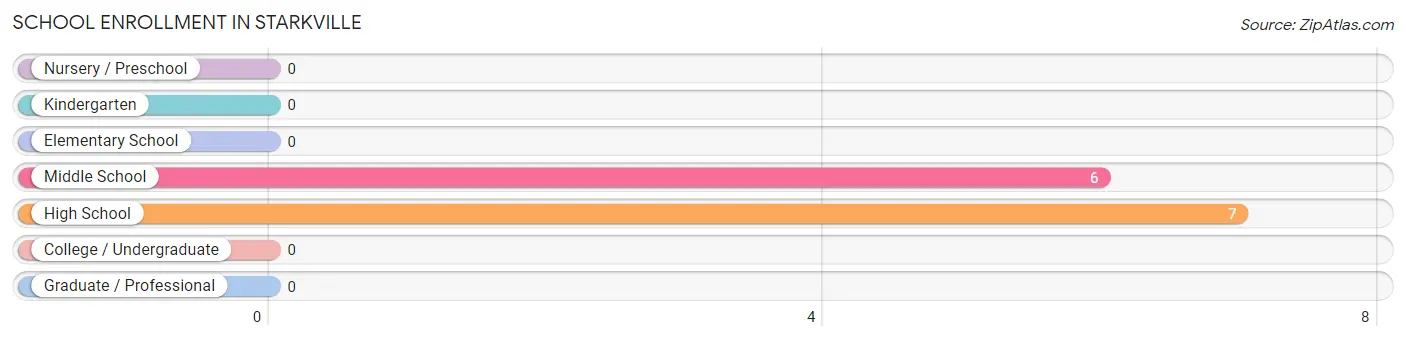
School Enrollment in Starkville
The most common levels of schooling among the 13 students in Starkville are high school (7 | 53.8%), and middle school (6 | 46.2%).
| School Level | # Students | % Students |
| Nursery / Preschool | 0 | 0.0% |
| Kindergarten | 0 | 0.0% |
| Elementary School | 0 | 0.0% |
| Middle School | 6 | 46.2% |
| High School | 7 | 53.8% |
| College / Undergraduate | 0 | 0.0% |
| Graduate / Professional | 0 | 0.0% |
| Total | 13 | 100.0% |
School Enrollment by Age by Funding Source in Starkville
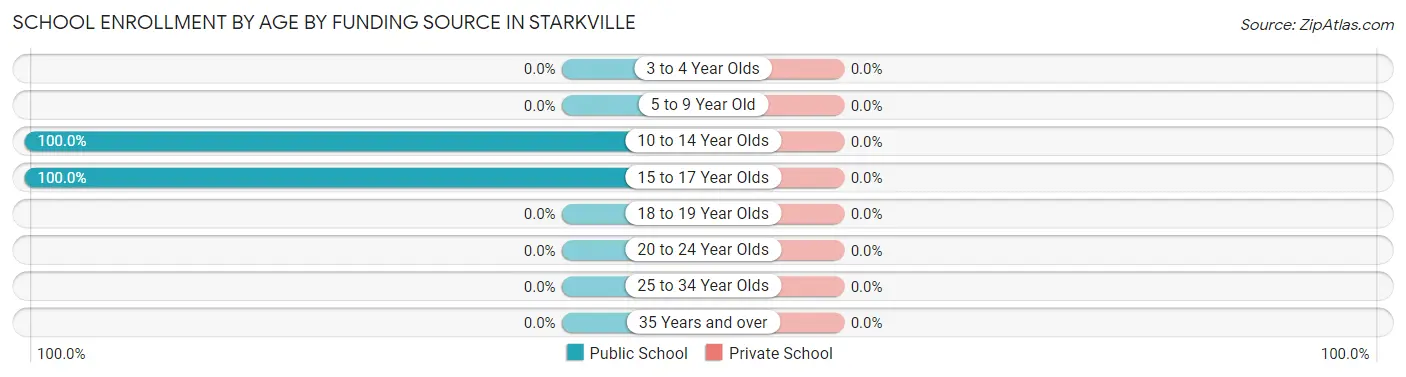
| Age Bracket | Public School | Private School |
| 3 to 4 Year Olds | 0 (0.0%) | 0 (0.0%) |
| 5 to 9 Year Old | 0 (0.0%) | 0 (0.0%) |
| 10 to 14 Year Olds | 6 (100.0%) | 0 (0.0%) |
| 15 to 17 Year Olds | 7 (100.0%) | 0 (0.0%) |
| 18 to 19 Year Olds | 0 (0.0%) | 0 (0.0%) |
| 20 to 24 Year Olds | 0 (0.0%) | 0 (0.0%) |
| 25 to 34 Year Olds | 0 (0.0%) | 0 (0.0%) |
| 35 Years and over | 0 (0.0%) | 0 (0.0%) |
| Total | 13 (100.0%) | 0 (0.0%) |
Educational Attainment by Field of Study in Starkville
Education (45 | 51.1%), and physical & health sciences (43 | 48.9%) are the most common fields of study among 88 individuals in Starkville who have obtained a bachelor's degree or higher.

| Field of Study | # Graduates | % Graduates |
| Computers & Mathematics | 0 | 0.0% |
| Bio, Nature & Agricultural | 0 | 0.0% |
| Physical & Health Sciences | 43 | 48.9% |
| Psychology | 0 | 0.0% |
| Social Sciences | 0 | 0.0% |
| Engineering | 0 | 0.0% |
| Multidisciplinary Studies | 0 | 0.0% |
| Science & Technology | 0 | 0.0% |
| Business | 0 | 0.0% |
| Education | 45 | 51.1% |
| Literature & Languages | 0 | 0.0% |
| Liberal Arts & History | 0 | 0.0% |
| Visual & Performing Arts | 0 | 0.0% |
| Communications | 0 | 0.0% |
| Arts & Humanities | 0 | 0.0% |
| Total | 88 | 100.0% |
Transportation & Commute in Starkville
Vehicle Availability by Sex in Starkville
The most prevalent vehicle ownership categories in Starkville are males with 3 vehicles (13, accounting for 86.7%) and females with 3 vehicles (5, making up 61.9%).
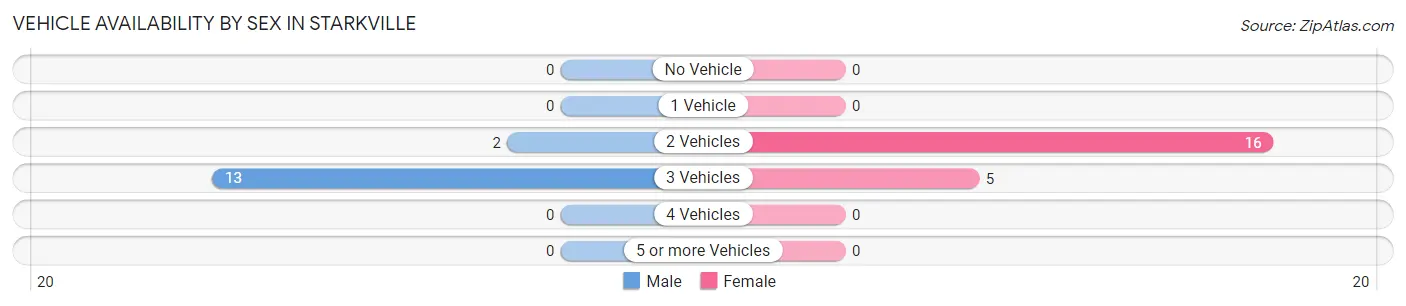
| Vehicles Available | Male | Female |
| No Vehicle | 0 (0.0%) | 0 (0.0%) |
| 1 Vehicle | 0 (0.0%) | 0 (0.0%) |
| 2 Vehicles | 2 (13.3%) | 16 (76.2%) |
| 3 Vehicles | 13 (86.7%) | 5 (23.8%) |
| 4 Vehicles | 0 (0.0%) | 0 (0.0%) |
| 5 or more Vehicles | 0 (0.0%) | 0 (0.0%) |
| Total | 15 (100.0%) | 21 (100.0%) |
Commute Time in Starkville
The most frequently occuring commute durations in Starkville are 10 to 14 minutes (21 commuters, 58.3%), 15 to 19 minutes (13 commuters, 36.1%), and 5 to 9 minutes (2 commuters, 5.6%).
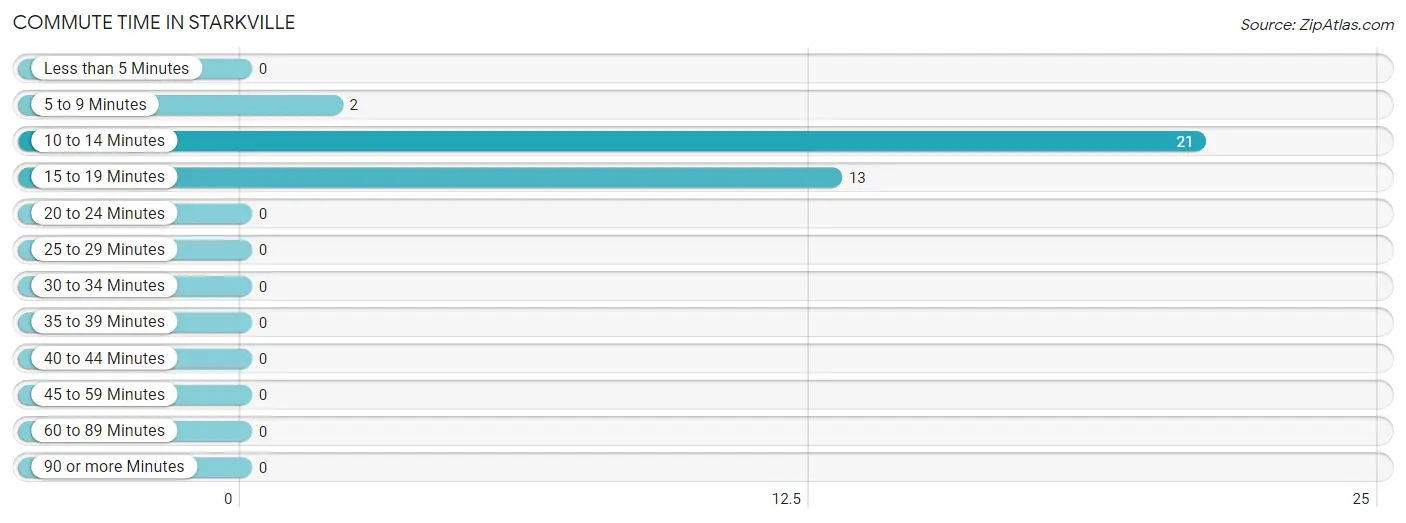
| Commute Time | # Commuters | % Commuters |
| Less than 5 Minutes | 0 | 0.0% |
| 5 to 9 Minutes | 2 | 5.6% |
| 10 to 14 Minutes | 21 | 58.3% |
| 15 to 19 Minutes | 13 | 36.1% |
| 20 to 24 Minutes | 0 | 0.0% |
| 25 to 29 Minutes | 0 | 0.0% |
| 30 to 34 Minutes | 0 | 0.0% |
| 35 to 39 Minutes | 0 | 0.0% |
| 40 to 44 Minutes | 0 | 0.0% |
| 45 to 59 Minutes | 0 | 0.0% |
| 60 to 89 Minutes | 0 | 0.0% |
| 90 or more Minutes | 0 | 0.0% |
Commute Time by Sex in Starkville
The most common commute times in Starkville are 15 to 19 minutes (8 commuters, 53.3%) for males and 10 to 14 minutes (16 commuters, 76.2%) for females.
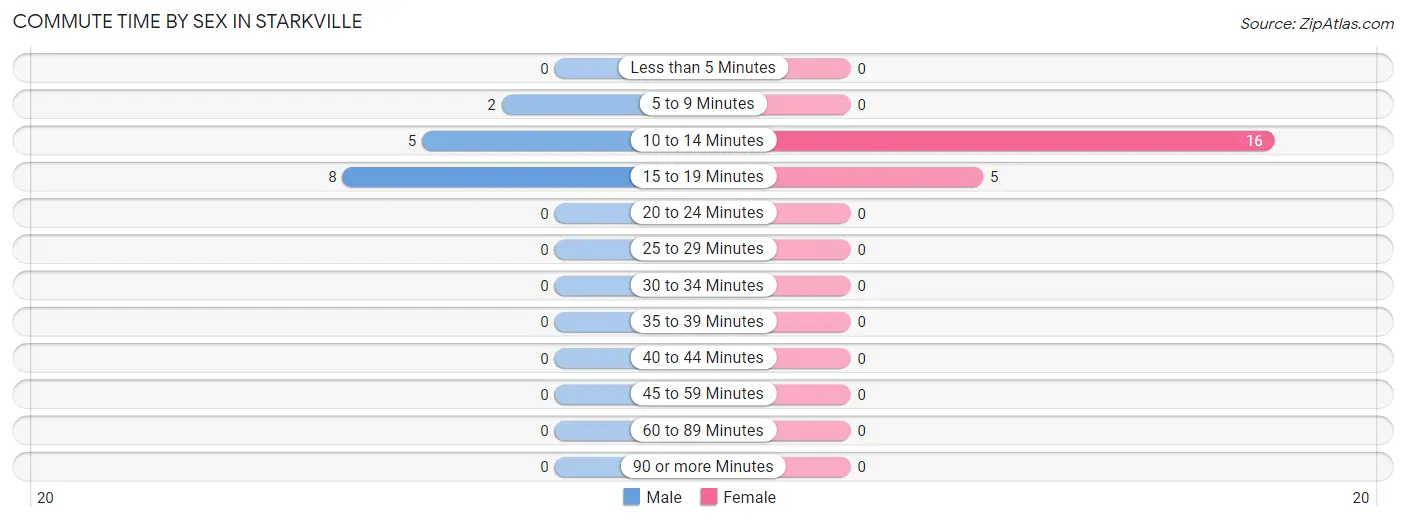
| Commute Time | Male | Female |
| Less than 5 Minutes | 0 (0.0%) | 0 (0.0%) |
| 5 to 9 Minutes | 2 (13.3%) | 0 (0.0%) |
| 10 to 14 Minutes | 5 (33.3%) | 16 (76.2%) |
| 15 to 19 Minutes | 8 (53.3%) | 5 (23.8%) |
| 20 to 24 Minutes | 0 (0.0%) | 0 (0.0%) |
| 25 to 29 Minutes | 0 (0.0%) | 0 (0.0%) |
| 30 to 34 Minutes | 0 (0.0%) | 0 (0.0%) |
| 35 to 39 Minutes | 0 (0.0%) | 0 (0.0%) |
| 40 to 44 Minutes | 0 (0.0%) | 0 (0.0%) |
| 45 to 59 Minutes | 0 (0.0%) | 0 (0.0%) |
| 60 to 89 Minutes | 0 (0.0%) | 0 (0.0%) |
| 90 or more Minutes | 0 (0.0%) | 0 (0.0%) |
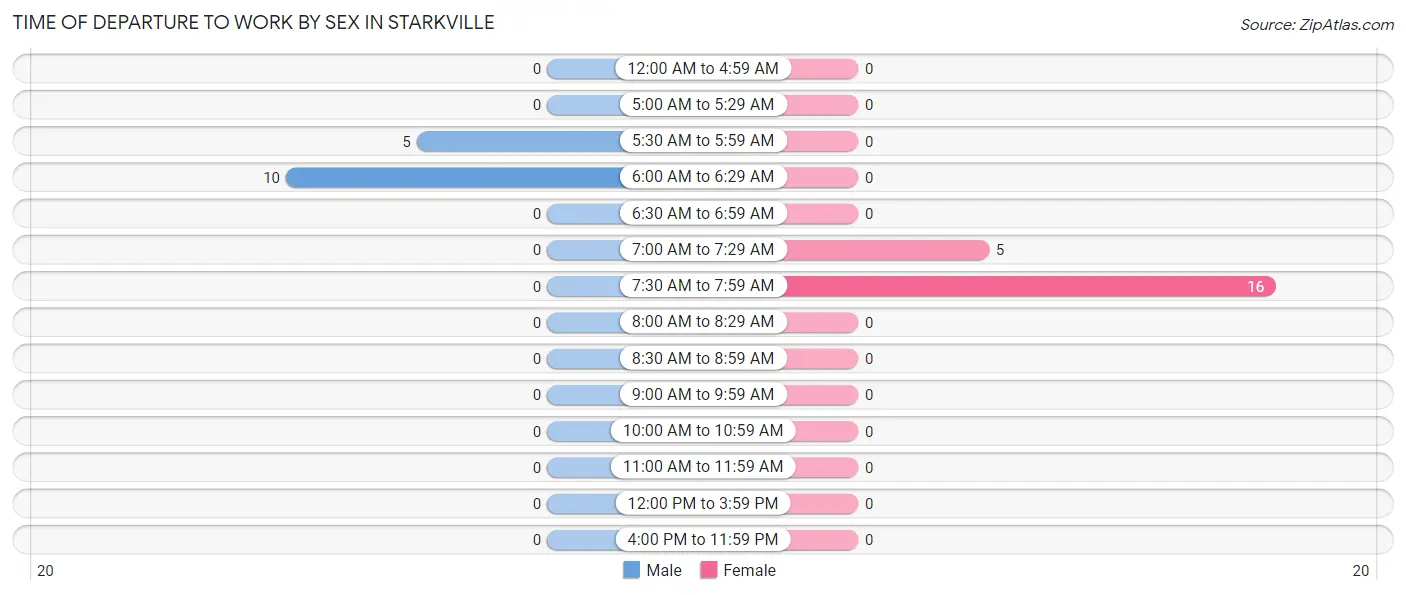
Time of Departure to Work by Sex in Starkville
The most frequent times of departure to work in Starkville are 6:00 AM to 6:29 AM (10, 66.7%) for males and 7:30 AM to 7:59 AM (16, 76.2%) for females.
| Time of Departure | Male | Female |
| 12:00 AM to 4:59 AM | 0 (0.0%) | 0 (0.0%) |
| 5:00 AM to 5:29 AM | 0 (0.0%) | 0 (0.0%) |
| 5:30 AM to 5:59 AM | 5 (33.3%) | 0 (0.0%) |
| 6:00 AM to 6:29 AM | 10 (66.7%) | 0 (0.0%) |
| 6:30 AM to 6:59 AM | 0 (0.0%) | 0 (0.0%) |
| 7:00 AM to 7:29 AM | 0 (0.0%) | 5 (23.8%) |
| 7:30 AM to 7:59 AM | 0 (0.0%) | 16 (76.2%) |
| 8:00 AM to 8:29 AM | 0 (0.0%) | 0 (0.0%) |
| 8:30 AM to 8:59 AM | 0 (0.0%) | 0 (0.0%) |
| 9:00 AM to 9:59 AM | 0 (0.0%) | 0 (0.0%) |
| 10:00 AM to 10:59 AM | 0 (0.0%) | 0 (0.0%) |
| 11:00 AM to 11:59 AM | 0 (0.0%) | 0 (0.0%) |
| 12:00 PM to 3:59 PM | 0 (0.0%) | 0 (0.0%) |
| 4:00 PM to 11:59 PM | 0 (0.0%) | 0 (0.0%) |
| Total | 15 (100.0%) | 21 (100.0%) |
Housing Occupancy in Starkville
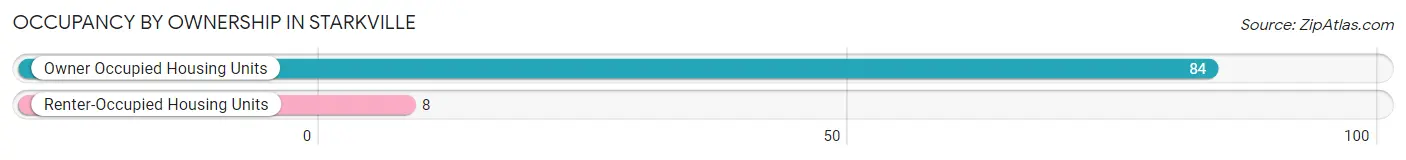
Occupancy by Ownership in Starkville
Of the total 92 dwellings in Starkville, owner-occupied units account for 84 (91.3%), while renter-occupied units make up 8 (8.7%).
| Occupancy | # Housing Units | % Housing Units |
| Owner Occupied Housing Units | 84 | 91.3% |
| Renter-Occupied Housing Units | 8 | 8.7% |
| Total Occupied Housing Units | 92 | 100.0% |
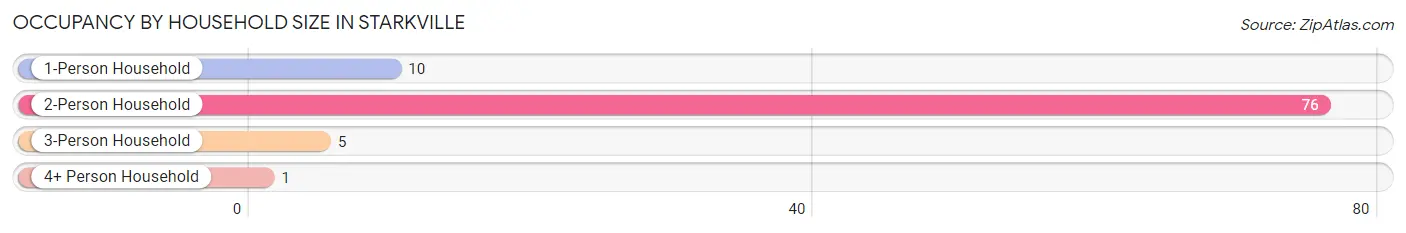
Occupancy by Household Size in Starkville
| Household Size | # Housing Units | % Housing Units |
| 1-Person Household | 10 | 10.9% |
| 2-Person Household | 76 | 82.6% |
| 3-Person Household | 5 | 5.4% |
| 4+ Person Household | 1 | 1.1% |
| Total Housing Units | 92 | 100.0% |
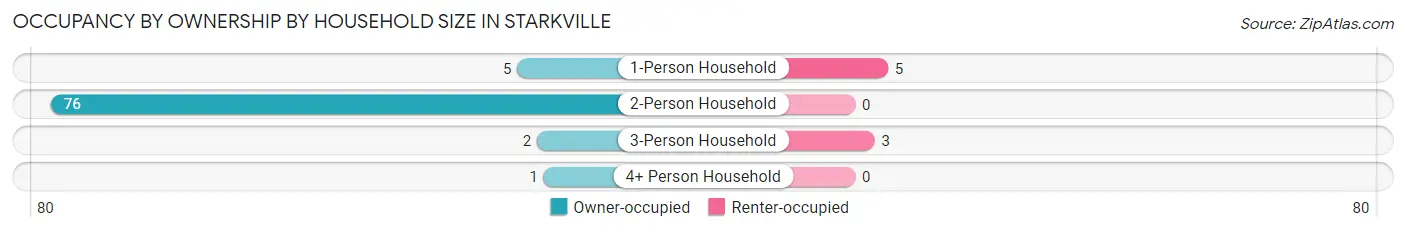
Occupancy by Ownership by Household Size in Starkville
| Household Size | Owner-occupied | Renter-occupied |
| 1-Person Household | 5 (50.0%) | 5 (50.0%) |
| 2-Person Household | 76 (100.0%) | 0 (0.0%) |
| 3-Person Household | 2 (40.0%) | 3 (60.0%) |
| 4+ Person Household | 1 (100.0%) | 0 (0.0%) |
| Total Housing Units | 84 (91.3%) | 8 (8.7%) |
Occupancy by Educational Attainment in Starkville
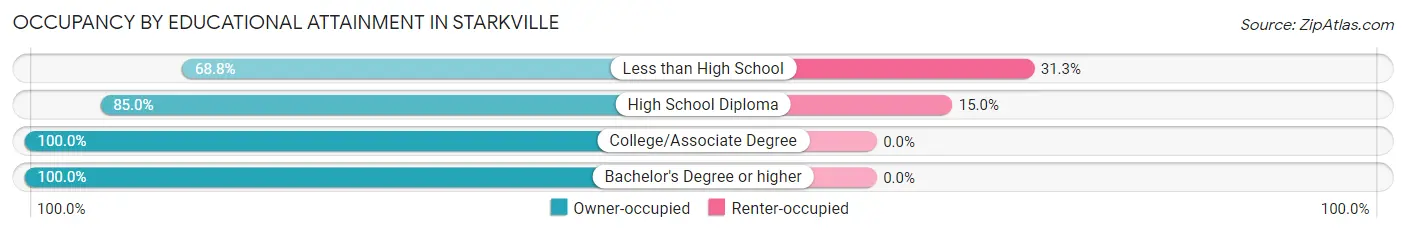
| Household Size | Owner-occupied | Renter-occupied |
| Less than High School | 11 (68.8%) | 5 (31.2%) |
| High School Diploma | 17 (85.0%) | 3 (15.0%) |
| College/Associate Degree | 13 (100.0%) | 0 (0.0%) |
| Bachelor's Degree or higher | 43 (100.0%) | 0 (0.0%) |
Occupancy by Age of Householder in Starkville
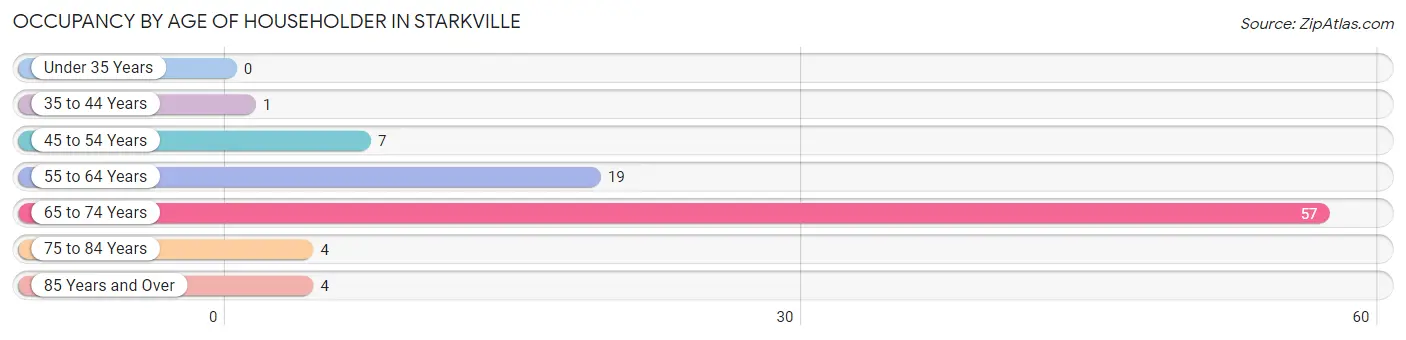
| Age Bracket | # Households | % Households |
| Under 35 Years | 0 | 0.0% |
| 35 to 44 Years | 1 | 1.1% |
| 45 to 54 Years | 7 | 7.6% |
| 55 to 64 Years | 19 | 20.6% |
| 65 to 74 Years | 57 | 62.0% |
| 75 to 84 Years | 4 | 4.3% |
| 85 Years and Over | 4 | 4.3% |
| Total | 92 | 100.0% |
Housing Finances in Starkville
Median Income by Occupancy in Starkville
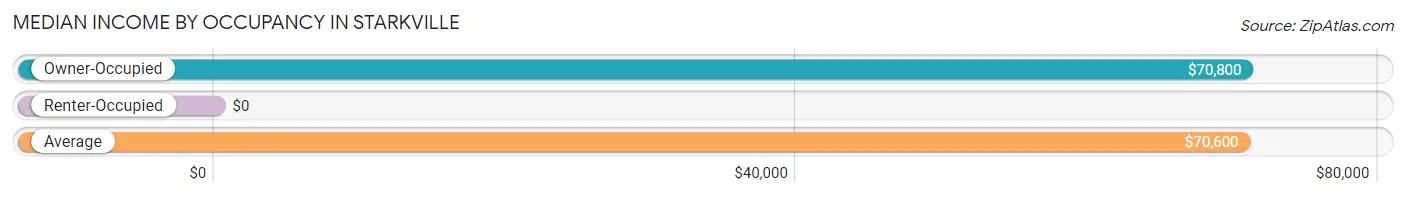
| Occupancy Type | # Households | Median Income |
| Owner-Occupied | 84 (91.3%) | $70,800 |
| Renter-Occupied | 8 (8.7%) | $0 |
| Average | 92 (100.0%) | $70,600 |
Occupancy by Householder Income Bracket in Starkville
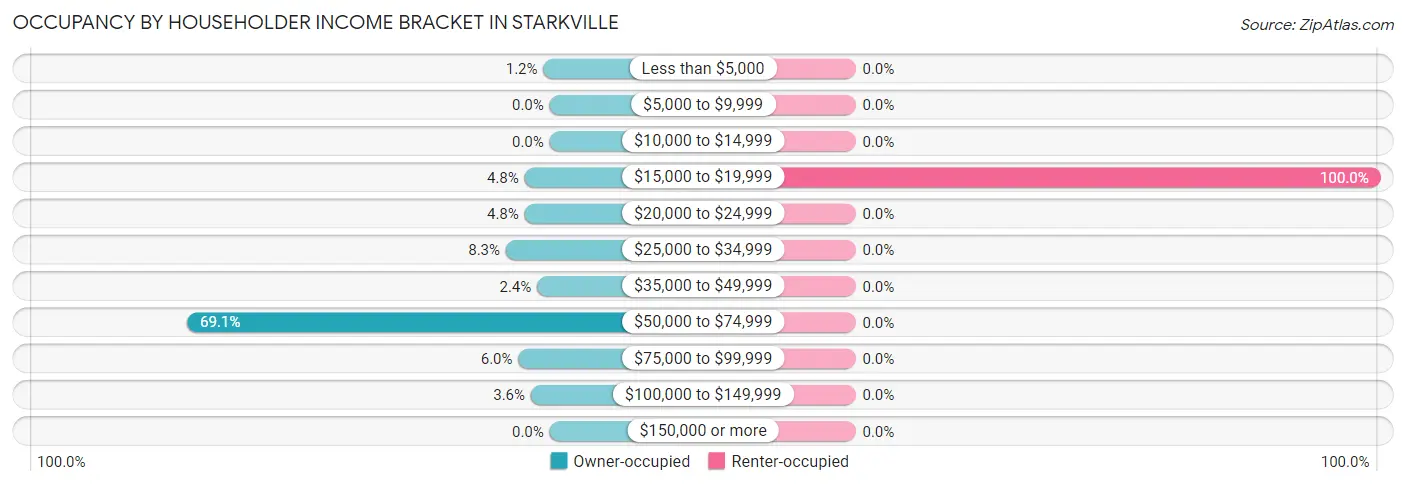
| Income Bracket | Owner-occupied | Renter-occupied |
| Less than $5,000 | 1 (1.2%) | 0 (0.0%) |
| $5,000 to $9,999 | 0 (0.0%) | 0 (0.0%) |
| $10,000 to $14,999 | 0 (0.0%) | 0 (0.0%) |
| $15,000 to $19,999 | 4 (4.8%) | 8 (100.0%) |
| $20,000 to $24,999 | 4 (4.8%) | 0 (0.0%) |
| $25,000 to $34,999 | 7 (8.3%) | 0 (0.0%) |
| $35,000 to $49,999 | 2 (2.4%) | 0 (0.0%) |
| $50,000 to $74,999 | 58 (69.1%) | 0 (0.0%) |
| $75,000 to $99,999 | 5 (5.9%) | 0 (0.0%) |
| $100,000 to $149,999 | 3 (3.6%) | 0 (0.0%) |
| $150,000 or more | 0 (0.0%) | 0 (0.0%) |
| Total | 84 (100.0%) | 8 (100.0%) |
Monthly Housing Cost Tiers in Starkville
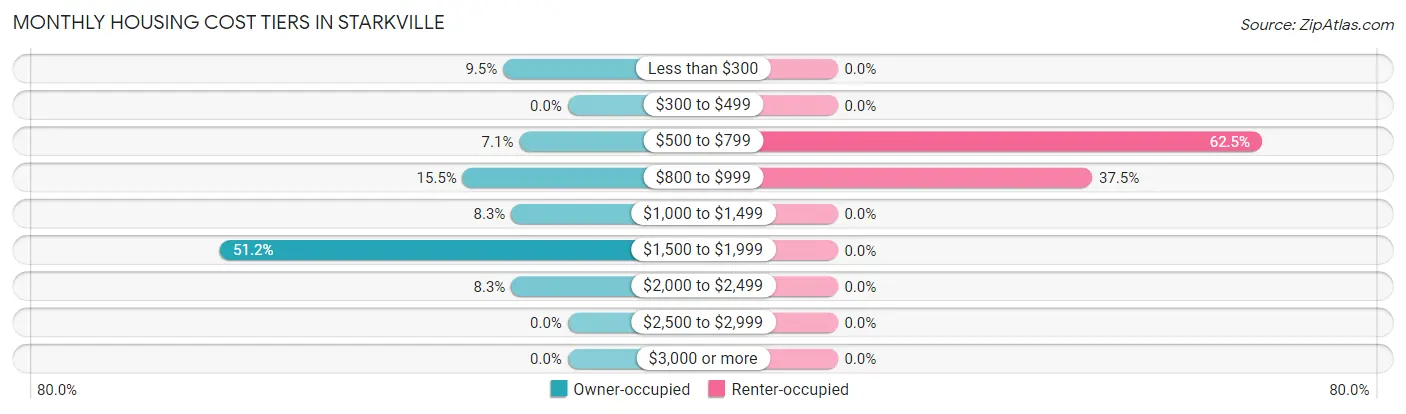
| Monthly Cost | Owner-occupied | Renter-occupied |
| Less than $300 | 8 (9.5%) | 0 (0.0%) |
| $300 to $499 | 0 (0.0%) | 0 (0.0%) |
| $500 to $799 | 6 (7.1%) | 5 (62.5%) |
| $800 to $999 | 13 (15.5%) | 3 (37.5%) |
| $1,000 to $1,499 | 7 (8.3%) | 0 (0.0%) |
| $1,500 to $1,999 | 43 (51.2%) | 0 (0.0%) |
| $2,000 to $2,499 | 7 (8.3%) | 0 (0.0%) |
| $2,500 to $2,999 | 0 (0.0%) | 0 (0.0%) |
| $3,000 or more | 0 (0.0%) | 0 (0.0%) |
| Total | 84 (100.0%) | 8 (100.0%) |
Physical Housing Characteristics in Starkville
Housing Structures in Starkville
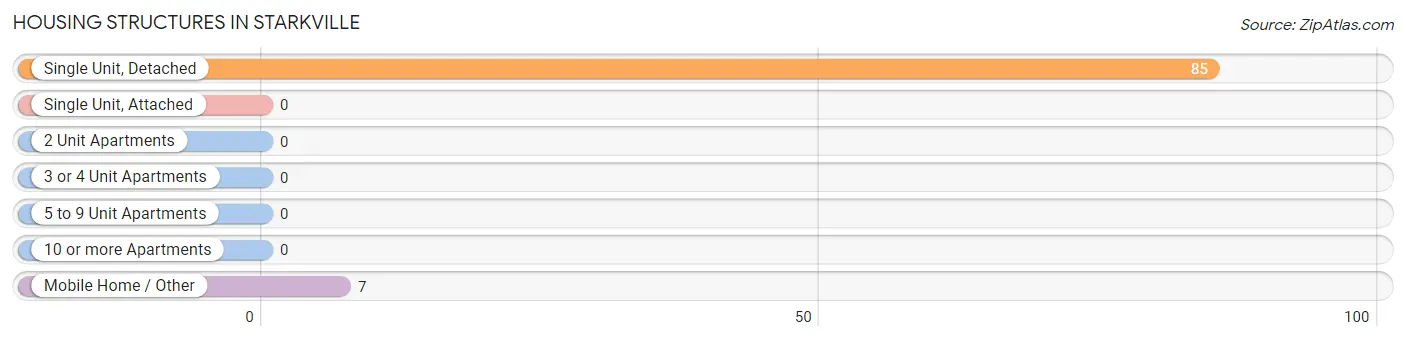
| Structure Type | # Housing Units | % Housing Units |
| Single Unit, Detached | 85 | 92.4% |
| Single Unit, Attached | 0 | 0.0% |
| 2 Unit Apartments | 0 | 0.0% |
| 3 or 4 Unit Apartments | 0 | 0.0% |
| 5 to 9 Unit Apartments | 0 | 0.0% |
| 10 or more Apartments | 0 | 0.0% |
| Mobile Home / Other | 7 | 7.6% |
| Total | 92 | 100.0% |
Housing Structures by Occupancy in Starkville
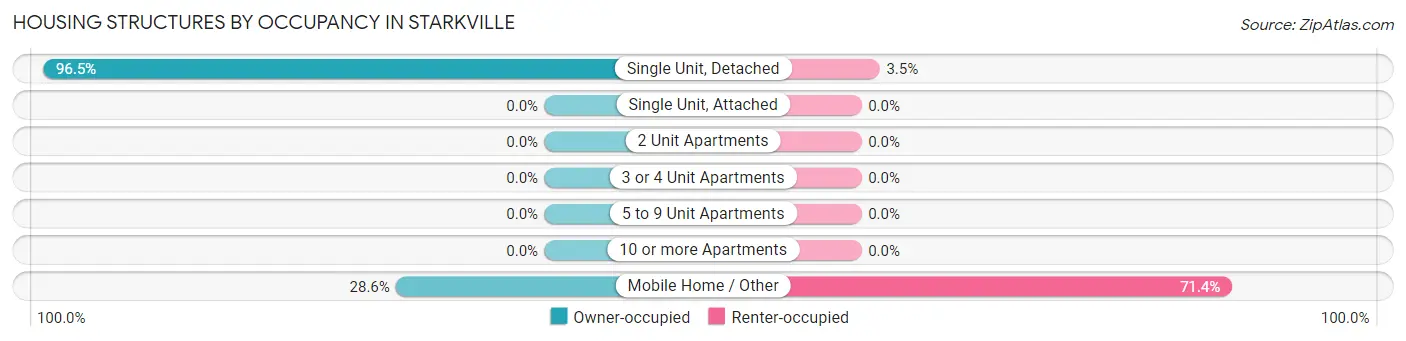
| Structure Type | Owner-occupied | Renter-occupied |
| Single Unit, Detached | 82 (96.5%) | 3 (3.5%) |
| Single Unit, Attached | 0 (0.0%) | 0 (0.0%) |
| 2 Unit Apartments | 0 (0.0%) | 0 (0.0%) |
| 3 or 4 Unit Apartments | 0 (0.0%) | 0 (0.0%) |
| 5 to 9 Unit Apartments | 0 (0.0%) | 0 (0.0%) |
| 10 or more Apartments | 0 (0.0%) | 0 (0.0%) |
| Mobile Home / Other | 2 (28.6%) | 5 (71.4%) |
| Total | 84 (91.3%) | 8 (8.7%) |
Housing Structures by Number of Rooms in Starkville
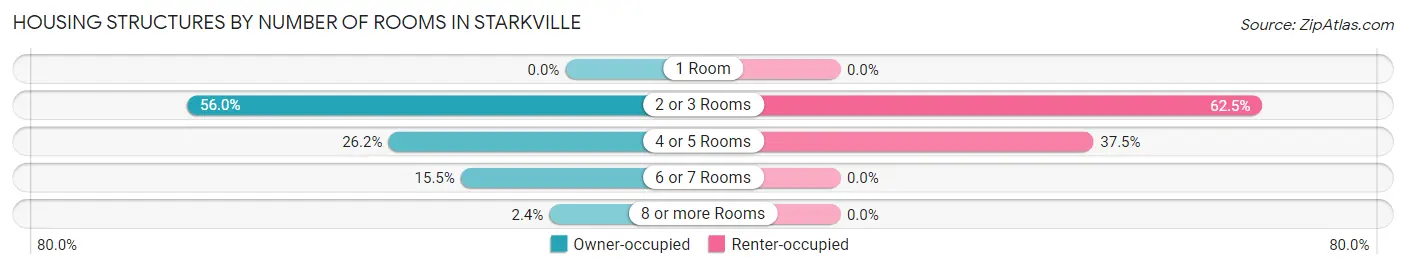
| Number of Rooms | Owner-occupied | Renter-occupied |
| 1 Room | 0 (0.0%) | 0 (0.0%) |
| 2 or 3 Rooms | 47 (55.9%) | 5 (62.5%) |
| 4 or 5 Rooms | 22 (26.2%) | 3 (37.5%) |
| 6 or 7 Rooms | 13 (15.5%) | 0 (0.0%) |
| 8 or more Rooms | 2 (2.4%) | 0 (0.0%) |
| Total | 84 (100.0%) | 8 (100.0%) |
Housing Structure by Heating Type in Starkville
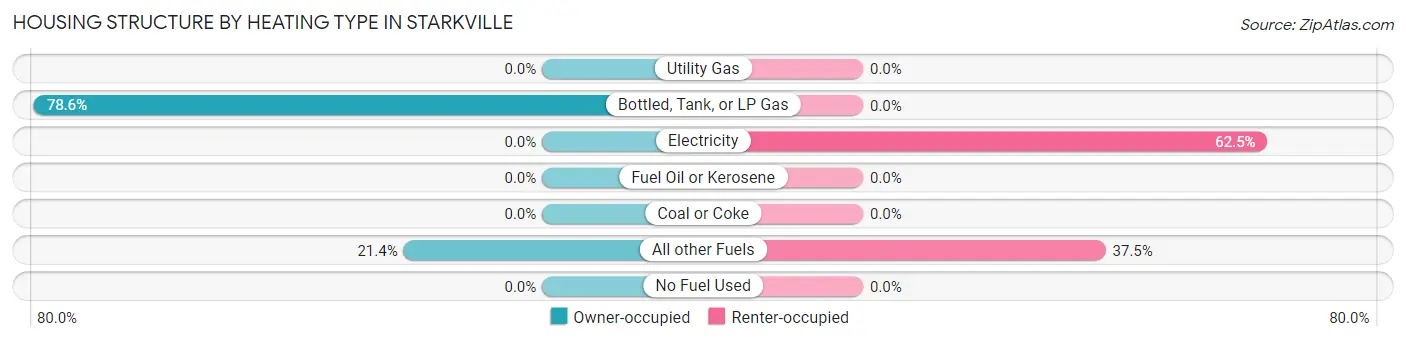
| Heating Type | Owner-occupied | Renter-occupied |
| Utility Gas | 0 (0.0%) | 0 (0.0%) |
| Bottled, Tank, or LP Gas | 66 (78.6%) | 0 (0.0%) |
| Electricity | 0 (0.0%) | 5 (62.5%) |
| Fuel Oil or Kerosene | 0 (0.0%) | 0 (0.0%) |
| Coal or Coke | 0 (0.0%) | 0 (0.0%) |
| All other Fuels | 18 (21.4%) | 3 (37.5%) |
| No Fuel Used | 0 (0.0%) | 0 (0.0%) |
| Total | 84 (100.0%) | 8 (100.0%) |
Household Vehicle Usage in Starkville
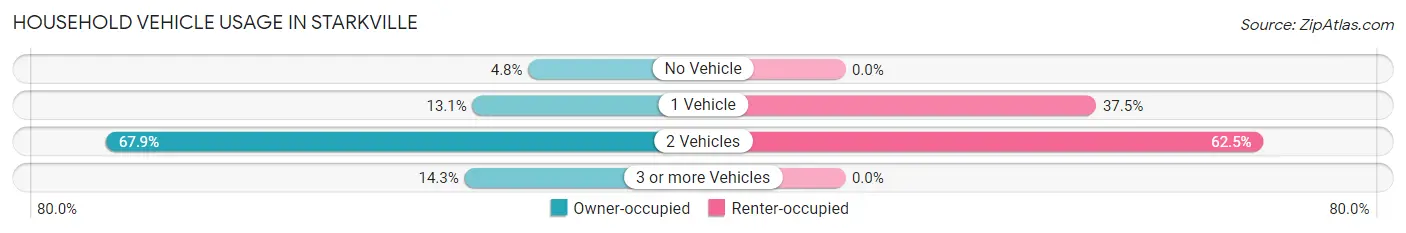
| Vehicles per Household | Owner-occupied | Renter-occupied |
| No Vehicle | 4 (4.8%) | 0 (0.0%) |
| 1 Vehicle | 11 (13.1%) | 3 (37.5%) |
| 2 Vehicles | 57 (67.9%) | 5 (62.5%) |
| 3 or more Vehicles | 12 (14.3%) | 0 (0.0%) |
| Total | 84 (100.0%) | 8 (100.0%) |
Real Estate & Mortgages in Starkville
Real Estate and Mortgage Overview in Starkville
| Characteristic | Without Mortgage | With Mortgage |
| Housing Units | 14 | 70 |
| Median Property Value | - | - |
| Median Household Income | - | - |
| Monthly Housing Costs | - | - |
| Real Estate Taxes | $288 | $0 |
Property Value by Mortgage Status in Starkville
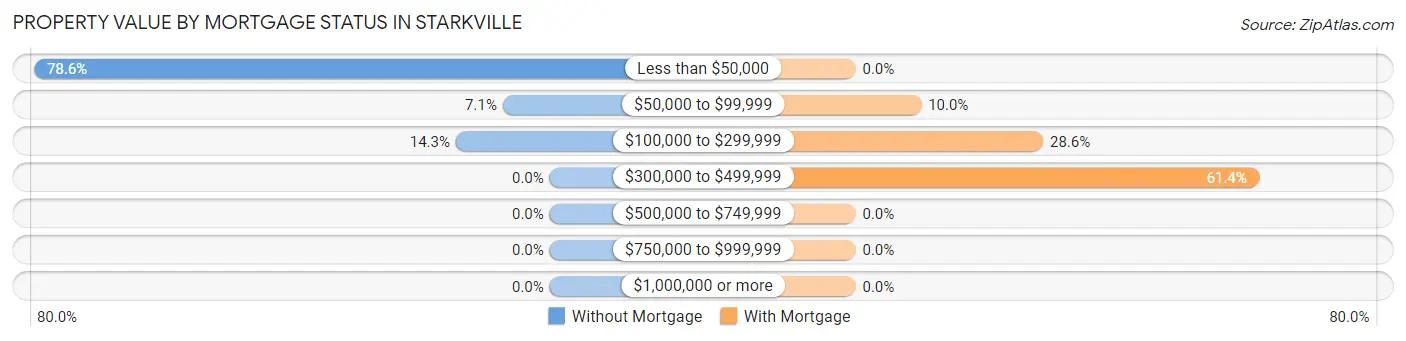
| Property Value | Without Mortgage | With Mortgage |
| Less than $50,000 | 11 (78.6%) | 0 (0.0%) |
| $50,000 to $99,999 | 1 (7.1%) | 7 (10.0%) |
| $100,000 to $299,999 | 2 (14.3%) | 20 (28.6%) |
| $300,000 to $499,999 | 0 (0.0%) | 43 (61.4%) |
| $500,000 to $749,999 | 0 (0.0%) | 0 (0.0%) |
| $750,000 to $999,999 | 0 (0.0%) | 0 (0.0%) |
| $1,000,000 or more | 0 (0.0%) | 0 (0.0%) |
| Total | 14 (100.0%) | 70 (100.0%) |
Household Income by Mortgage Status in Starkville
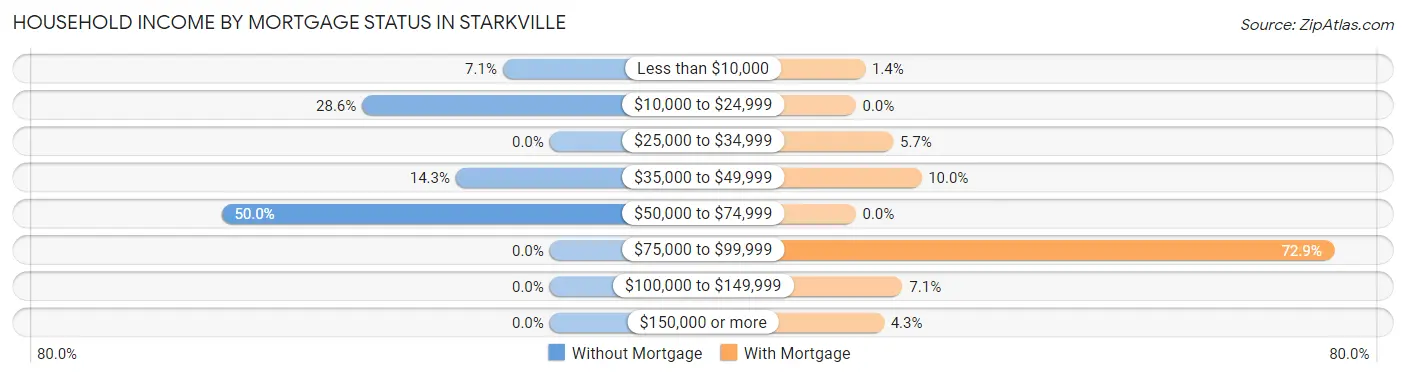
| Household Income | Without Mortgage | With Mortgage |
| Less than $10,000 | 1 (7.1%) | 1 (1.4%) |
| $10,000 to $24,999 | 4 (28.6%) | 0 (0.0%) |
| $25,000 to $34,999 | 0 (0.0%) | 4 (5.7%) |
| $35,000 to $49,999 | 2 (14.3%) | 7 (10.0%) |
| $50,000 to $74,999 | 7 (50.0%) | 0 (0.0%) |
| $75,000 to $99,999 | 0 (0.0%) | 51 (72.9%) |
| $100,000 to $149,999 | 0 (0.0%) | 5 (7.1%) |
| $150,000 or more | 0 (0.0%) | 3 (4.3%) |
| Total | 14 (100.0%) | 70 (100.0%) |
Property Value to Household Income Ratio in Starkville
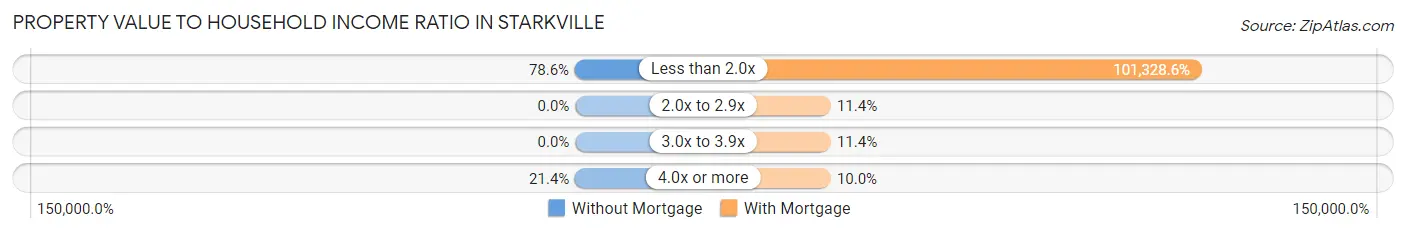
| Value-to-Income Ratio | Without Mortgage | With Mortgage |
| Less than 2.0x | 11 (78.6%) | 70,930 (101,328.6%) |
| 2.0x to 2.9x | 0 (0.0%) | 8 (11.4%) |
| 3.0x to 3.9x | 0 (0.0%) | 8 (11.4%) |
| 4.0x or more | 3 (21.4%) | 7 (10.0%) |
| Total | 14 (100.0%) | 70 (100.0%) |
Real Estate Taxes by Mortgage Status in Starkville
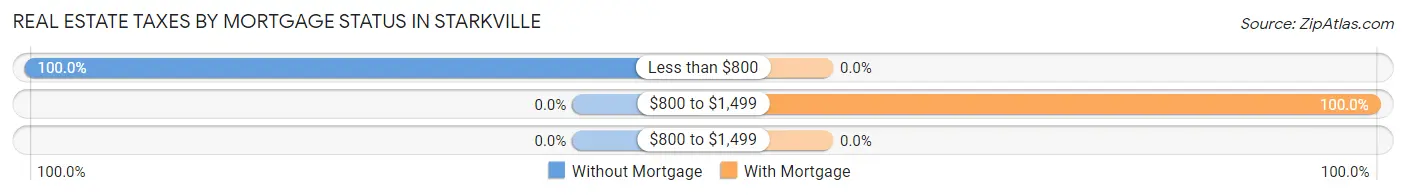
| Property Taxes | Without Mortgage | With Mortgage |
| Less than $800 | 14 (100.0%) | 0 (0.0%) |
| $800 to $1,499 | 0 (0.0%) | 70 (100.0%) |
| $800 to $1,499 | 0 (0.0%) | 0 (0.0%) |
| Total | 14 (100.0%) | 70 (100.0%) |
Health & Disability in Starkville
Health Insurance Coverage by Age in Starkville
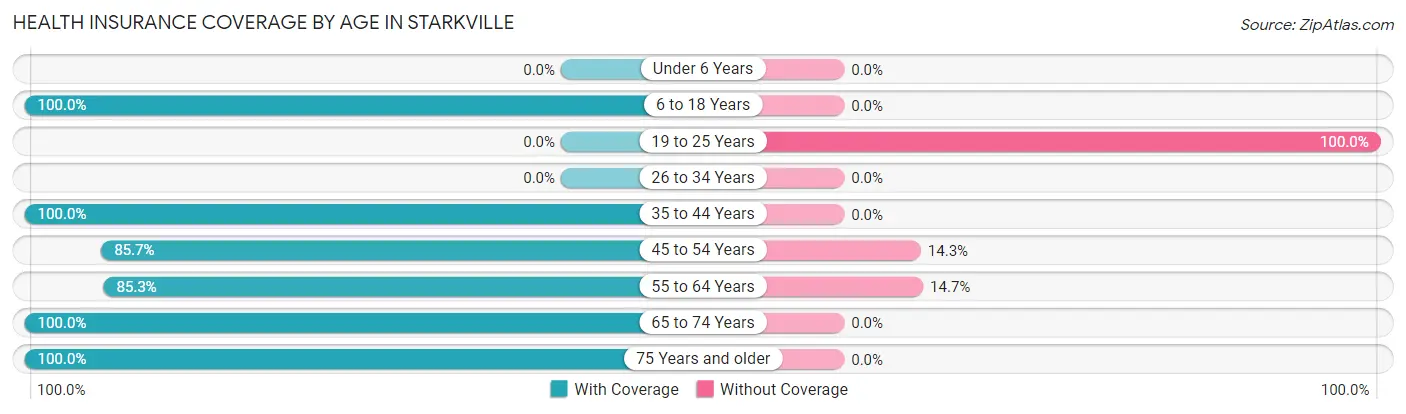
| Age Bracket | With Coverage | Without Coverage |
| Under 6 Years | 0 (0.0%) | 0 (0.0%) |
| 6 to 18 Years | 16 (100.0%) | 0 (0.0%) |
| 19 to 25 Years | 0 (0.0%) | 5 (100.0%) |
| 26 to 34 Years | 0 (0.0%) | 0 (0.0%) |
| 35 to 44 Years | 1 (100.0%) | 0 (0.0%) |
| 45 to 54 Years | 6 (85.7%) | 1 (14.3%) |
| 55 to 64 Years | 29 (85.3%) | 5 (14.7%) |
| 65 to 74 Years | 111 (100.0%) | 0 (0.0%) |
| 75 Years and older | 8 (100.0%) | 0 (0.0%) |
| Total | 171 (94.0%) | 11 (6.0%) |
Health Insurance Coverage by Citizenship Status in Starkville
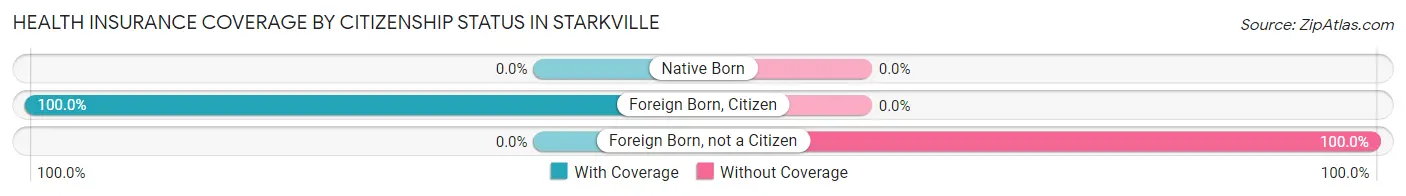
| Citizenship Status | With Coverage | Without Coverage |
| Native Born | 0 (0.0%) | 0 (0.0%) |
| Foreign Born, Citizen | 16 (100.0%) | 0 (0.0%) |
| Foreign Born, not a Citizen | 0 (0.0%) | 5 (100.0%) |
Health Insurance Coverage by Household Income in Starkville
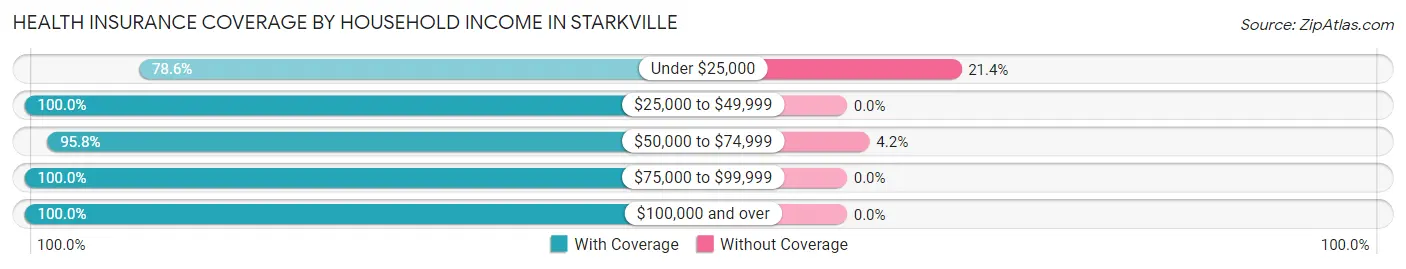
| Household Income | With Coverage | Without Coverage |
| Under $25,000 | 22 (78.6%) | 6 (21.4%) |
| $25,000 to $49,999 | 21 (100.0%) | 0 (0.0%) |
| $50,000 to $74,999 | 113 (95.8%) | 5 (4.2%) |
| $75,000 to $99,999 | 10 (100.0%) | 0 (0.0%) |
| $100,000 and over | 5 (100.0%) | 0 (0.0%) |
Public vs Private Health Insurance Coverage by Age in Starkville
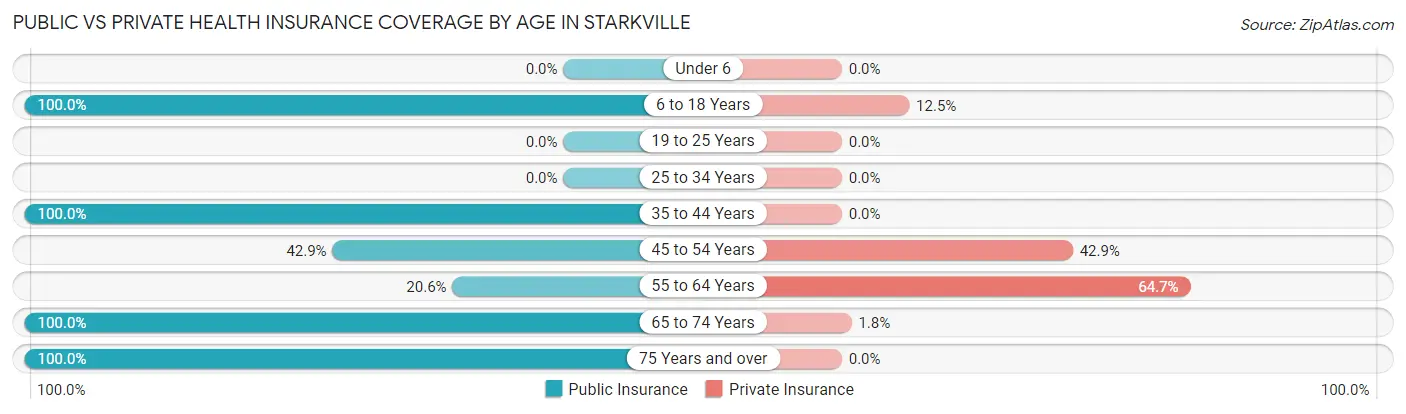
| Age Bracket | Public Insurance | Private Insurance |
| Under 6 | 0 (0.0%) | 0 (0.0%) |
| 6 to 18 Years | 16 (100.0%) | 2 (12.5%) |
| 19 to 25 Years | 0 (0.0%) | 0 (0.0%) |
| 25 to 34 Years | 0 (0.0%) | 0 (0.0%) |
| 35 to 44 Years | 1 (100.0%) | 0 (0.0%) |
| 45 to 54 Years | 3 (42.9%) | 3 (42.9%) |
| 55 to 64 Years | 7 (20.6%) | 22 (64.7%) |
| 65 to 74 Years | 111 (100.0%) | 2 (1.8%) |
| 75 Years and over | 8 (100.0%) | 0 (0.0%) |
| Total | 146 (80.2%) | 29 (15.9%) |
Disability Status by Sex by Age in Starkville
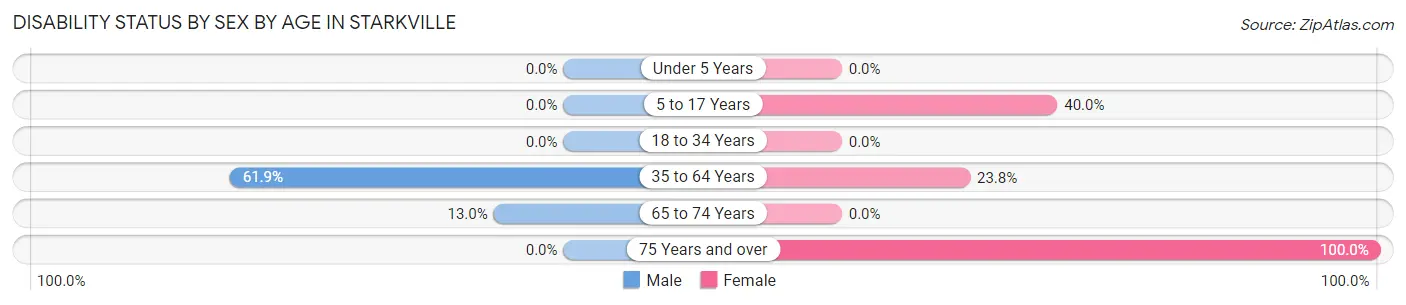
| Age Bracket | Male | Female |
| Under 5 Years | 0 (0.0%) | 0 (0.0%) |
| 5 to 17 Years | 0 (0.0%) | 4 (40.0%) |
| 18 to 34 Years | 0 (0.0%) | 0 (0.0%) |
| 35 to 64 Years | 13 (61.9%) | 5 (23.8%) |
| 65 to 74 Years | 7 (13.0%) | 0 (0.0%) |
| 75 Years and over | 0 (0.0%) | 8 (100.0%) |
Disability Class by Sex by Age in Starkville
Disability Class: Hearing Difficulty

| Age Bracket | Male | Female |
| Under 5 Years | 0 (0.0%) | 0 (0.0%) |
| 5 to 17 Years | 0 (0.0%) | 0 (0.0%) |
| 18 to 34 Years | 0 (0.0%) | 0 (0.0%) |
| 35 to 64 Years | 13 (61.9%) | 0 (0.0%) |
| 65 to 74 Years | 0 (0.0%) | 0 (0.0%) |
| 75 Years and over | 0 (0.0%) | 0 (0.0%) |
Disability Class: Vision Difficulty
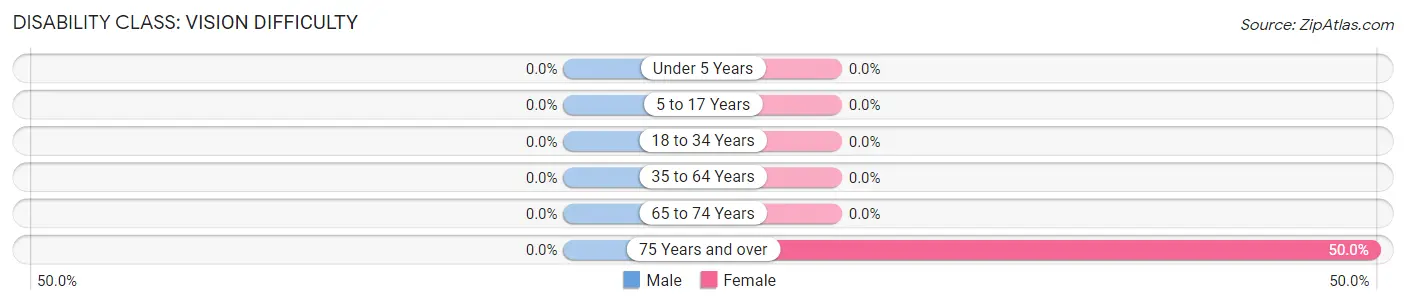
| Age Bracket | Male | Female |
| Under 5 Years | 0 (0.0%) | 0 (0.0%) |
| 5 to 17 Years | 0 (0.0%) | 0 (0.0%) |
| 18 to 34 Years | 0 (0.0%) | 0 (0.0%) |
| 35 to 64 Years | 0 (0.0%) | 0 (0.0%) |
| 65 to 74 Years | 0 (0.0%) | 0 (0.0%) |
| 75 Years and over | 0 (0.0%) | 4 (50.0%) |
Disability Class: Cognitive Difficulty
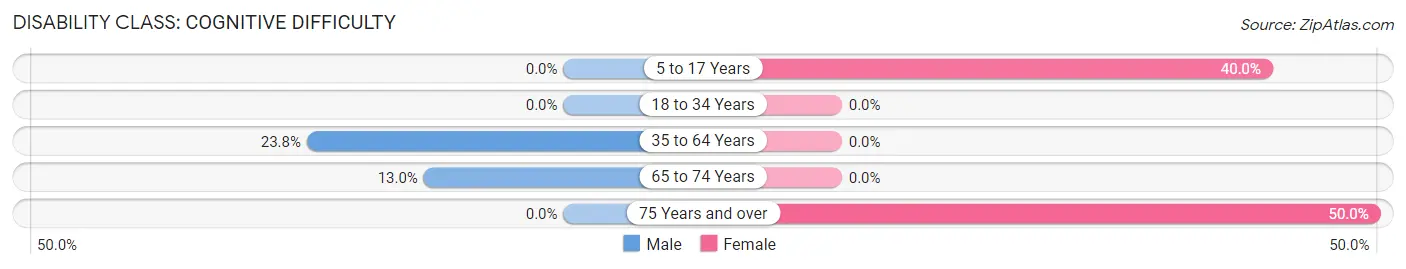
| Age Bracket | Male | Female |
| 5 to 17 Years | 0 (0.0%) | 4 (40.0%) |
| 18 to 34 Years | 0 (0.0%) | 0 (0.0%) |
| 35 to 64 Years | 5 (23.8%) | 0 (0.0%) |
| 65 to 74 Years | 7 (13.0%) | 0 (0.0%) |
| 75 Years and over | 0 (0.0%) | 4 (50.0%) |
Disability Class: Ambulatory Difficulty
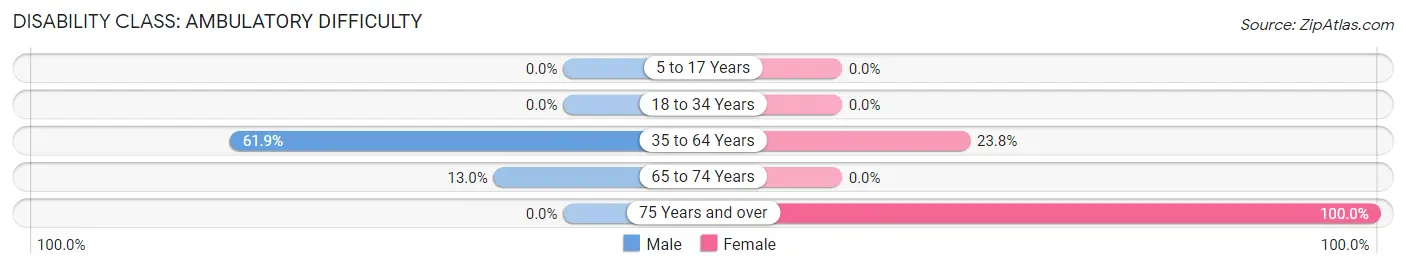
| Age Bracket | Male | Female |
| 5 to 17 Years | 0 (0.0%) | 0 (0.0%) |
| 18 to 34 Years | 0 (0.0%) | 0 (0.0%) |
| 35 to 64 Years | 13 (61.9%) | 5 (23.8%) |
| 65 to 74 Years | 7 (13.0%) | 0 (0.0%) |
| 75 Years and over | 0 (0.0%) | 8 (100.0%) |
Disability Class: Self-Care Difficulty
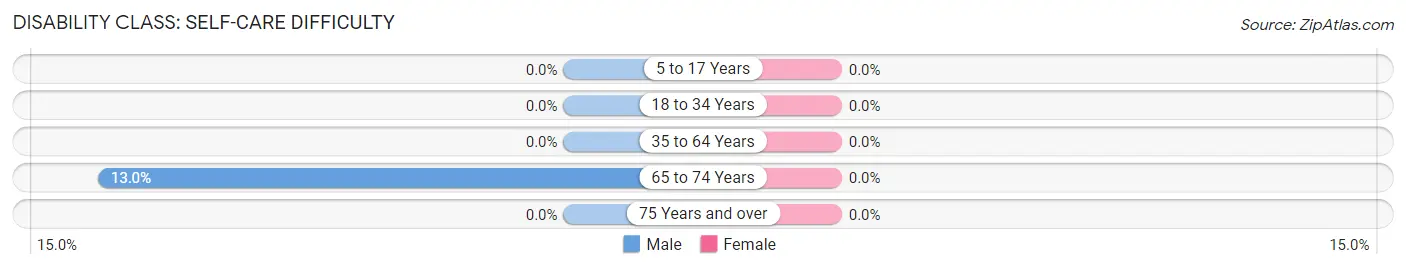
| Age Bracket | Male | Female |
| 5 to 17 Years | 0 (0.0%) | 0 (0.0%) |
| 18 to 34 Years | 0 (0.0%) | 0 (0.0%) |
| 35 to 64 Years | 0 (0.0%) | 0 (0.0%) |
| 65 to 74 Years | 7 (13.0%) | 0 (0.0%) |
| 75 Years and over | 0 (0.0%) | 0 (0.0%) |
Technology Access in Starkville
Computing Device Access in Starkville
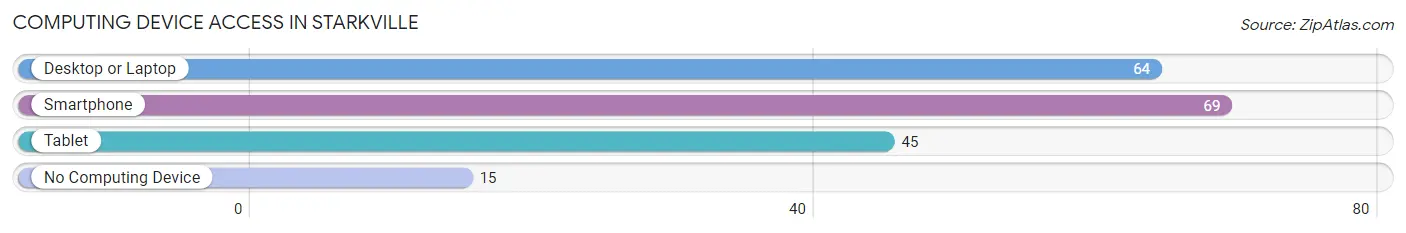
| Device Type | # Households | % Households |
| Desktop or Laptop | 64 | 69.6% |
| Smartphone | 69 | 75.0% |
| Tablet | 45 | 48.9% |
| No Computing Device | 15 | 16.3% |
| Total | 92 | 100.0% |
Internet Access in Starkville
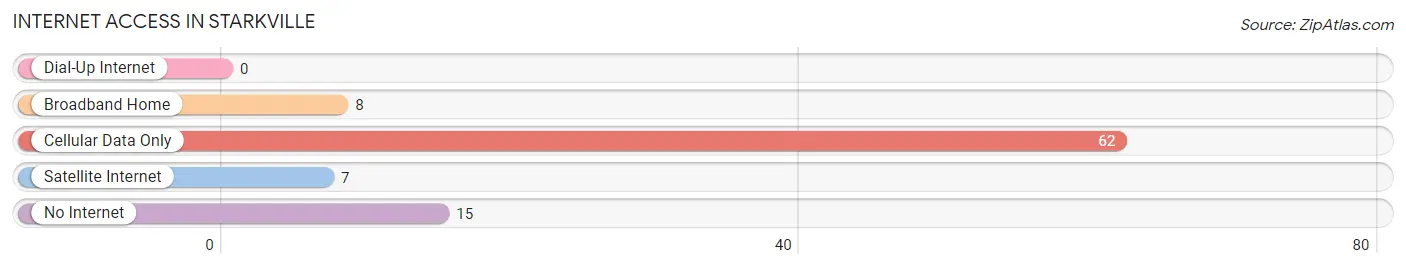
| Internet Type | # Households | % Households |
| Dial-Up Internet | 0 | 0.0% |
| Broadband Home | 8 | 8.7% |
| Cellular Data Only | 62 | 67.4% |
| Satellite Internet | 7 | 7.6% |
| No Internet | 15 | 16.3% |
| Total | 92 | 100.0% |
Starkville Summary
Starkville, Colorado is a small town located in the San Luis Valley in the south-central part of the state. It is situated at an elevation of 7,890 feet and is the county seat of Costilla County. The town was founded in 1876 and is named after the nearby Starkville Pass. The population of Starkville was estimated to be 545 in 2019.
History
Starkville was founded in 1876 by a group of settlers from the nearby town of San Luis. The town was named after the nearby Starkville Pass, which was named after a local prospector, William Stark. The town was originally a mining camp, and the first post office was established in 1877. The town grew slowly over the years, and by the early 1900s, it had become a bustling center of commerce and industry.
The town was incorporated in 1909 and the first mayor was elected in 1910. The town continued to grow and by the 1920s, it had become a popular tourist destination. The town was also home to a number of businesses, including a hotel, a bank, a newspaper, and a movie theater.
Geography
Starkville is located in the San Luis Valley in the south-central part of Colorado. The town is situated at an elevation of 7,890 feet and is surrounded by the Sangre de Cristo Mountains to the east and the San Juan Mountains to the west. The town is located on the banks of the Rio Grande River and is approximately 30 miles south of Alamosa.
The climate in Starkville is semi-arid, with hot summers and cold winters. The average annual temperature is 45°F and the average annual precipitation is 12.5 inches.
Economy
The economy of Starkville is largely based on agriculture and tourism. The town is home to a number of farms and ranches, and the surrounding area is known for its production of potatoes, alfalfa, and hay. The town is also home to a number of tourist attractions, including the Great Sand Dunes National Park and the San Luis Valley Museum.
Demographics
As of the 2019 census, the population of Starkville was estimated to be 545. The racial makeup of the town was 94.2% White, 0.7% African American, 0.7% Native American, 0.7% Asian, 0.7% Pacific Islander, and 2.9% from other races. The median household income was $31,250 and the median family income was $37,500. The per capita income was $17,500.
Starkville is a small town with a rich history and a vibrant economy. The town is home to a number of farms and ranches, and the surrounding area is known for its production of potatoes, alfalfa, and hay. The town is also home to a number of tourist attractions, including the Great Sand Dunes National Park and the San Luis Valley Museum. The population of Starkville is estimated to be 545, and the town is largely populated by White, Native American, and Hispanic residents.
Common Questions
What is Per Capita Income in Starkville?
Per Capita income in Starkville is $28,849.
What is the Median Family Income in Starkville?
Median Family Income in Starkville is $70,850.
What is the Median Household income in Starkville?
Median Household Income in Starkville is $70,600.
What is Inequality or Gini Index in Starkville?
Inequality or Gini Index in Starkville is 0.22.
What is the Total Population of Starkville?
Total Population of Starkville is 182.
What is the Total Male Population of Starkville?
Total Male Population of Starkville is 81.
What is the Total Female Population of Starkville?
Total Female Population of Starkville is 101.
What is the Ratio of Males per 100 Females in Starkville?
There are 80.20 Males per 100 Females in Starkville.
What is the Ratio of Females per 100 Males in Starkville?
There are 124.69 Females per 100 Males in Starkville.
What is the Median Population Age in Starkville?
Median Population Age in Starkville is 67.3 Years.
What is the Average Family Size in Starkville
Average Family Size in Starkville is 2.1 People.
What is the Average Household Size in Starkville
Average Household Size in Starkville is 2.0 People.
How Large is the Labor Force in Starkville?
There are 36 People in the Labor Forcein in Starkville.
What is the Percentage of People in the Labor Force in Starkville?
20.8% of People are in the Labor Force in Starkville.