Zip Codes with the Highest Percentage of Population Employed in Health Diagnosing & Treating in Brighton, CO
RELATED REPORTS & OPTIONS
Health Diagnosing & Treating
Brighton
Compare Zip Codes
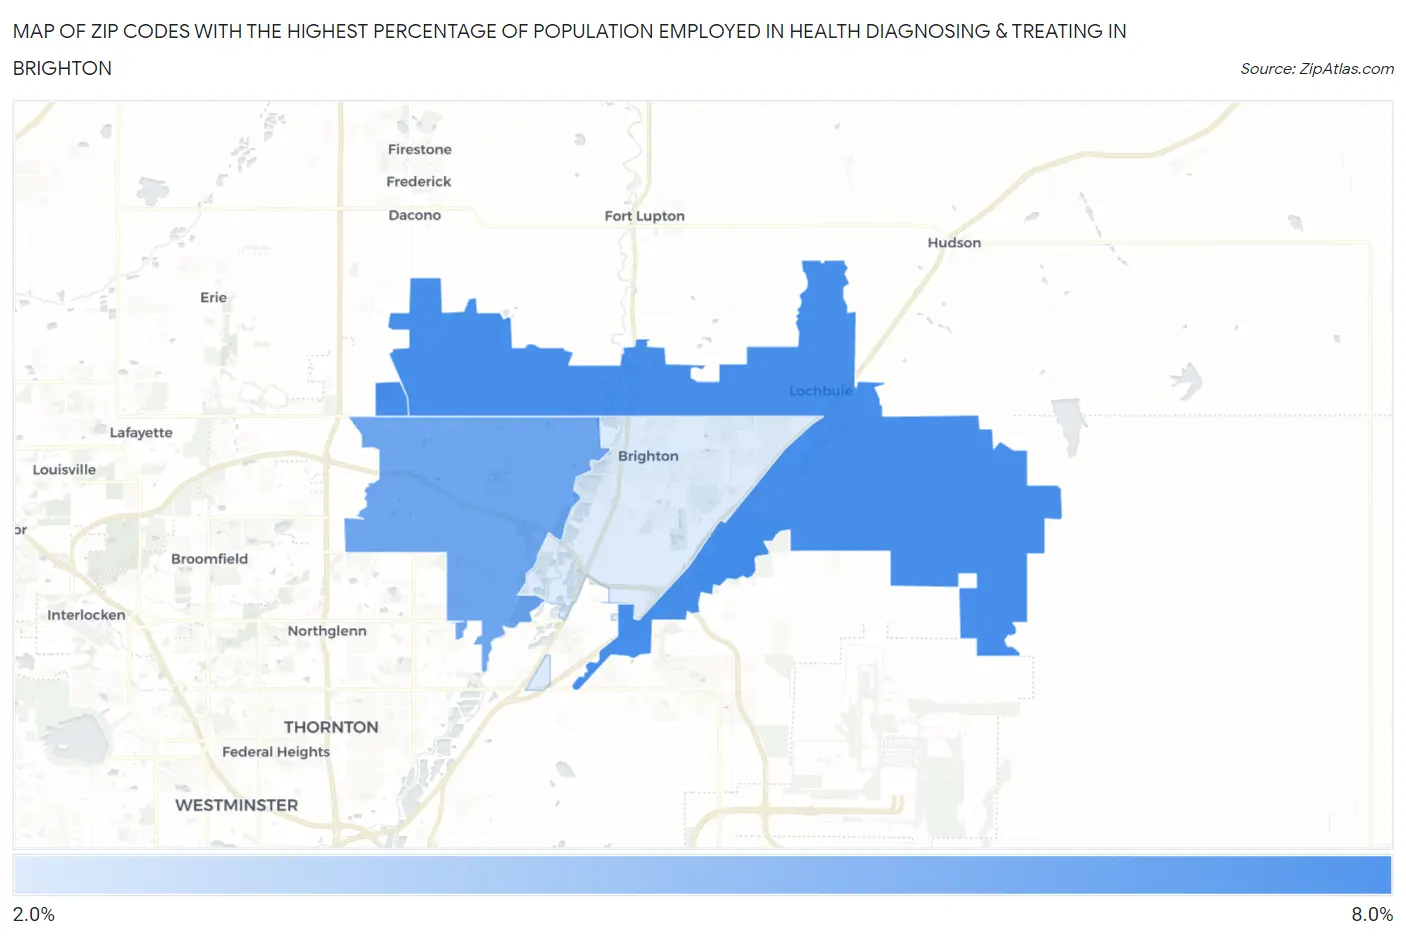
Map of Zip Codes with the Highest Percentage of Population Employed in Health Diagnosing & Treating in Brighton
3.0%
6.9%
Zip Codes with the Highest Percentage of Population Employed in Health Diagnosing & Treating in Brighton, CO
| Zip Code | % Employed | vs State | vs National | |
| 1. | 80603 | 6.9% | 5.8%(+1.06)#146 | 6.2%(+0.626)#10,777 |
| 2. | 80602 | 5.8% | 5.8%(+0.006)#197 | 6.2%(-0.431)#14,558 |
| 3. | 80601 | 3.0% | 5.8%(-2.83)#352 | 6.2%(-3.26)#24,363 |
1
Common Questions
What are the Top Zip Codes with the Highest Percentage of Population Employed in Health Diagnosing & Treating in Brighton, CO?
Top Zip Codes with the Highest Percentage of Population Employed in Health Diagnosing & Treating in Brighton, CO are:
What zip code has the Highest Percentage of Population Employed in Health Diagnosing & Treating in Brighton, CO?
80603 has the Highest Percentage of Population Employed in Health Diagnosing & Treating in Brighton, CO with 6.9%.
What is the Percentage of Population Employed in Health Diagnosing & Treating in Brighton, CO?
Percentage of Population Employed in Health Diagnosing & Treating in Brighton is 2.9%.
What is the Percentage of Population Employed in Health Diagnosing & Treating in Colorado?
Percentage of Population Employed in Health Diagnosing & Treating in Colorado is 5.8%.
What is the Percentage of Population Employed in Health Diagnosing & Treating in the United States?
Percentage of Population Employed in Health Diagnosing & Treating in the United States is 6.2%.