Zip Codes with the Highest Percentage of Population Employed in Health Diagnosing & Treating in Crested Butte, CO
RELATED REPORTS & OPTIONS
Health Diagnosing & Treating
Crested Butte
Compare Zip Codes
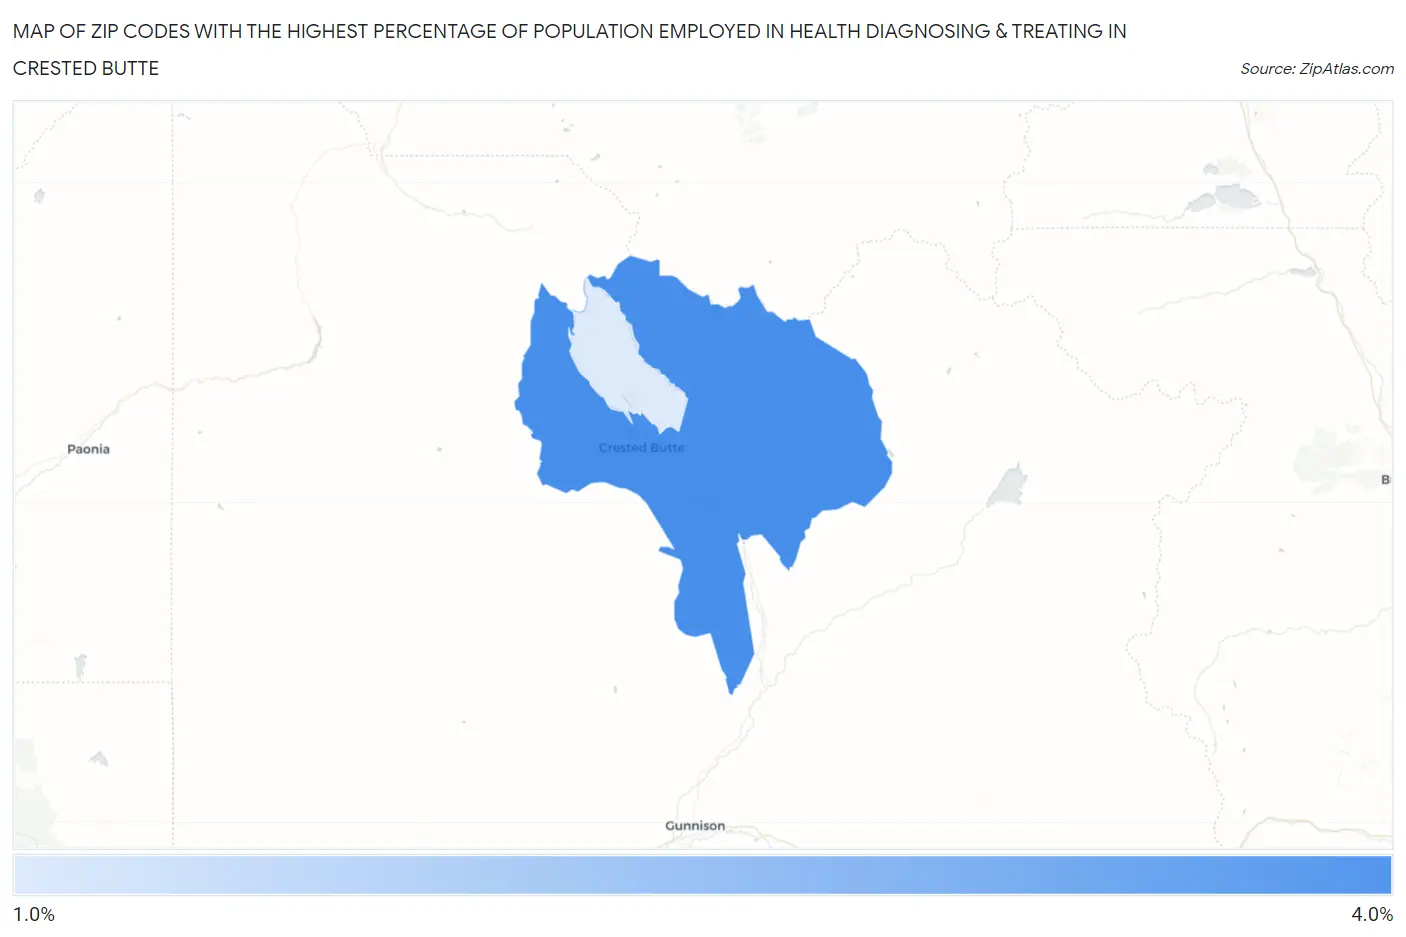
Map of Zip Codes with the Highest Percentage of Population Employed in Health Diagnosing & Treating in Crested Butte
1.8%
3.5%
Zip Codes with the Highest Percentage of Population Employed in Health Diagnosing & Treating in Crested Butte, CO
| Zip Code | % Employed | vs State | vs National | |
| 1. | 81224 | 3.5% | 5.8%(-2.32)#337 | 6.2%(-2.76)#22,958 |
| 2. | 81225 | 1.8% | 5.8%(-4.04)#395 | 6.2%(-4.48)#26,848 |
1
Common Questions
What are the Top Zip Codes with the Highest Percentage of Population Employed in Health Diagnosing & Treating in Crested Butte, CO?
Top Zip Codes with the Highest Percentage of Population Employed in Health Diagnosing & Treating in Crested Butte, CO are:
What zip code has the Highest Percentage of Population Employed in Health Diagnosing & Treating in Crested Butte, CO?
81224 has the Highest Percentage of Population Employed in Health Diagnosing & Treating in Crested Butte, CO with 3.5%.
What is the Percentage of Population Employed in Health Diagnosing & Treating in Crested Butte, CO?
Percentage of Population Employed in Health Diagnosing & Treating in Crested Butte is 1.3%.
What is the Percentage of Population Employed in Health Diagnosing & Treating in Colorado?
Percentage of Population Employed in Health Diagnosing & Treating in Colorado is 5.8%.
What is the Percentage of Population Employed in Health Diagnosing & Treating in the United States?
Percentage of Population Employed in Health Diagnosing & Treating in the United States is 6.2%.