Zip Codes with the Highest Percentage of Population Employed in Health Diagnosing & Treating in Golden, CO
RELATED REPORTS & OPTIONS
Health Diagnosing & Treating
Golden
Compare Zip Codes
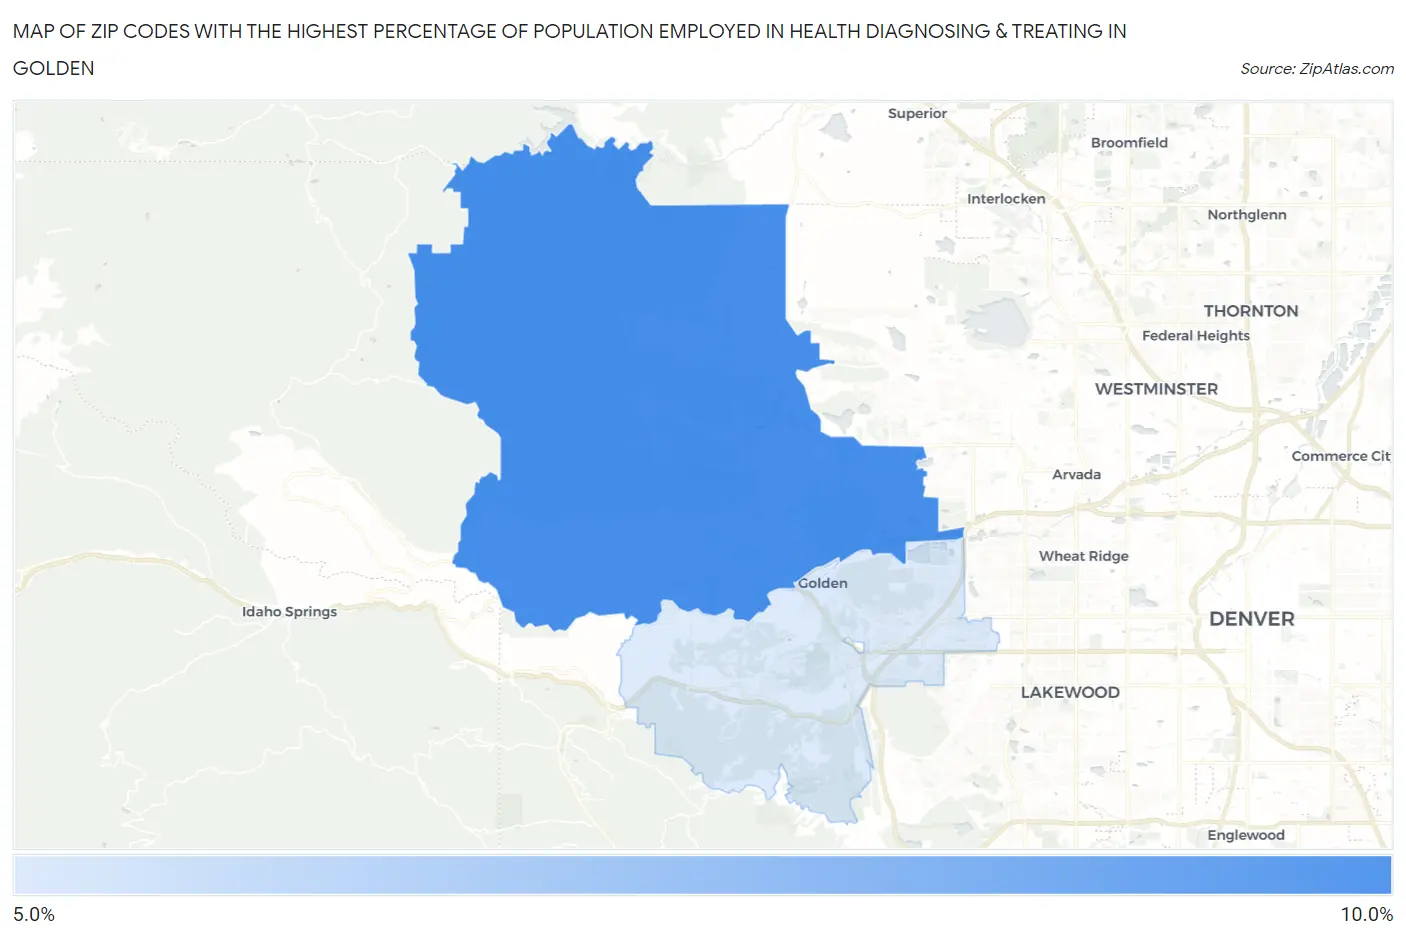
Map of Zip Codes with the Highest Percentage of Population Employed in Health Diagnosing & Treating in Golden
5.8%
8.9%
Zip Codes with the Highest Percentage of Population Employed in Health Diagnosing & Treating in Golden, CO
| Zip Code | % Employed | vs State | vs National | |
| 1. | 80403 | 8.9% | 5.8%(+3.09)#69 | 6.2%(+2.65)#5,531 |
| 2. | 80401 | 5.8% | 5.8%(-0.050)#204 | 6.2%(-0.487)#14,759 |
1
Common Questions
What are the Top Zip Codes with the Highest Percentage of Population Employed in Health Diagnosing & Treating in Golden, CO?
Top Zip Codes with the Highest Percentage of Population Employed in Health Diagnosing & Treating in Golden, CO are:
What zip code has the Highest Percentage of Population Employed in Health Diagnosing & Treating in Golden, CO?
80403 has the Highest Percentage of Population Employed in Health Diagnosing & Treating in Golden, CO with 8.9%.
What is the Percentage of Population Employed in Health Diagnosing & Treating in Golden, CO?
Percentage of Population Employed in Health Diagnosing & Treating in Golden is 6.0%.
What is the Percentage of Population Employed in Health Diagnosing & Treating in Colorado?
Percentage of Population Employed in Health Diagnosing & Treating in Colorado is 5.8%.
What is the Percentage of Population Employed in Health Diagnosing & Treating in the United States?
Percentage of Population Employed in Health Diagnosing & Treating in the United States is 6.2%.