Lochbuie, CO Map & Demographics
Lochbuie Map
Lochbuie Overview
$34,226
PER CAPITA INCOME
$91,319
AVG FAMILY INCOME
$84,556
AVG HOUSEHOLD INCOME
37.4%
WAGE / INCOME GAP [ % ]
62.6¢/ $1
WAGE / INCOME GAP [ $ ]
0.28
INEQUALITY / GINI INDEX
7,963
TOTAL POPULATION
4,008
MALE POPULATION
3,955
FEMALE POPULATION
101.34
MALES / 100 FEMALES
98.68
FEMALES / 100 MALES
32.5
MEDIAN AGE
3.2
AVG FAMILY SIZE
2.8
AVG HOUSEHOLD SIZE
4,435
LABOR FORCE [ PEOPLE ]
75.0%
PERCENT IN LABOR FORCE
2.3%
UNEMPLOYMENT RATE
Income in Lochbuie
Income Overview in Lochbuie
Per Capita Income in Lochbuie is $34,226, while median incomes of families and households are $91,319 and $84,556 respectively.
| Characteristic | Number | Measure |
| Per Capita Income | 7,963 | $34,226 |
| Median Family Income | 2,159 | $91,319 |
| Mean Family Income | 2,159 | $97,918 |
| Median Household Income | 2,839 | $84,556 |
| Mean Household Income | 2,839 | $91,777 |
| Income Deficit | 2,159 | $0 |
| Wage / Income Gap (%) | 7,963 | 37.40% |
| Wage / Income Gap ($) | 7,963 | 62.60¢ per $1 |
| Gini / Inequality Index | 7,963 | 0.28 |
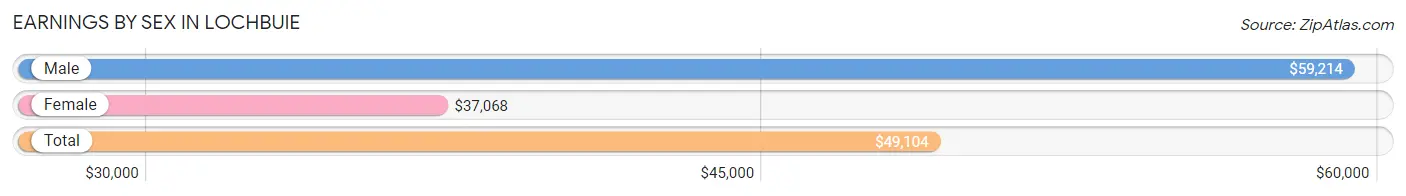
Earnings by Sex in Lochbuie
Average Earnings in Lochbuie are $49,104, $59,214 for men and $37,068 for women, a difference of 37.4%.
| Sex | Number | Average Earnings |
| Male | 2,762 (57.7%) | $59,214 |
| Female | 2,023 (42.3%) | $37,068 |
| Total | 4,785 (100.0%) | $49,104 |
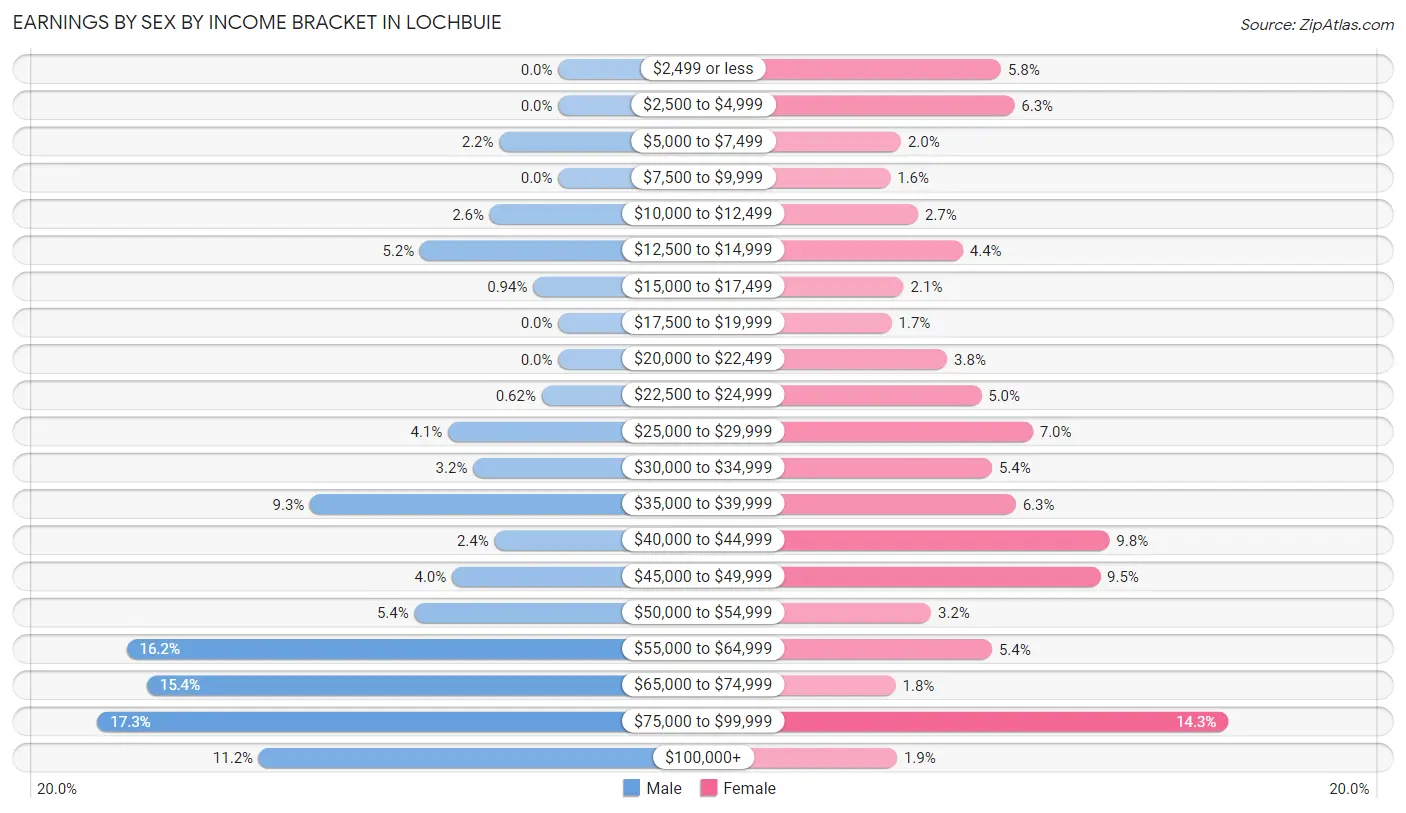
Earnings by Sex by Income Bracket in Lochbuie
The most common earnings brackets in Lochbuie are $75,000 to $99,999 for men (477 | 17.3%) and $75,000 to $99,999 for women (289 | 14.3%).
| Income | Male | Female |
| $2,499 or less | 0 (0.0%) | 117 (5.8%) |
| $2,500 to $4,999 | 0 (0.0%) | 127 (6.3%) |
| $5,000 to $7,499 | 61 (2.2%) | 41 (2.0%) |
| $7,500 to $9,999 | 0 (0.0%) | 33 (1.6%) |
| $10,000 to $12,499 | 71 (2.6%) | 54 (2.7%) |
| $12,500 to $14,999 | 143 (5.2%) | 88 (4.3%) |
| $15,000 to $17,499 | 26 (0.9%) | 43 (2.1%) |
| $17,500 to $19,999 | 0 (0.0%) | 34 (1.7%) |
| $20,000 to $22,499 | 0 (0.0%) | 76 (3.8%) |
| $22,500 to $24,999 | 17 (0.6%) | 102 (5.0%) |
| $25,000 to $29,999 | 114 (4.1%) | 141 (7.0%) |
| $30,000 to $34,999 | 88 (3.2%) | 110 (5.4%) |
| $35,000 to $39,999 | 257 (9.3%) | 128 (6.3%) |
| $40,000 to $44,999 | 66 (2.4%) | 199 (9.8%) |
| $45,000 to $49,999 | 110 (4.0%) | 192 (9.5%) |
| $50,000 to $54,999 | 149 (5.4%) | 64 (3.2%) |
| $55,000 to $64,999 | 447 (16.2%) | 110 (5.4%) |
| $65,000 to $74,999 | 426 (15.4%) | 37 (1.8%) |
| $75,000 to $99,999 | 477 (17.3%) | 289 (14.3%) |
| $100,000+ | 310 (11.2%) | 38 (1.9%) |
| Total | 2,762 (100.0%) | 2,023 (100.0%) |
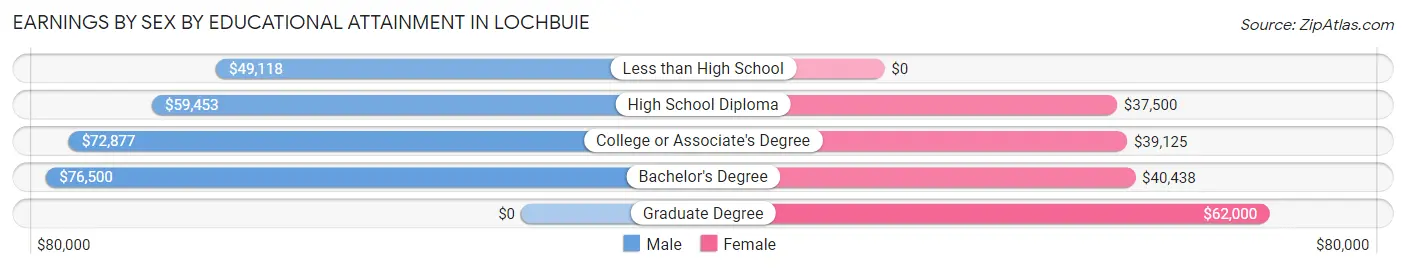
Earnings by Sex by Educational Attainment in Lochbuie
Average earnings in Lochbuie are $64,500 for men and $40,983 for women, a difference of 36.5%. Men with an educational attainment of bachelor's degree enjoy the highest average annual earnings of $76,500, while those with less than high school education earn the least with $49,118. Women with an educational attainment of graduate degree earn the most with the average annual earnings of $62,000, while those with high school diploma education have the smallest earnings of $37,500.
| Educational Attainment | Male Income | Female Income |
| Less than High School | $49,118 | $0 |
| High School Diploma | $59,453 | $37,500 |
| College or Associate's Degree | $72,877 | $39,125 |
| Bachelor's Degree | $76,500 | $40,438 |
| Graduate Degree | - | - |
| Total | $64,500 | $40,983 |
Family Income in Lochbuie
Family Income Brackets in Lochbuie
According to the Lochbuie family income data, there are 840 families falling into the $100,000 to $149,999 income range, which is the most common income bracket and makes up 38.9% of all families.
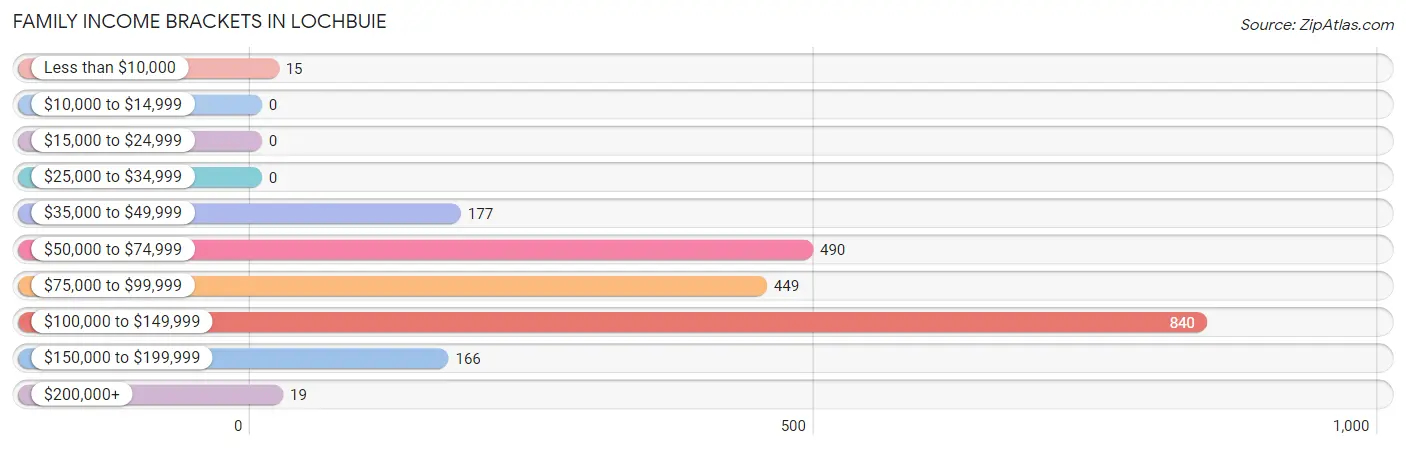
| Income Bracket | # Families | % Families |
| Less than $10,000 | 15 | 0.7% |
| $10,000 to $14,999 | 0 | 0.0% |
| $15,000 to $24,999 | 0 | 0.0% |
| $25,000 to $34,999 | 0 | 0.0% |
| $35,000 to $49,999 | 177 | 8.2% |
| $50,000 to $74,999 | 490 | 22.7% |
| $75,000 to $99,999 | 449 | 20.8% |
| $100,000 to $149,999 | 840 | 38.9% |
| $150,000 to $199,999 | 166 | 7.7% |
| $200,000+ | 19 | 0.9% |
Family Income by Famaliy Size in Lochbuie
3-person families (379 | 17.5%) account for the highest median family income in Lochbuie with $129,083 per family, while 3-person families (379 | 17.5%) have the highest median income of $43,028 per family member.
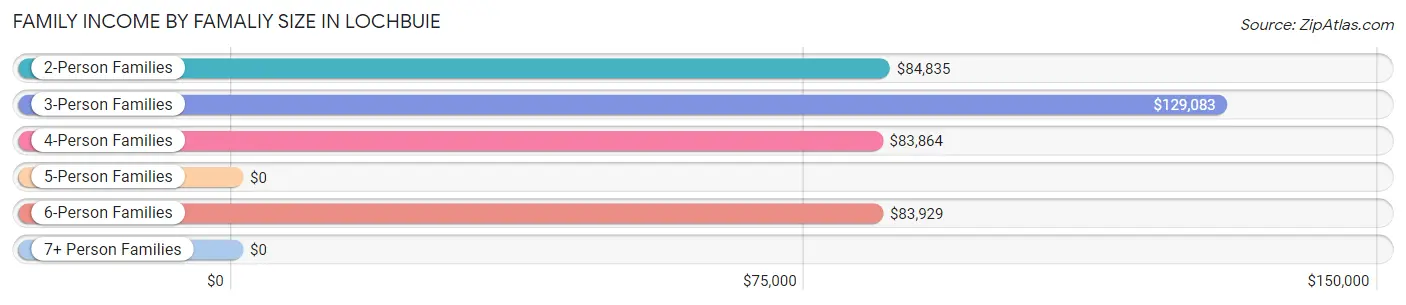
| Income Bracket | # Families | Median Income |
| 2-Person Families | 1,041 (48.2%) | $84,835 |
| 3-Person Families | 379 (17.5%) | $129,083 |
| 4-Person Families | 404 (18.7%) | $83,864 |
| 5-Person Families | 119 (5.5%) | $0 |
| 6-Person Families | 216 (10.0%) | $83,929 |
| 7+ Person Families | 0 (0.0%) | $0 |
| Total | 2,159 (100.0%) | $91,319 |
Family Income by Number of Earners in Lochbuie
The median family income in Lochbuie is $91,319, with families comprising 3+ earners (308) having the highest median family income of $130,187, while families with no earners (197) have the lowest median family income of $66,291, accounting for 14.3% and 9.1% of families, respectively.
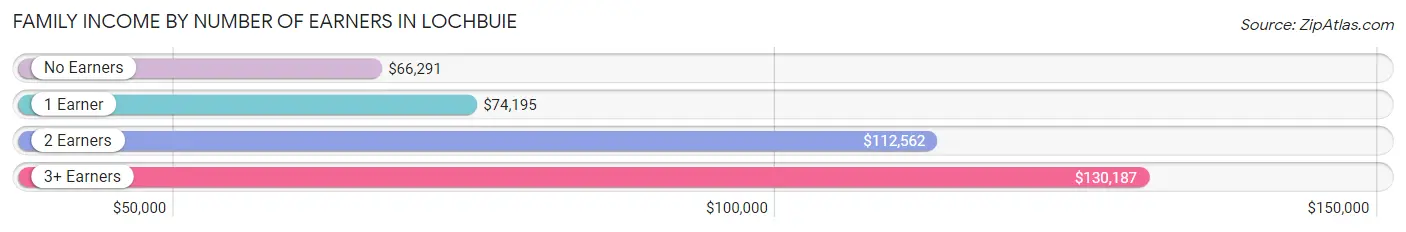
| Number of Earners | # Families | Median Income |
| No Earners | 197 (9.1%) | $66,291 |
| 1 Earner | 454 (21.0%) | $74,195 |
| 2 Earners | 1,200 (55.6%) | $112,562 |
| 3+ Earners | 308 (14.3%) | $130,187 |
| Total | 2,159 (100.0%) | $91,319 |
Household Income in Lochbuie
Household Income Brackets in Lochbuie
With 968 households falling in the category, the $100,000 to $149,999 income range is the most frequent in Lochbuie, accounting for 34.1% of all households.
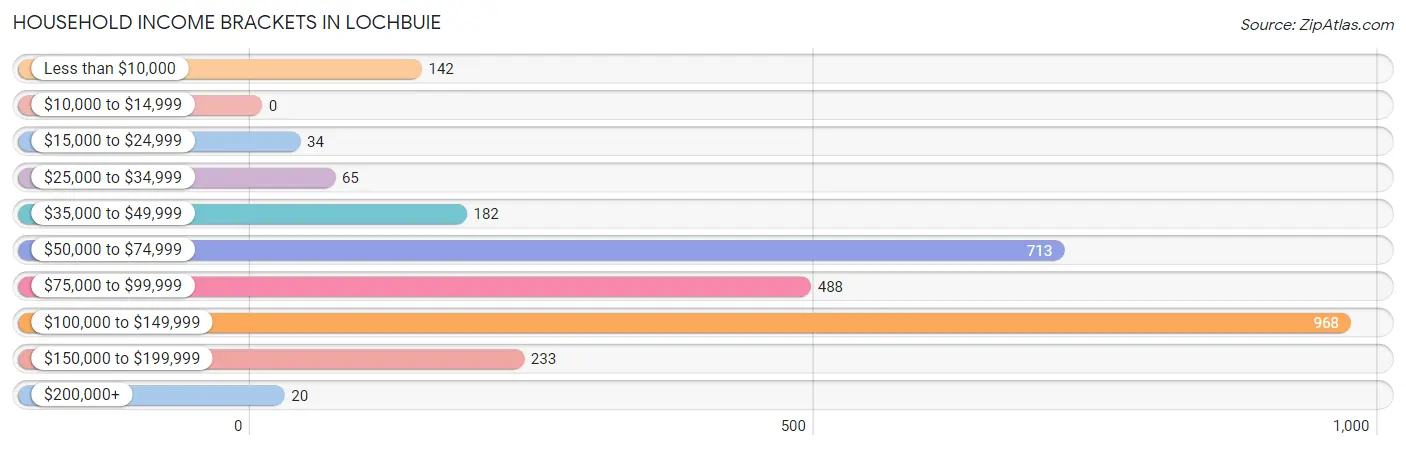
| Income Bracket | # Households | % Households |
| Less than $10,000 | 142 | 5.0% |
| $10,000 to $14,999 | 0 | 0.0% |
| $15,000 to $24,999 | 34 | 1.2% |
| $25,000 to $34,999 | 65 | 2.3% |
| $35,000 to $49,999 | 182 | 6.4% |
| $50,000 to $74,999 | 713 | 25.1% |
| $75,000 to $99,999 | 488 | 17.2% |
| $100,000 to $149,999 | 968 | 34.1% |
| $150,000 to $199,999 | 233 | 8.2% |
| $200,000+ | 20 | 0.7% |
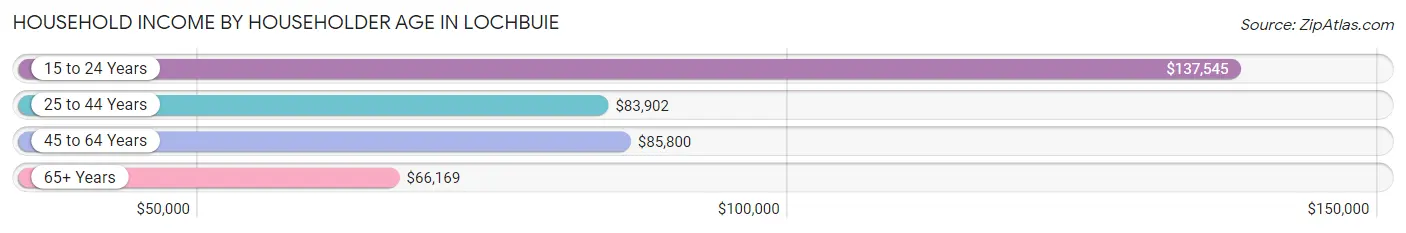
Household Income by Householder Age in Lochbuie
The median household income in Lochbuie is $84,556, with the highest median household income of $137,545 found in the 15 to 24 years age bracket for the primary householder. A total of 108 households (3.8%) fall into this category. Meanwhile, the 65+ years age bracket for the primary householder has the lowest median household income of $66,169, with 623 households (21.9%) in this group.
| Income Bracket | # Households | Median Income |
| 15 to 24 Years | 108 (3.8%) | $137,545 |
| 25 to 44 Years | 1,416 (49.9%) | $83,902 |
| 45 to 64 Years | 692 (24.4%) | $85,800 |
| 65+ Years | 623 (21.9%) | $66,169 |
| Total | 2,839 (100.0%) | $84,556 |
Poverty in Lochbuie
Income Below Poverty by Sex and Age in Lochbuie
With 3.8% poverty level for males and 3.0% for females among the residents of Lochbuie, 55 to 64 year old males and 65 to 74 year old females are the most vulnerable to poverty, with 22 males (7.7%) and 79 females (31.7%) in their respective age groups living below the poverty level.
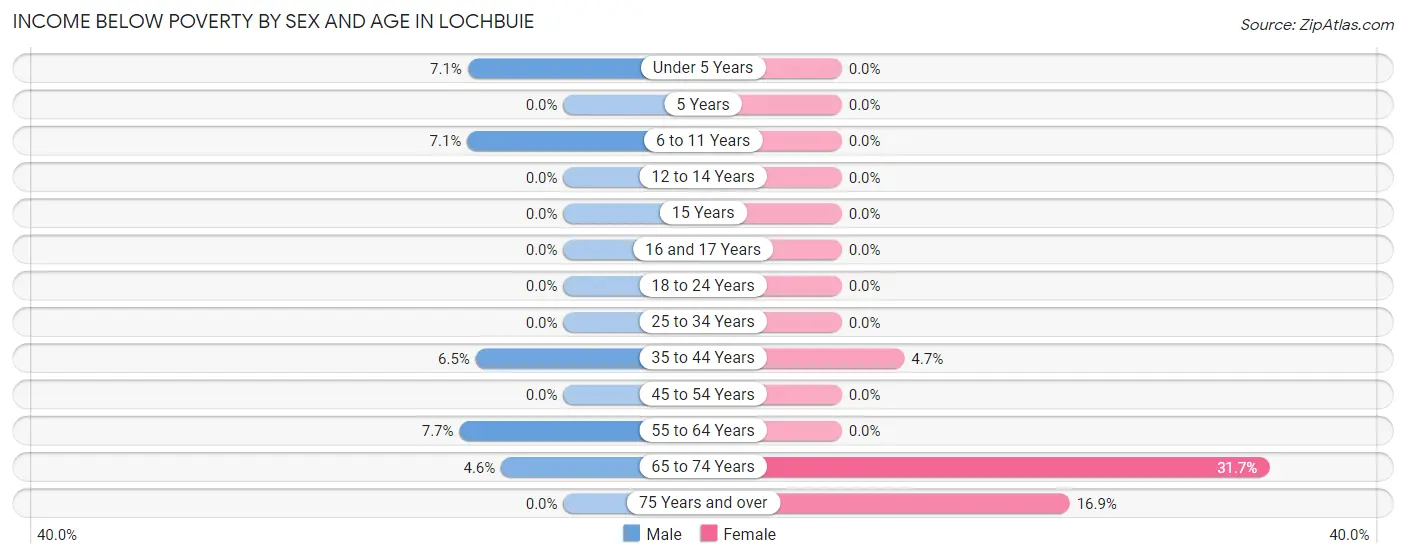
| Age Bracket | Male | Female |
| Under 5 Years | 23 (7.1%) | 0 (0.0%) |
| 5 Years | 0 (0.0%) | 0 (0.0%) |
| 6 to 11 Years | 28 (7.1%) | 0 (0.0%) |
| 12 to 14 Years | 0 (0.0%) | 0 (0.0%) |
| 15 Years | 0 (0.0%) | 0 (0.0%) |
| 16 and 17 Years | 0 (0.0%) | 0 (0.0%) |
| 18 to 24 Years | 0 (0.0%) | 0 (0.0%) |
| 25 to 34 Years | 0 (0.0%) | 0 (0.0%) |
| 35 to 44 Years | 62 (6.5%) | 16 (4.6%) |
| 45 to 54 Years | 0 (0.0%) | 0 (0.0%) |
| 55 to 64 Years | 22 (7.7%) | 0 (0.0%) |
| 65 to 74 Years | 19 (4.6%) | 79 (31.7%) |
| 75 Years and over | 0 (0.0%) | 22 (16.9%) |
| Total | 154 (3.8%) | 117 (3.0%) |
Income Above Poverty by Sex and Age in Lochbuie
According to the poverty statistics in Lochbuie, males aged 5 years and females aged under 5 years are the age groups that are most secure financially, with 100.0% of males and 100.0% of females in these age groups living above the poverty line.
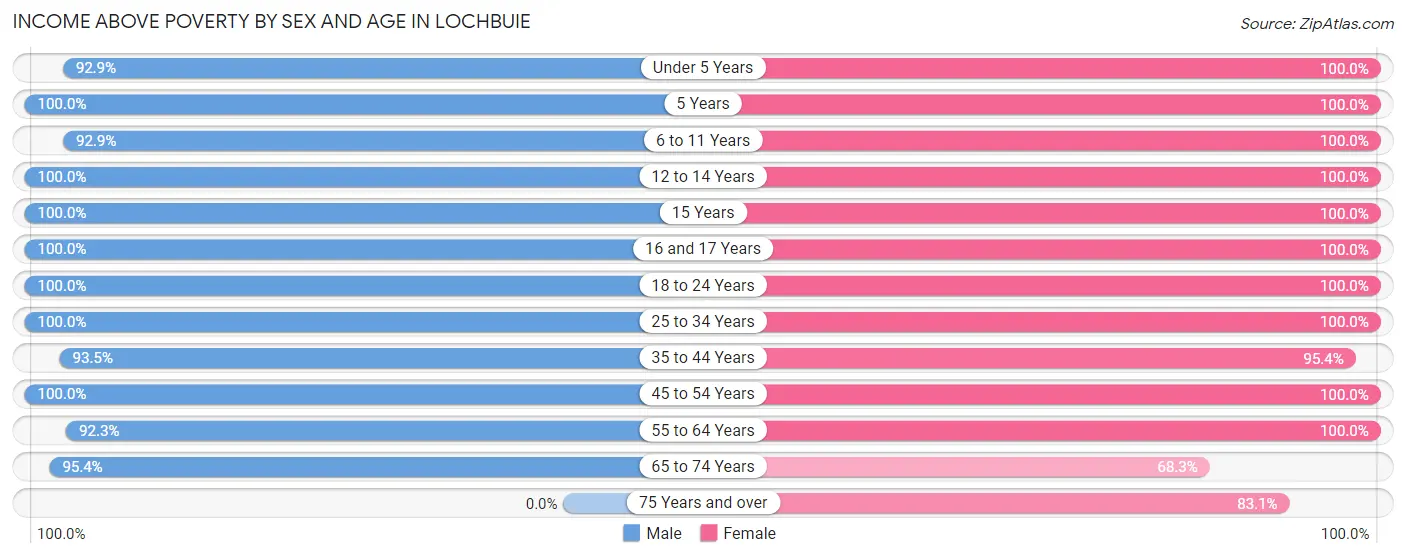
| Age Bracket | Male | Female |
| Under 5 Years | 301 (92.9%) | 365 (100.0%) |
| 5 Years | 24 (100.0%) | 140 (100.0%) |
| 6 to 11 Years | 364 (92.9%) | 409 (100.0%) |
| 12 to 14 Years | 90 (100.0%) | 136 (100.0%) |
| 15 Years | 60 (100.0%) | 94 (100.0%) |
| 16 and 17 Years | 18 (100.0%) | 116 (100.0%) |
| 18 to 24 Years | 364 (100.0%) | 247 (100.0%) |
| 25 to 34 Years | 679 (100.0%) | 746 (100.0%) |
| 35 to 44 Years | 890 (93.5%) | 328 (95.4%) |
| 45 to 54 Years | 409 (100.0%) | 451 (100.0%) |
| 55 to 64 Years | 263 (92.3%) | 512 (100.0%) |
| 65 to 74 Years | 392 (95.4%) | 170 (68.3%) |
| 75 Years and over | 0 (0.0%) | 108 (83.1%) |
| Total | 3,854 (96.2%) | 3,822 (97.0%) |
Income Below Poverty Among Married-Couple Families in Lochbuie
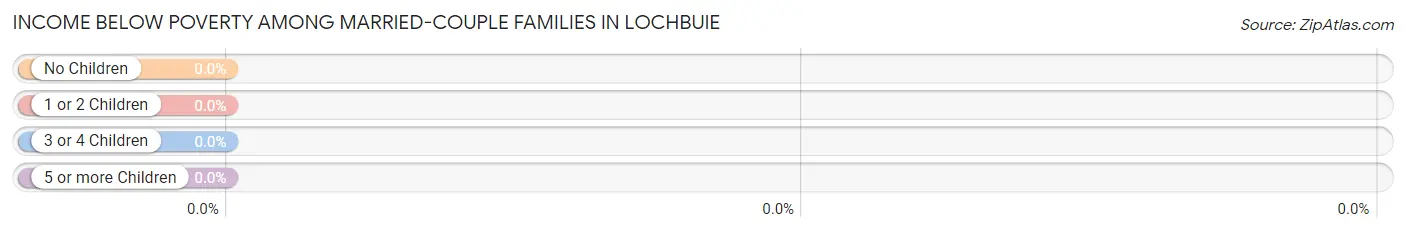
| Children | Above Poverty | Below Poverty |
| No Children | 860 (100.0%) | 0 (0.0%) |
| 1 or 2 Children | 721 (100.0%) | 0 (0.0%) |
| 3 or 4 Children | 209 (100.0%) | 0 (0.0%) |
| 5 or more Children | 0 (0.0%) | 0 (0.0%) |
| Total | 1,790 (100.0%) | 0 (0.0%) |
Income Below Poverty Among Single-Parent Households in Lochbuie
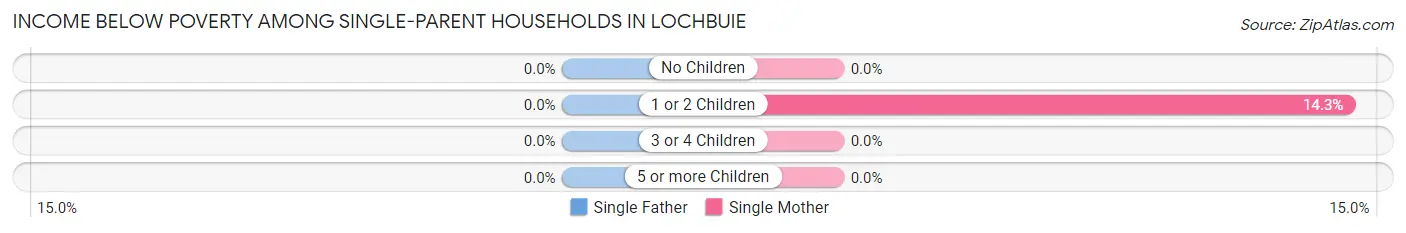
| Children | Single Father | Single Mother |
| No Children | 0 (0.0%) | 0 (0.0%) |
| 1 or 2 Children | 0 (0.0%) | 16 (14.3%) |
| 3 or 4 Children | 0 (0.0%) | 0 (0.0%) |
| 5 or more Children | 0 (0.0%) | 0 (0.0%) |
| Total | 0 (0.0%) | 16 (6.3%) |
Income Below Poverty Among Married-Couple vs Single-Parent Households in Lochbuie
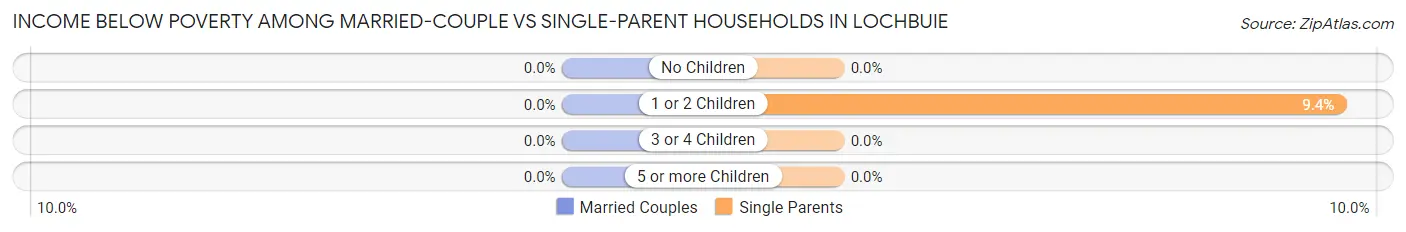
| Children | Married-Couple Families | Single-Parent Households |
| No Children | 0 (0.0%) | 0 (0.0%) |
| 1 or 2 Children | 0 (0.0%) | 16 (9.4%) |
| 3 or 4 Children | 0 (0.0%) | 0 (0.0%) |
| 5 or more Children | 0 (0.0%) | 0 (0.0%) |
| Total | 0 (0.0%) | 16 (4.3%) |
Race in Lochbuie
The most populous races in Lochbuie are White / Caucasian (6,063 | 76.1%), Hispanic or Latino (4,404 | 55.3%), and Some other Race (1,003 | 12.6%).
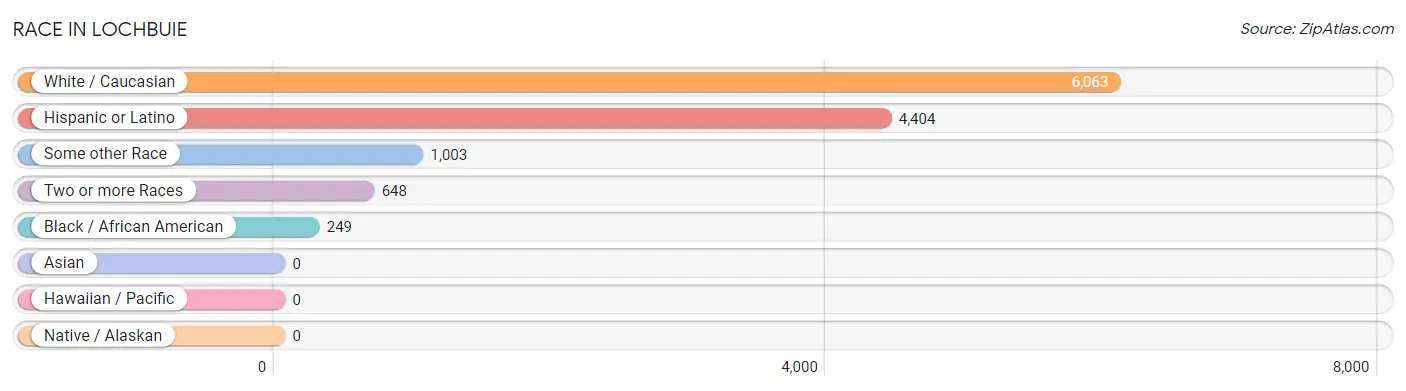
| Race | # Population | % Population |
| Asian | 0 | 0.0% |
| Black / African American | 249 | 3.1% |
| Hawaiian / Pacific | 0 | 0.0% |
| Hispanic or Latino | 4,404 | 55.3% |
| Native / Alaskan | 0 | 0.0% |
| White / Caucasian | 6,063 | 76.1% |
| Two or more Races | 648 | 8.1% |
| Some other Race | 1,003 | 12.6% |
| Total | 7,963 | 100.0% |
Ancestry in Lochbuie
The most populous ancestries reported in Lochbuie are Mexican (3,901 | 49.0%), German (770 | 9.7%), Irish (753 | 9.5%), English (572 | 7.2%), and American (353 | 4.4%), together accounting for 79.7% of all Lochbuie residents.
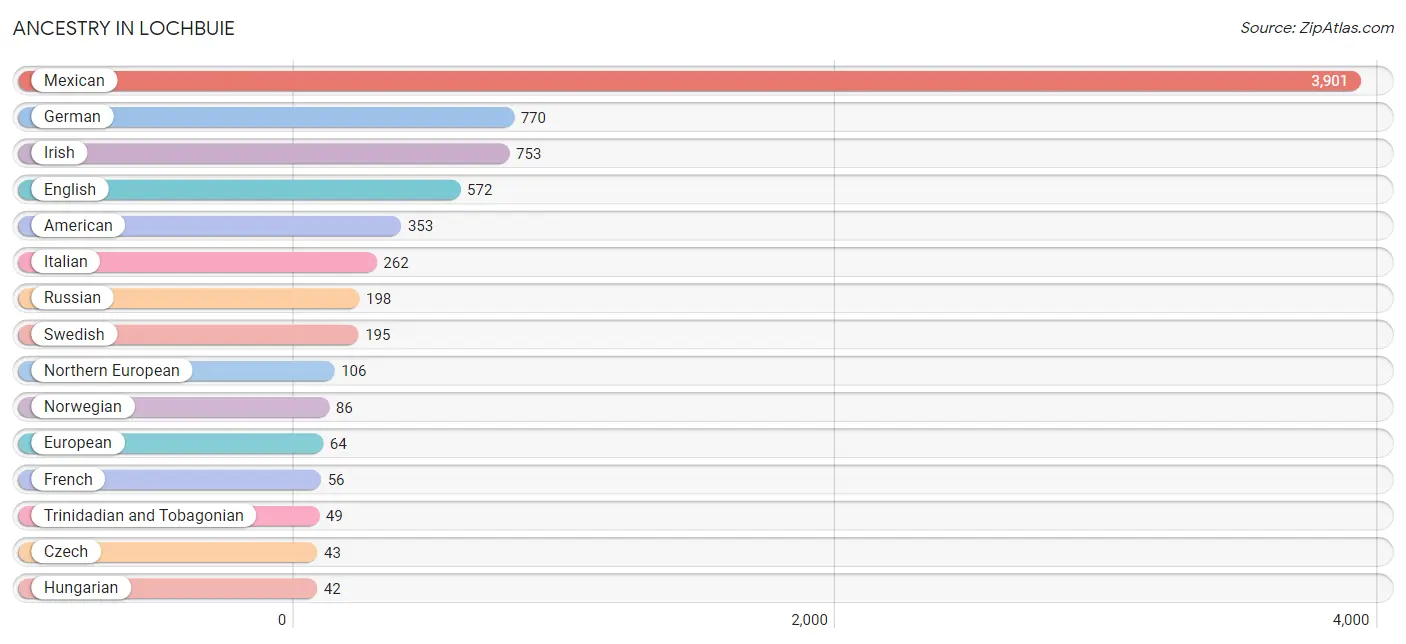
| Ancestry | # Population | % Population |
| American | 353 | 4.4% |
| Armenian | 20 | 0.3% |
| British | 35 | 0.4% |
| Czech | 43 | 0.5% |
| Danish | 41 | 0.5% |
| Dutch | 38 | 0.5% |
| Eastern European | 17 | 0.2% |
| English | 572 | 7.2% |
| European | 64 | 0.8% |
| French | 56 | 0.7% |
| German | 770 | 9.7% |
| Hungarian | 42 | 0.5% |
| Irish | 753 | 9.5% |
| Italian | 262 | 3.3% |
| Mexican | 3,901 | 49.0% |
| Northern European | 106 | 1.3% |
| Norwegian | 86 | 1.1% |
| Polish | 20 | 0.3% |
| Russian | 198 | 2.5% |
| Scotch-Irish | 20 | 0.3% |
| Scottish | 39 | 0.5% |
| Spanish | 33 | 0.4% |
| Swedish | 195 | 2.5% |
| Trinidadian and Tobagonian | 49 | 0.6% |
| Yugoslavian | 17 | 0.2% | View All 25 Rows |
Immigrants in Lochbuie
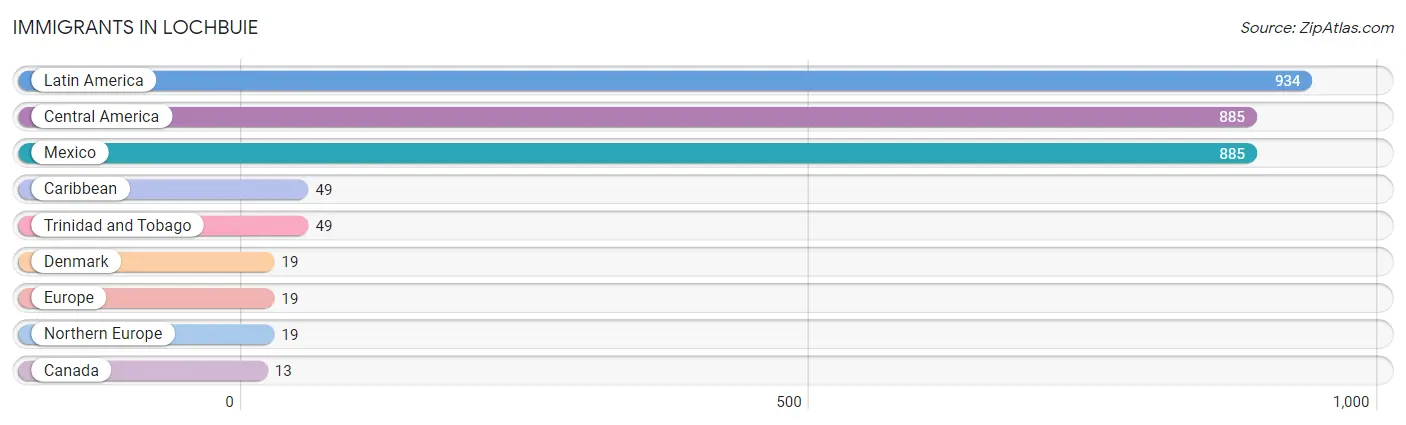
The most numerous immigrant groups reported in Lochbuie came from Latin America (934 | 11.7%), Central America (885 | 11.1%), Mexico (885 | 11.1%), Caribbean (49 | 0.6%), and Trinidad and Tobago (49 | 0.6%), together accounting for 35.2% of all Lochbuie residents.
| Immigration Origin | # Population | % Population |
| Canada | 13 | 0.2% |
| Caribbean | 49 | 0.6% |
| Central America | 885 | 11.1% |
| Denmark | 19 | 0.2% |
| Europe | 19 | 0.2% |
| Latin America | 934 | 11.7% |
| Mexico | 885 | 11.1% |
| Northern Europe | 19 | 0.2% |
| Trinidad and Tobago | 49 | 0.6% | View All 9 Rows |
Sex and Age in Lochbuie
Sex and Age in Lochbuie
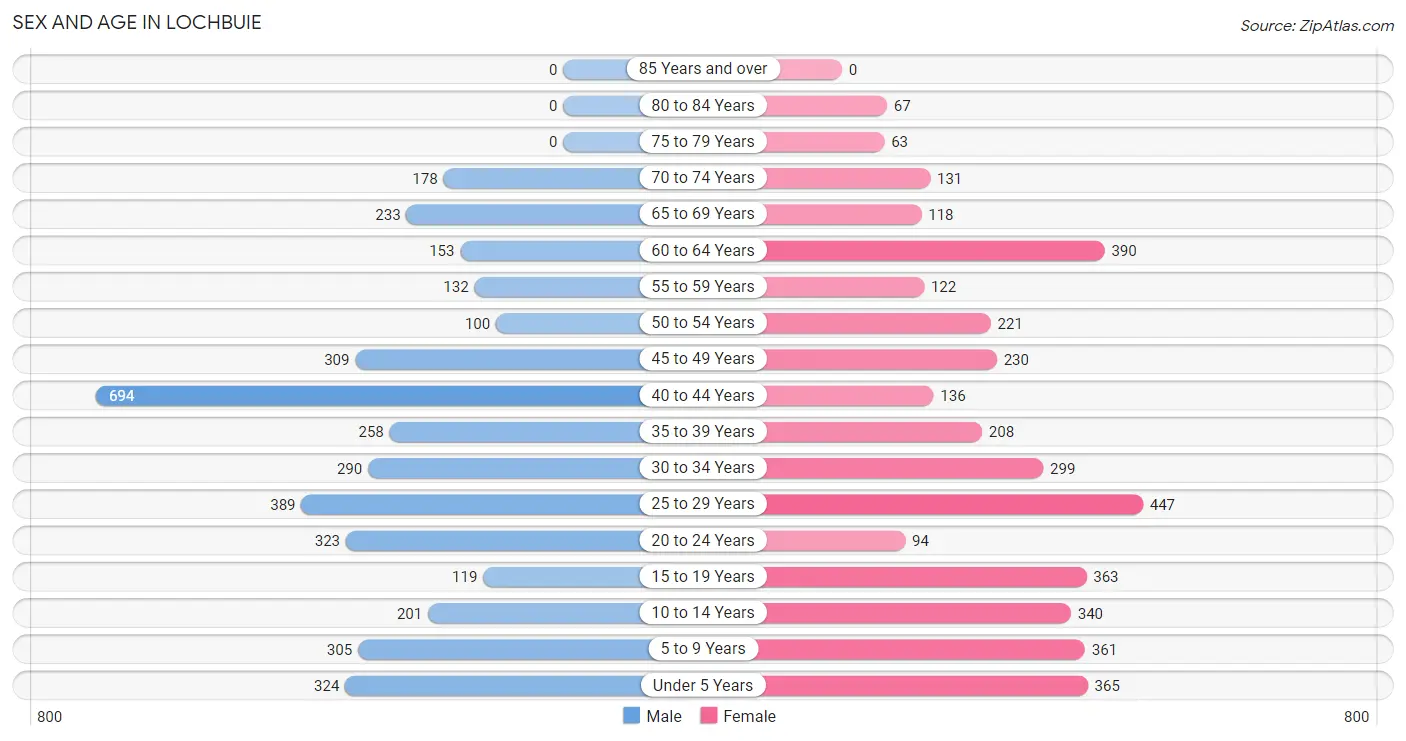
The most populous age groups in Lochbuie are 40 to 44 Years (694 | 17.3%) for men and 25 to 29 Years (447 | 11.3%) for women.
| Age Bracket | Male | Female |
| Under 5 Years | 324 (8.1%) | 365 (9.2%) |
| 5 to 9 Years | 305 (7.6%) | 361 (9.1%) |
| 10 to 14 Years | 201 (5.0%) | 340 (8.6%) |
| 15 to 19 Years | 119 (3.0%) | 363 (9.2%) |
| 20 to 24 Years | 323 (8.1%) | 94 (2.4%) |
| 25 to 29 Years | 389 (9.7%) | 447 (11.3%) |
| 30 to 34 Years | 290 (7.2%) | 299 (7.6%) |
| 35 to 39 Years | 258 (6.4%) | 208 (5.3%) |
| 40 to 44 Years | 694 (17.3%) | 136 (3.4%) |
| 45 to 49 Years | 309 (7.7%) | 230 (5.8%) |
| 50 to 54 Years | 100 (2.5%) | 221 (5.6%) |
| 55 to 59 Years | 132 (3.3%) | 122 (3.1%) |
| 60 to 64 Years | 153 (3.8%) | 390 (9.9%) |
| 65 to 69 Years | 233 (5.8%) | 118 (3.0%) |
| 70 to 74 Years | 178 (4.4%) | 131 (3.3%) |
| 75 to 79 Years | 0 (0.0%) | 63 (1.6%) |
| 80 to 84 Years | 0 (0.0%) | 67 (1.7%) |
| 85 Years and over | 0 (0.0%) | 0 (0.0%) |
| Total | 4,008 (100.0%) | 3,955 (100.0%) |
Families and Households in Lochbuie
Median Family Size in Lochbuie
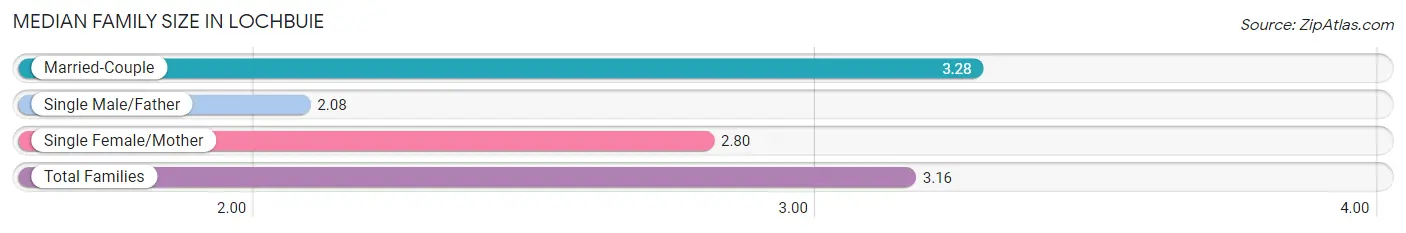
The median family size in Lochbuie is 3.16 persons per family, with married-couple families (1,790 | 82.9%) accounting for the largest median family size of 3.28 persons per family. On the other hand, single male/father families (114 | 5.3%) represent the smallest median family size with 2.08 persons per family.
| Family Type | # Families | Family Size |
| Married-Couple | 1,790 (82.9%) | 3.28 |
| Single Male/Father | 114 (5.3%) | 2.08 |
| Single Female/Mother | 255 (11.8%) | 2.80 |
| Total Families | 2,159 (100.0%) | 3.16 |
Median Household Size in Lochbuie
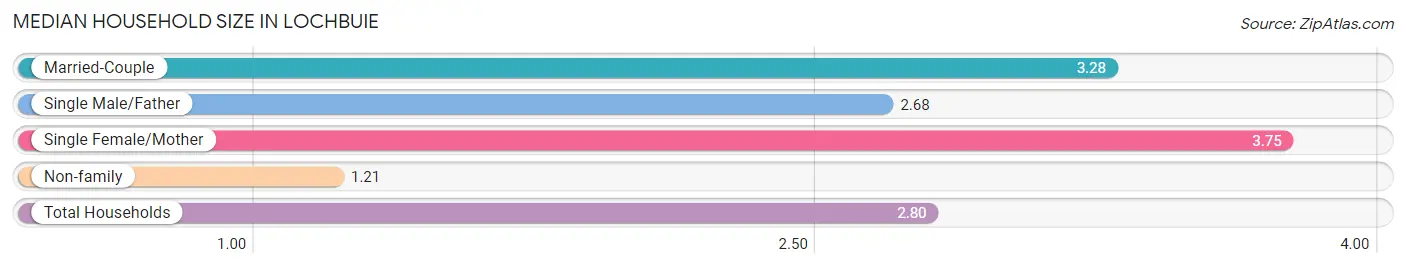
The median household size in Lochbuie is 2.80 persons per household, with single female/mother households (255 | 9.0%) accounting for the largest median household size of 3.75 persons per household. non-family households (680 | 23.9%) represent the smallest median household size with 1.21 persons per household.
| Household Type | # Households | Household Size |
| Married-Couple | 1,790 (63.0%) | 3.28 |
| Single Male/Father | 114 (4.0%) | 2.68 |
| Single Female/Mother | 255 (9.0%) | 3.75 |
| Non-family | 680 (23.9%) | 1.21 |
| Total Households | 2,839 (100.0%) | 2.80 |
Household Size by Marriage Status in Lochbuie
Out of a total of 2,839 households in Lochbuie, 2,159 (76.0%) are family households, while 680 (23.9%) are nonfamily households. The most numerous type of family households are 2-person households, comprising 919, and the most common type of nonfamily households are 1-person households, comprising 547.
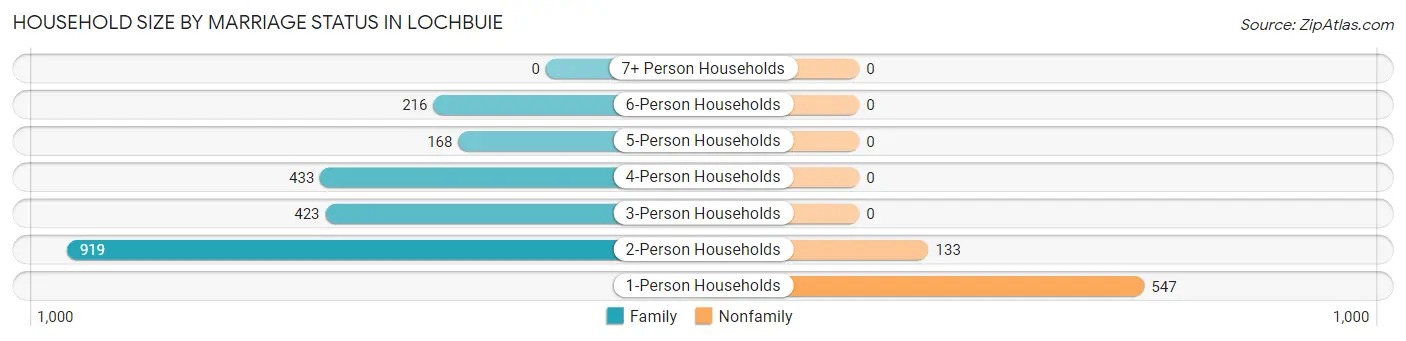
| Household Size | Family Households | Nonfamily Households |
| 1-Person Households | - | 547 (19.3%) |
| 2-Person Households | 919 (32.4%) | 133 (4.7%) |
| 3-Person Households | 423 (14.9%) | 0 (0.0%) |
| 4-Person Households | 433 (15.2%) | 0 (0.0%) |
| 5-Person Households | 168 (5.9%) | 0 (0.0%) |
| 6-Person Households | 216 (7.6%) | 0 (0.0%) |
| 7+ Person Households | 0 (0.0%) | 0 (0.0%) |
| Total | 2,159 (76.0%) | 680 (23.9%) |
Female Fertility in Lochbuie
Fertility by Age in Lochbuie
Average fertility rate in Lochbuie is 150.0 births per 1,000 women. Women in the age bracket of 20 to 34 years have the highest fertility rate with 321.0 births per 1,000 women. Women in the age bracket of 20 to 34 years acount for 100.0% of all women with births.
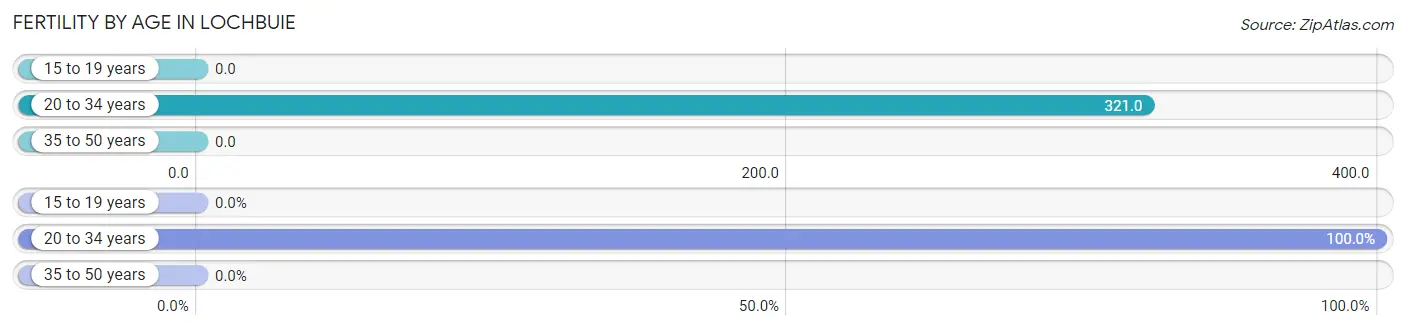
| Age Bracket | Women with Births | Births / 1,000 Women |
| 15 to 19 years | 0 (0.0%) | 0.0 |
| 20 to 34 years | 270 (100.0%) | 321.0 |
| 35 to 50 years | 0 (0.0%) | 0.0 |
| Total | 270 (100.0%) | 150.0 |
Fertility by Age by Marriage Status in Lochbuie
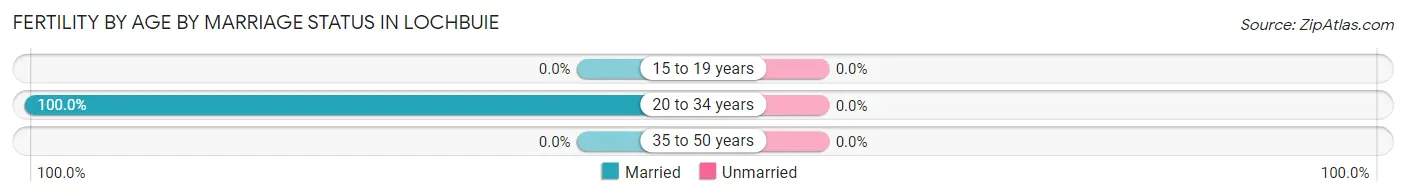
| Age Bracket | Married | Unmarried |
| 15 to 19 years | 0 (0.0%) | 0 (0.0%) |
| 20 to 34 years | 270 (100.0%) | 0 (0.0%) |
| 35 to 50 years | 0 (0.0%) | 0 (0.0%) |
| Total | 270 (100.0%) | 0 (0.0%) |
Fertility by Education in Lochbuie
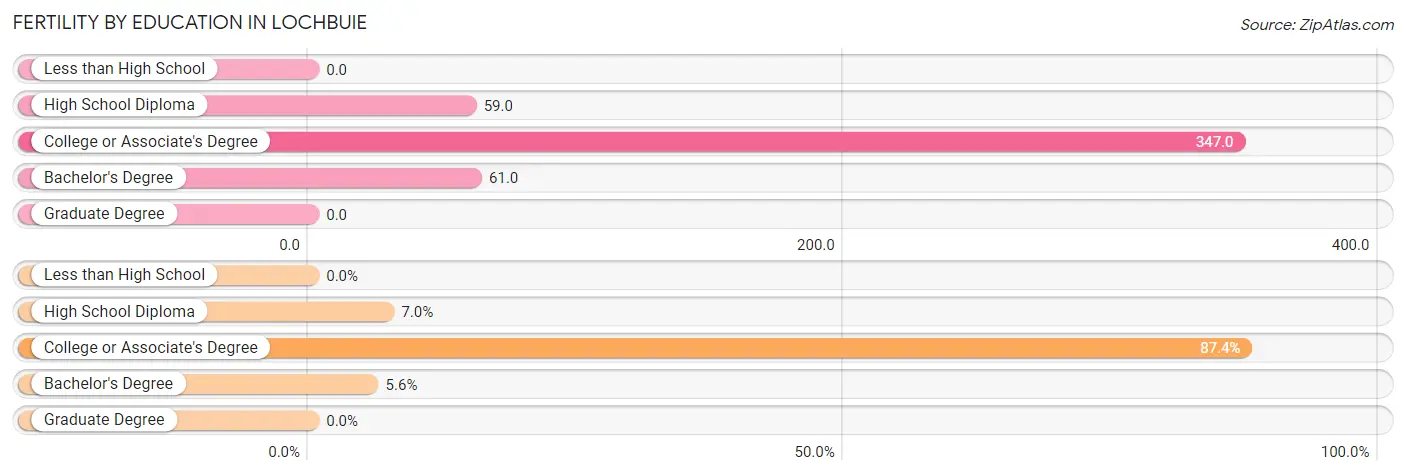
| Educational Attainment | Women with Births | Births / 1,000 Women |
| Less than High School | 0 (0.0%) | 0.0 |
| High School Diploma | 19 (7.0%) | 59.0 |
| College or Associate's Degree | 236 (87.4%) | 347.0 |
| Bachelor's Degree | 15 (5.6%) | 61.0 |
| Graduate Degree | 0 (0.0%) | 0.0 |
| Total | 270 (100.0%) | 150.0 |
Fertility by Education by Marriage Status in Lochbuie
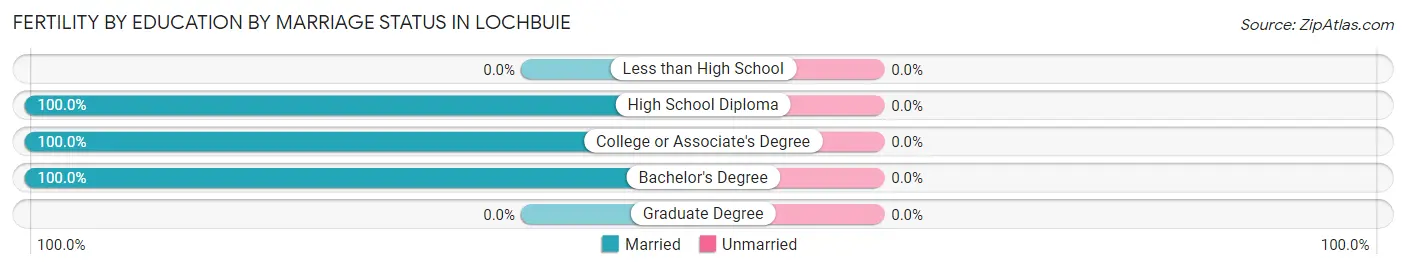
| Educational Attainment | Married | Unmarried |
| Less than High School | 0 (0.0%) | 0 (0.0%) |
| High School Diploma | 19 (100.0%) | 0 (0.0%) |
| College or Associate's Degree | 236 (100.0%) | 0 (0.0%) |
| Bachelor's Degree | 15 (100.0%) | 0 (0.0%) |
| Graduate Degree | 0 (0.0%) | 0 (0.0%) |
| Total | 270 (100.0%) | 0 (0.0%) |
Employment Characteristics in Lochbuie
Employment by Class of Employer in Lochbuie
Among the 4,257 employed individuals in Lochbuie, private company employees (3,547 | 83.3%), self-employed (incorporated) (179 | 4.2%), and local government employees (163 | 3.8%) make up the most common classes of employment.
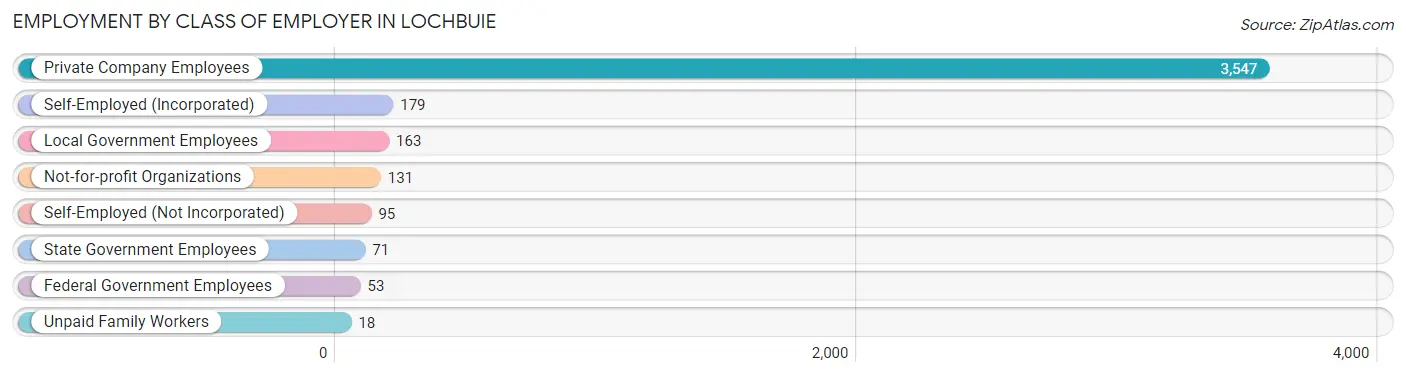
| Employer Class | # Employees | % Employees |
| Private Company Employees | 3,547 | 83.3% |
| Self-Employed (Incorporated) | 179 | 4.2% |
| Self-Employed (Not Incorporated) | 95 | 2.2% |
| Not-for-profit Organizations | 131 | 3.1% |
| Local Government Employees | 163 | 3.8% |
| State Government Employees | 71 | 1.7% |
| Federal Government Employees | 53 | 1.3% |
| Unpaid Family Workers | 18 | 0.4% |
| Total | 4,257 | 100.0% |
Employment Status by Age in Lochbuie
According to the labor force statistics for Lochbuie, out of the total population over 16 years of age (5,913), 75.0% or 4,435 individuals are in the labor force, with 2.3% or 102 of them unemployed. The age group with the highest labor force participation rate is 20 to 24 years, with 100.0% or 417 individuals in the labor force. Within the labor force, the 55 to 59 years age range has the highest percentage of unemployed individuals, with 15.4% or 26 of them being unemployed.
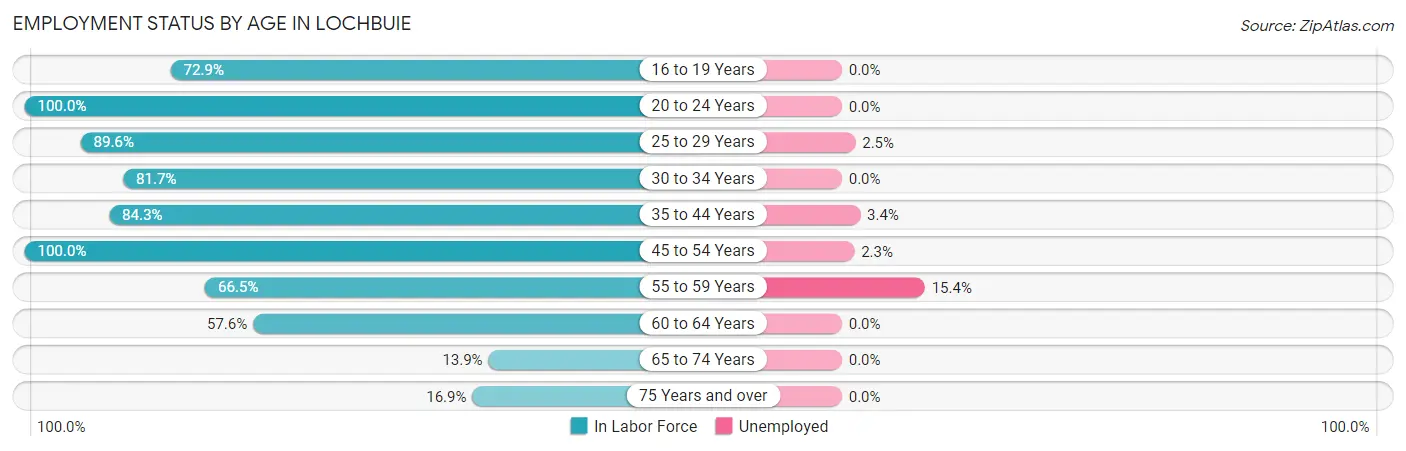
| Age Bracket | In Labor Force | Unemployed |
| 16 to 19 Years | 239 (72.9%) | 0 (0.0%) |
| 20 to 24 Years | 417 (100.0%) | 0 (0.0%) |
| 25 to 29 Years | 749 (89.6%) | 19 (2.5%) |
| 30 to 34 Years | 481 (81.7%) | 0 (0.0%) |
| 35 to 44 Years | 1,093 (84.3%) | 37 (3.4%) |
| 45 to 54 Years | 860 (100.0%) | 20 (2.3%) |
| 55 to 59 Years | 169 (66.5%) | 26 (15.4%) |
| 60 to 64 Years | 313 (57.6%) | 0 (0.0%) |
| 65 to 74 Years | 92 (13.9%) | 0 (0.0%) |
| 75 Years and over | 22 (16.9%) | 0 (0.0%) |
| Total | 4,435 (75.0%) | 102 (2.3%) |
Employment Status by Educational Attainment in Lochbuie
According to labor force statistics for Lochbuie, 83.7% of individuals (3,664) out of the total population between 25 and 64 years of age (4,378) are in the labor force, with 2.8% or 103 of them being unemployed. The group with the highest labor force participation rate are those with the educational attainment of bachelor's degree or higher, with 94.6% or 647 individuals in the labor force. Within the labor force, individuals with bachelor's degree or higher education have the highest percentage of unemployment, with 6.0% or 39 of them being unemployed.
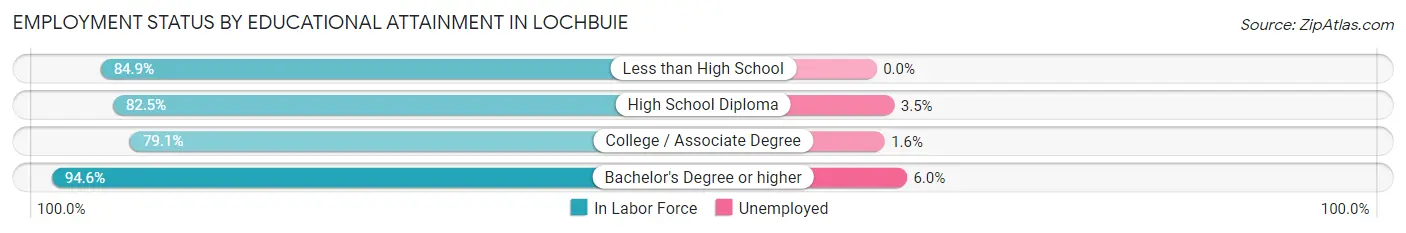
| Educational Attainment | In Labor Force | Unemployed |
| Less than High School | 607 (84.9%) | 0 (0.0%) |
| High School Diploma | 1,291 (82.5%) | 55 (3.5%) |
| College / Associate Degree | 1,118 (79.1%) | 23 (1.6%) |
| Bachelor's Degree or higher | 647 (94.6%) | 41 (6.0%) |
| Total | 3,664 (83.7%) | 123 (2.8%) |
Employment Occupations by Sex in Lochbuie
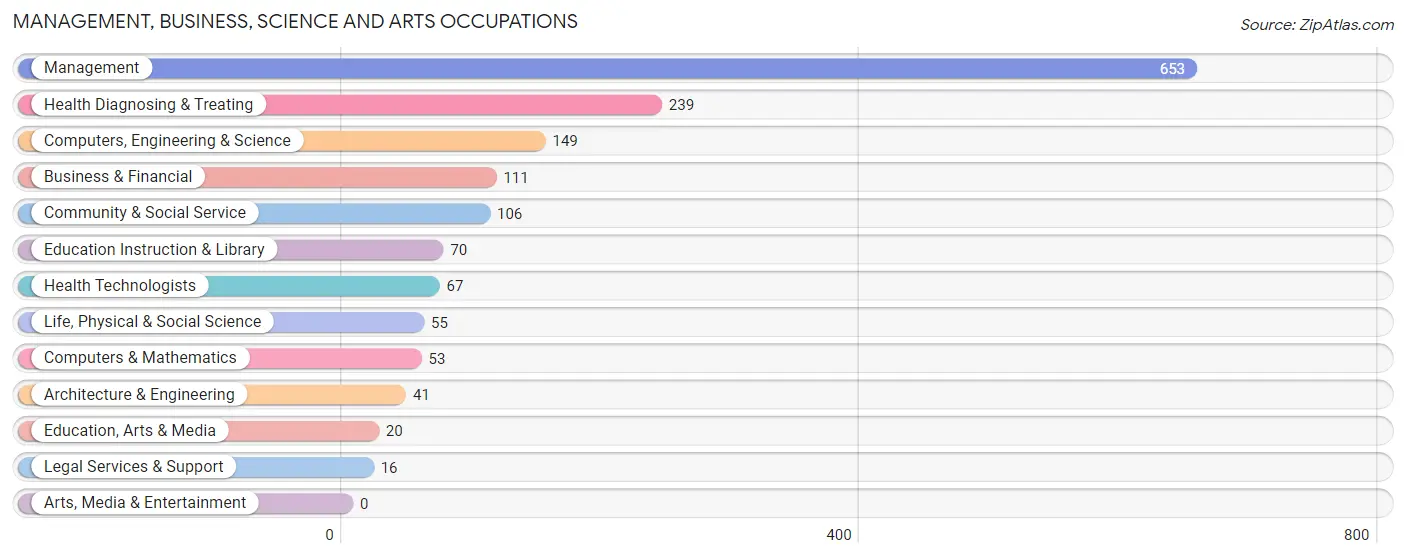
Management, Business, Science and Arts Occupations
The most common Management, Business, Science and Arts occupations in Lochbuie are Management (653 | 15.1%), Health Diagnosing & Treating (239 | 5.5%), Computers, Engineering & Science (149 | 3.4%), Business & Financial (111 | 2.6%), and Community & Social Service (106 | 2.5%).
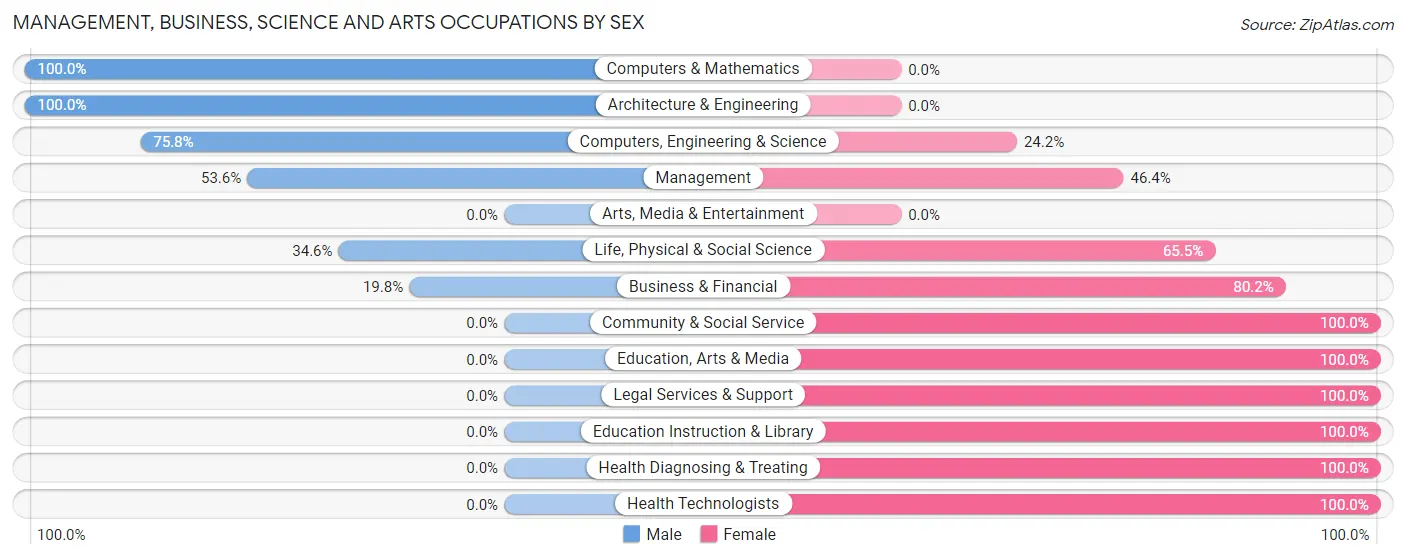
Management, Business, Science and Arts Occupations by Sex
Within the Management, Business, Science and Arts occupations in Lochbuie, the most male-oriented occupations are Computers & Mathematics (100.0%), Architecture & Engineering (100.0%), and Computers, Engineering & Science (75.8%), while the most female-oriented occupations are Community & Social Service (100.0%), Education, Arts & Media (100.0%), and Legal Services & Support (100.0%).
| Occupation | Male | Female |
| Management | 350 (53.6%) | 303 (46.4%) |
| Business & Financial | 22 (19.8%) | 89 (80.2%) |
| Computers, Engineering & Science | 113 (75.8%) | 36 (24.2%) |
| Computers & Mathematics | 53 (100.0%) | 0 (0.0%) |
| Architecture & Engineering | 41 (100.0%) | 0 (0.0%) |
| Life, Physical & Social Science | 19 (34.5%) | 36 (65.4%) |
| Community & Social Service | 0 (0.0%) | 106 (100.0%) |
| Education, Arts & Media | 0 (0.0%) | 20 (100.0%) |
| Legal Services & Support | 0 (0.0%) | 16 (100.0%) |
| Education Instruction & Library | 0 (0.0%) | 70 (100.0%) |
| Arts, Media & Entertainment | 0 (0.0%) | 0 (0.0%) |
| Health Diagnosing & Treating | 0 (0.0%) | 239 (100.0%) |
| Health Technologists | 0 (0.0%) | 67 (100.0%) |
| Total (Category) | 485 (38.6%) | 773 (61.5%) |
| Total (Overall) | 2,519 (58.2%) | 1,813 (41.8%) |
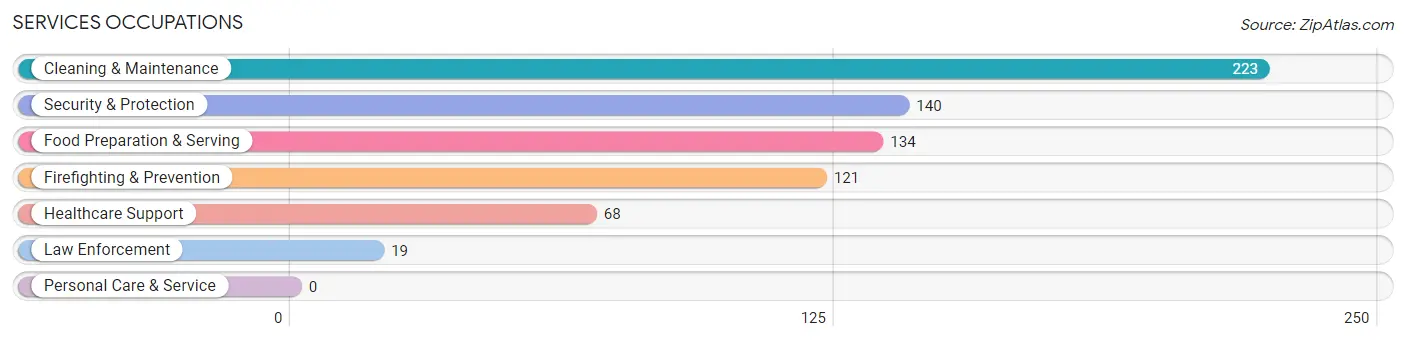
Services Occupations
The most common Services occupations in Lochbuie are Cleaning & Maintenance (223 | 5.1%), Security & Protection (140 | 3.2%), Food Preparation & Serving (134 | 3.1%), Firefighting & Prevention (121 | 2.8%), and Healthcare Support (68 | 1.6%).
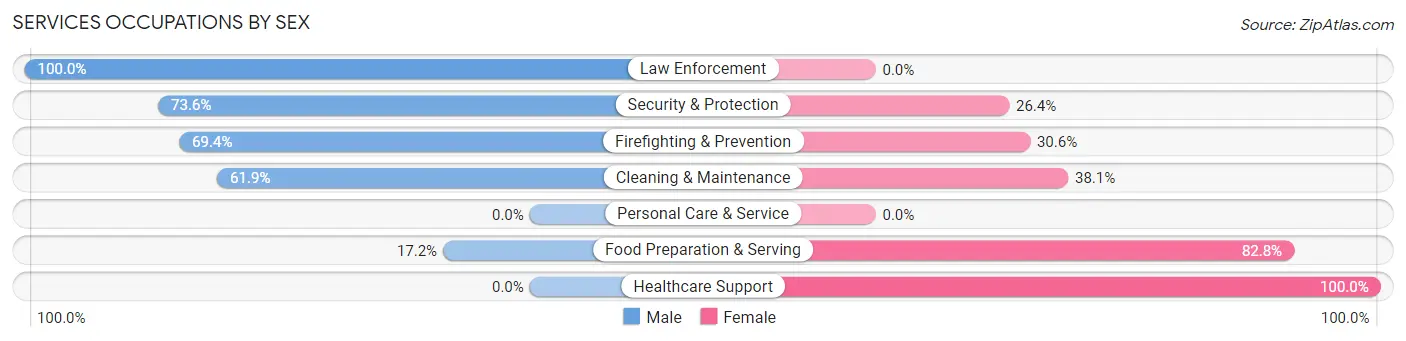
Services Occupations by Sex
Within the Services occupations in Lochbuie, the most male-oriented occupations are Law Enforcement (100.0%), Security & Protection (73.6%), and Firefighting & Prevention (69.4%), while the most female-oriented occupations are Healthcare Support (100.0%), Food Preparation & Serving (82.8%), and Cleaning & Maintenance (38.1%).
| Occupation | Male | Female |
| Healthcare Support | 0 (0.0%) | 68 (100.0%) |
| Security & Protection | 103 (73.6%) | 37 (26.4%) |
| Firefighting & Prevention | 84 (69.4%) | 37 (30.6%) |
| Law Enforcement | 19 (100.0%) | 0 (0.0%) |
| Food Preparation & Serving | 23 (17.2%) | 111 (82.8%) |
| Cleaning & Maintenance | 138 (61.9%) | 85 (38.1%) |
| Personal Care & Service | 0 (0.0%) | 0 (0.0%) |
| Total (Category) | 264 (46.7%) | 301 (53.3%) |
| Total (Overall) | 2,519 (58.2%) | 1,813 (41.8%) |
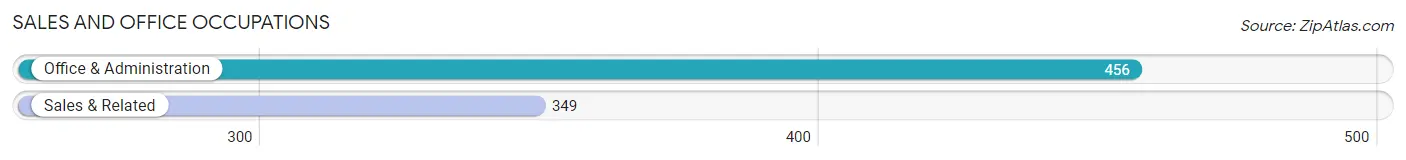
Sales and Office Occupations
The most common Sales and Office occupations in Lochbuie are Office & Administration (456 | 10.5%), and Sales & Related (349 | 8.1%).
Sales and Office Occupations by Sex
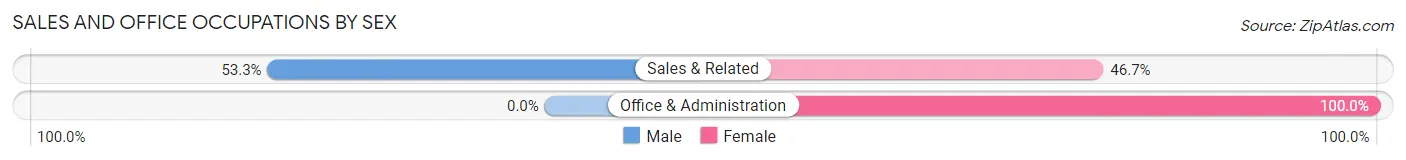
| Occupation | Male | Female |
| Sales & Related | 186 (53.3%) | 163 (46.7%) |
| Office & Administration | 0 (0.0%) | 456 (100.0%) |
| Total (Category) | 186 (23.1%) | 619 (76.9%) |
| Total (Overall) | 2,519 (58.2%) | 1,813 (41.8%) |
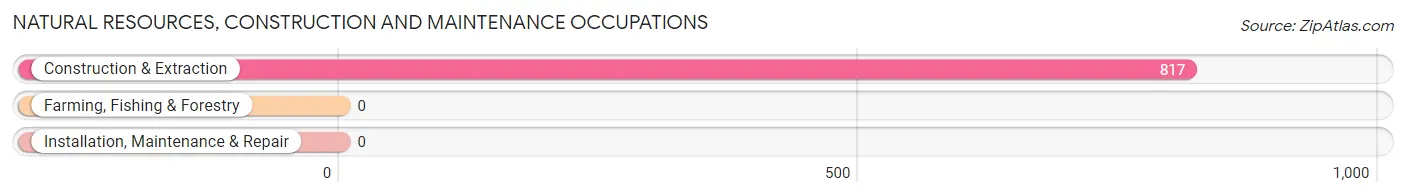
Natural Resources, Construction and Maintenance Occupations
The most common Natural Resources, Construction and Maintenance occupations in Lochbuie are , and Construction & Extraction (817 | 18.9%).
Natural Resources, Construction and Maintenance Occupations by Sex
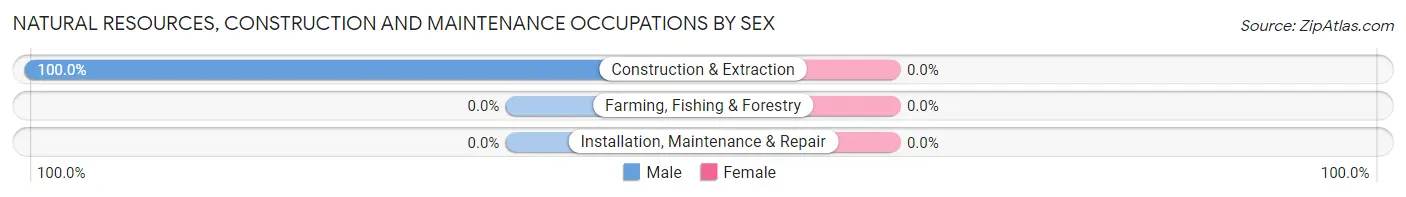
| Occupation | Male | Female |
| Farming, Fishing & Forestry | 0 (0.0%) | 0 (0.0%) |
| Construction & Extraction | 817 (100.0%) | 0 (0.0%) |
| Installation, Maintenance & Repair | 0 (0.0%) | 0 (0.0%) |
| Total (Category) | 817 (100.0%) | 0 (0.0%) |
| Total (Overall) | 2,519 (58.2%) | 1,813 (41.8%) |
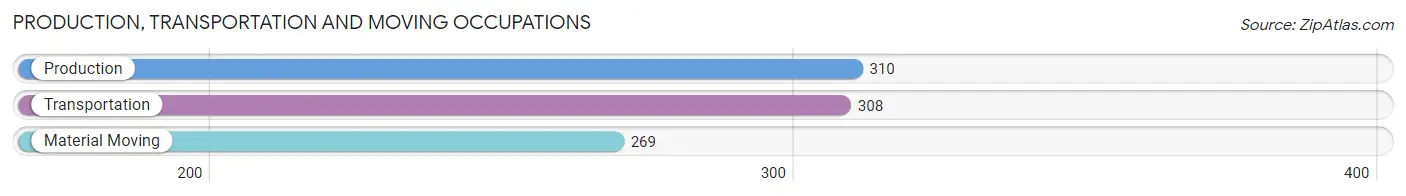
Production, Transportation and Moving Occupations
The most common Production, Transportation and Moving occupations in Lochbuie are Production (310 | 7.2%), Transportation (308 | 7.1%), and Material Moving (269 | 6.2%).
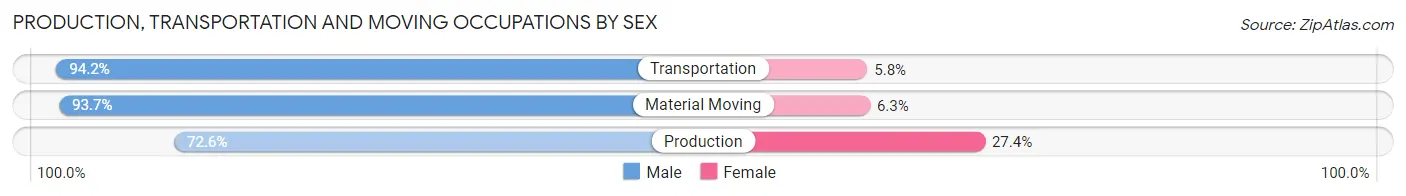
Production, Transportation and Moving Occupations by Sex
| Occupation | Male | Female |
| Production | 225 (72.6%) | 85 (27.4%) |
| Transportation | 290 (94.2%) | 18 (5.8%) |
| Material Moving | 252 (93.7%) | 17 (6.3%) |
| Total (Category) | 767 (86.5%) | 120 (13.5%) |
| Total (Overall) | 2,519 (58.2%) | 1,813 (41.8%) |
Employment Industries by Sex in Lochbuie
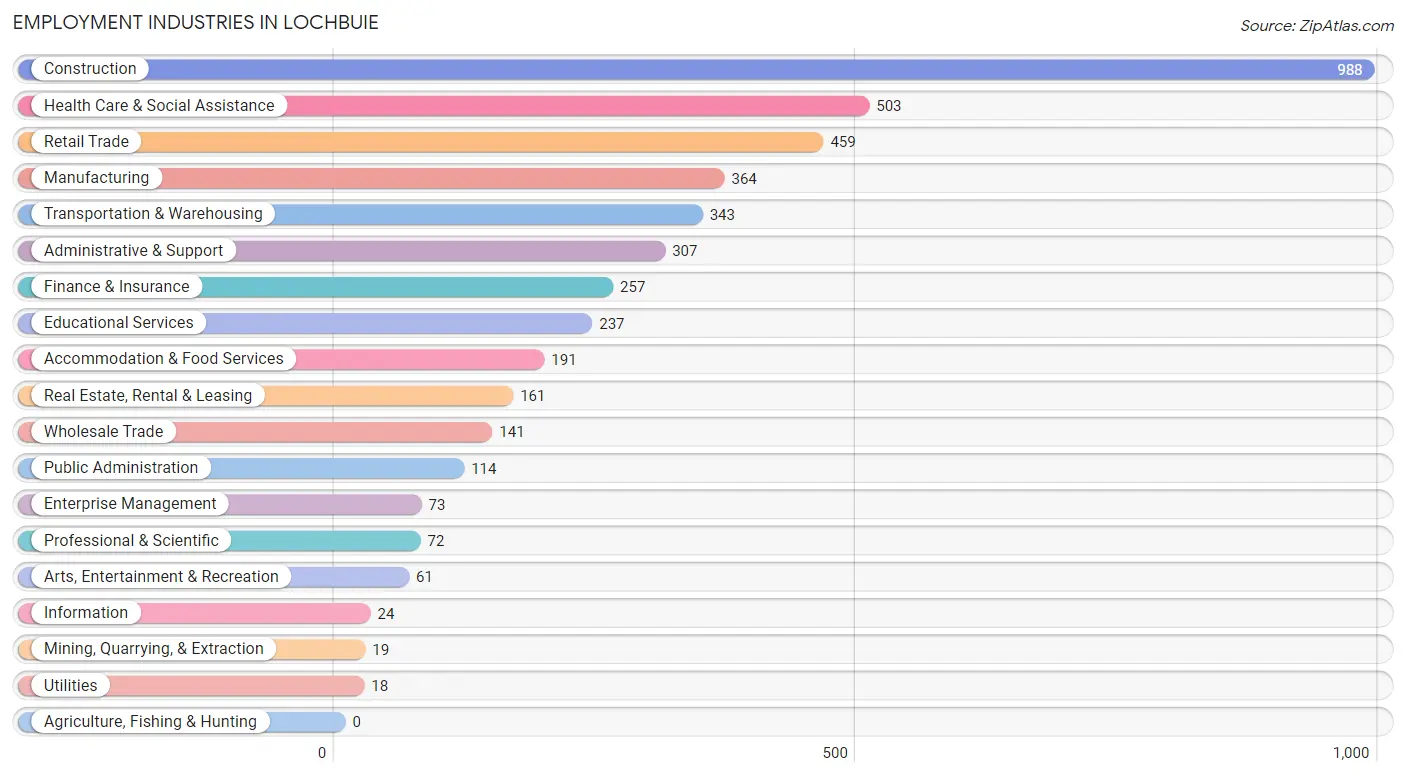
Employment Industries in Lochbuie
The major employment industries in Lochbuie include Construction (988 | 22.8%), Health Care & Social Assistance (503 | 11.6%), Retail Trade (459 | 10.6%), Manufacturing (364 | 8.4%), and Transportation & Warehousing (343 | 7.9%).
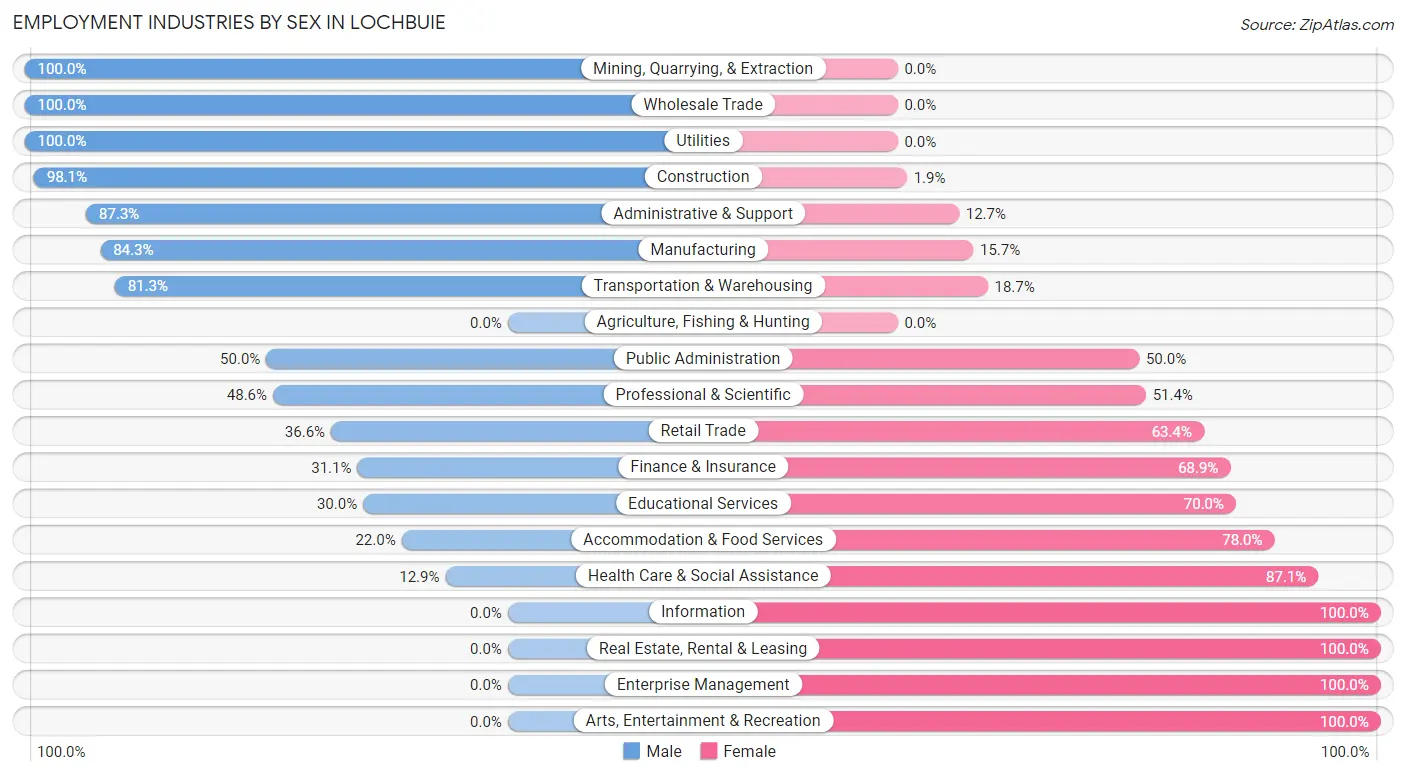
Employment Industries by Sex in Lochbuie
The Lochbuie industries that see more men than women are Mining, Quarrying, & Extraction (100.0%), Wholesale Trade (100.0%), and Utilities (100.0%), whereas the industries that tend to have a higher number of women are Information (100.0%), Real Estate, Rental & Leasing (100.0%), and Enterprise Management (100.0%).
| Industry | Male | Female |
| Agriculture, Fishing & Hunting | 0 (0.0%) | 0 (0.0%) |
| Mining, Quarrying, & Extraction | 19 (100.0%) | 0 (0.0%) |
| Construction | 969 (98.1%) | 19 (1.9%) |
| Manufacturing | 307 (84.3%) | 57 (15.7%) |
| Wholesale Trade | 141 (100.0%) | 0 (0.0%) |
| Retail Trade | 168 (36.6%) | 291 (63.4%) |
| Transportation & Warehousing | 279 (81.3%) | 64 (18.7%) |
| Utilities | 18 (100.0%) | 0 (0.0%) |
| Information | 0 (0.0%) | 24 (100.0%) |
| Finance & Insurance | 80 (31.1%) | 177 (68.9%) |
| Real Estate, Rental & Leasing | 0 (0.0%) | 161 (100.0%) |
| Professional & Scientific | 35 (48.6%) | 37 (51.4%) |
| Enterprise Management | 0 (0.0%) | 73 (100.0%) |
| Administrative & Support | 268 (87.3%) | 39 (12.7%) |
| Educational Services | 71 (30.0%) | 166 (70.0%) |
| Health Care & Social Assistance | 65 (12.9%) | 438 (87.1%) |
| Arts, Entertainment & Recreation | 0 (0.0%) | 61 (100.0%) |
| Accommodation & Food Services | 42 (22.0%) | 149 (78.0%) |
| Public Administration | 57 (50.0%) | 57 (50.0%) |
| Total | 2,519 (58.2%) | 1,813 (41.8%) |
Education in Lochbuie
School Enrollment in Lochbuie
The most common levels of schooling among the 1,841 students in Lochbuie are high school (499 | 27.1%), elementary school (481 | 26.1%), and middle school (432 | 23.5%).
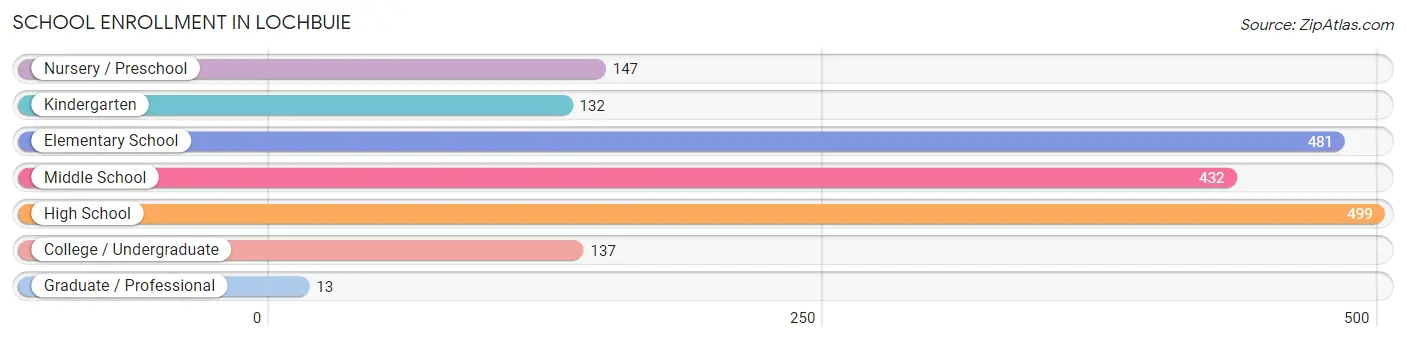
| School Level | # Students | % Students |
| Nursery / Preschool | 147 | 8.0% |
| Kindergarten | 132 | 7.2% |
| Elementary School | 481 | 26.1% |
| Middle School | 432 | 23.5% |
| High School | 499 | 27.1% |
| College / Undergraduate | 137 | 7.4% |
| Graduate / Professional | 13 | 0.7% |
| Total | 1,841 | 100.0% |
School Enrollment by Age by Funding Source in Lochbuie
Out of a total of 1,841 students who are enrolled in schools in Lochbuie, 214 (11.6%) attend a private institution, while the remaining 1,627 (88.4%) are enrolled in public schools. The age group of 3 to 4 year olds has the highest likelihood of being enrolled in private schools, with 25 (41.7% in the age bracket) enrolled. Conversely, the age group of 10 to 14 year olds has the lowest likelihood of being enrolled in a private school, with 541 (100.0% in the age bracket) attending a public institution.
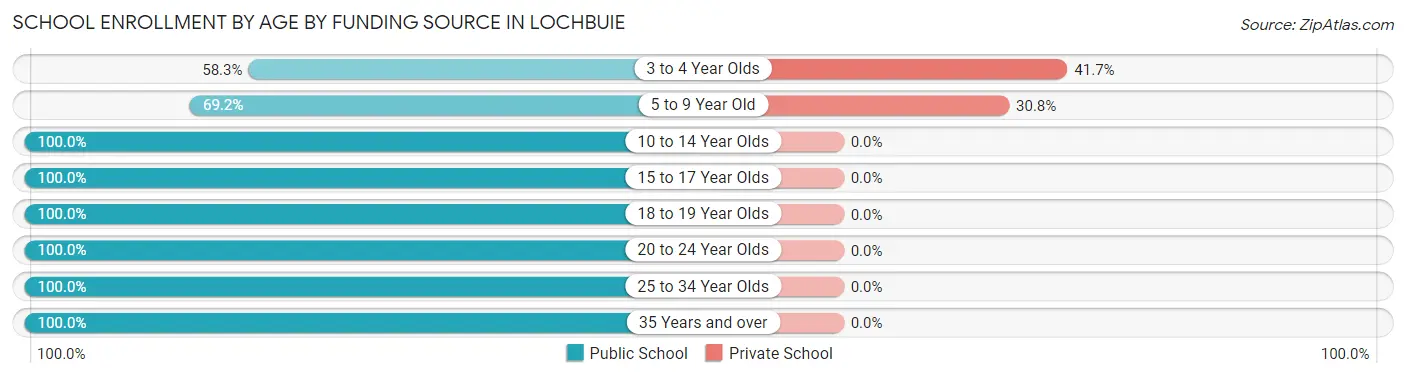
| Age Bracket | Public School | Private School |
| 3 to 4 Year Olds | 35 (58.3%) | 25 (41.7%) |
| 5 to 9 Year Old | 422 (69.2%) | 188 (30.8%) |
| 10 to 14 Year Olds | 541 (100.0%) | 0 (0.0%) |
| 15 to 17 Year Olds | 288 (100.0%) | 0 (0.0%) |
| 18 to 19 Year Olds | 126 (100.0%) | 0 (0.0%) |
| 20 to 24 Year Olds | 19 (100.0%) | 0 (0.0%) |
| 25 to 34 Year Olds | 22 (100.0%) | 0 (0.0%) |
| 35 Years and over | 175 (100.0%) | 0 (0.0%) |
| Total | 1,627 (88.4%) | 214 (11.6%) |
Educational Attainment by Field of Study in Lochbuie
Business (142 | 16.7%), bio, nature & agricultural (123 | 14.5%), psychology (115 | 13.5%), liberal arts & history (113 | 13.3%), and social sciences (76 | 8.9%) are the most common fields of study among 850 individuals in Lochbuie who have obtained a bachelor's degree or higher.
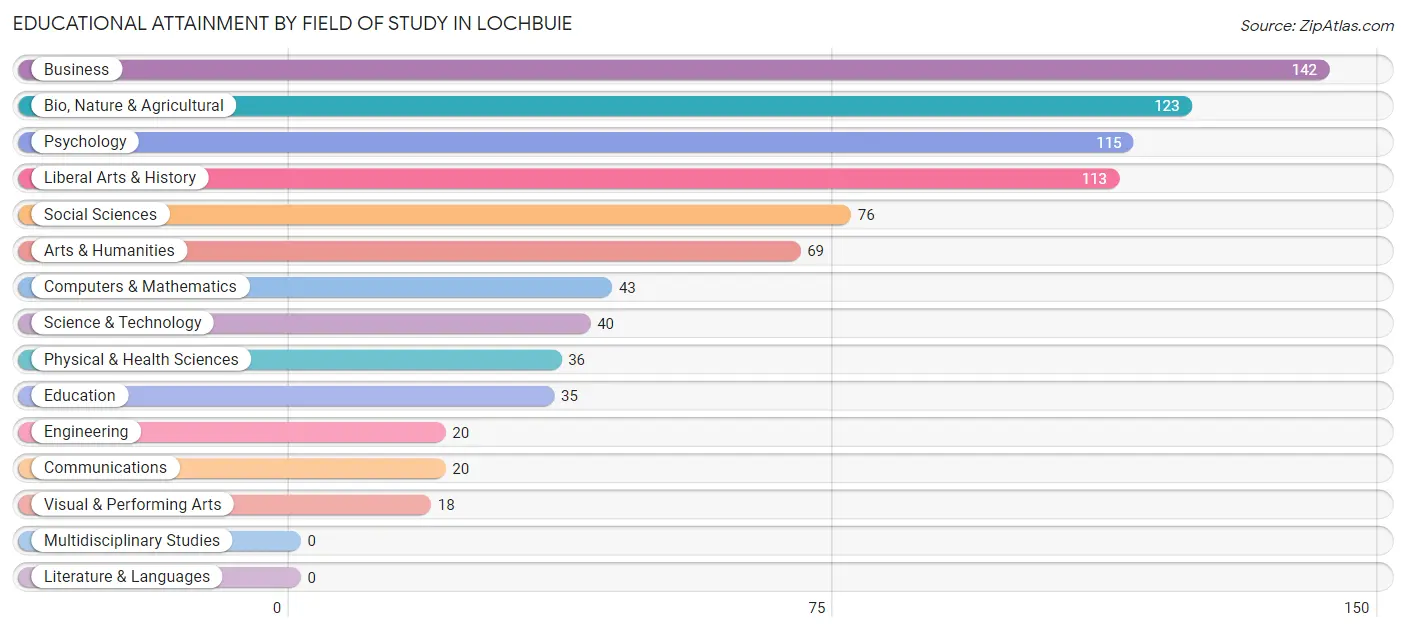
| Field of Study | # Graduates | % Graduates |
| Computers & Mathematics | 43 | 5.1% |
| Bio, Nature & Agricultural | 123 | 14.5% |
| Physical & Health Sciences | 36 | 4.2% |
| Psychology | 115 | 13.5% |
| Social Sciences | 76 | 8.9% |
| Engineering | 20 | 2.4% |
| Multidisciplinary Studies | 0 | 0.0% |
| Science & Technology | 40 | 4.7% |
| Business | 142 | 16.7% |
| Education | 35 | 4.1% |
| Literature & Languages | 0 | 0.0% |
| Liberal Arts & History | 113 | 13.3% |
| Visual & Performing Arts | 18 | 2.1% |
| Communications | 20 | 2.4% |
| Arts & Humanities | 69 | 8.1% |
| Total | 850 | 100.0% |
Transportation & Commute in Lochbuie
Vehicle Availability by Sex in Lochbuie
The most prevalent vehicle ownership categories in Lochbuie are males with 3 vehicles (978, accounting for 38.8%) and females with 3 vehicles (838, making up 56.3%).
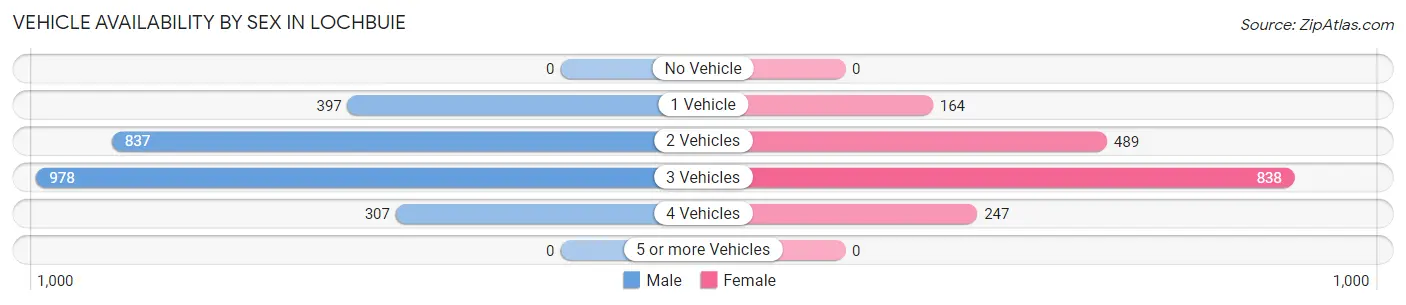
| Vehicles Available | Male | Female |
| No Vehicle | 0 (0.0%) | 0 (0.0%) |
| 1 Vehicle | 397 (15.8%) | 164 (9.4%) |
| 2 Vehicles | 837 (33.2%) | 489 (28.1%) |
| 3 Vehicles | 978 (38.8%) | 838 (48.2%) |
| 4 Vehicles | 307 (12.2%) | 247 (14.2%) |
| 5 or more Vehicles | 0 (0.0%) | 0 (0.0%) |
| Total | 2,519 (100.0%) | 1,738 (100.0%) |
Commute Time in Lochbuie
The most frequently occuring commute durations in Lochbuie are 60 to 89 minutes (948 commuters, 23.3%), 30 to 34 minutes (746 commuters, 18.3%), and 45 to 59 minutes (744 commuters, 18.3%).
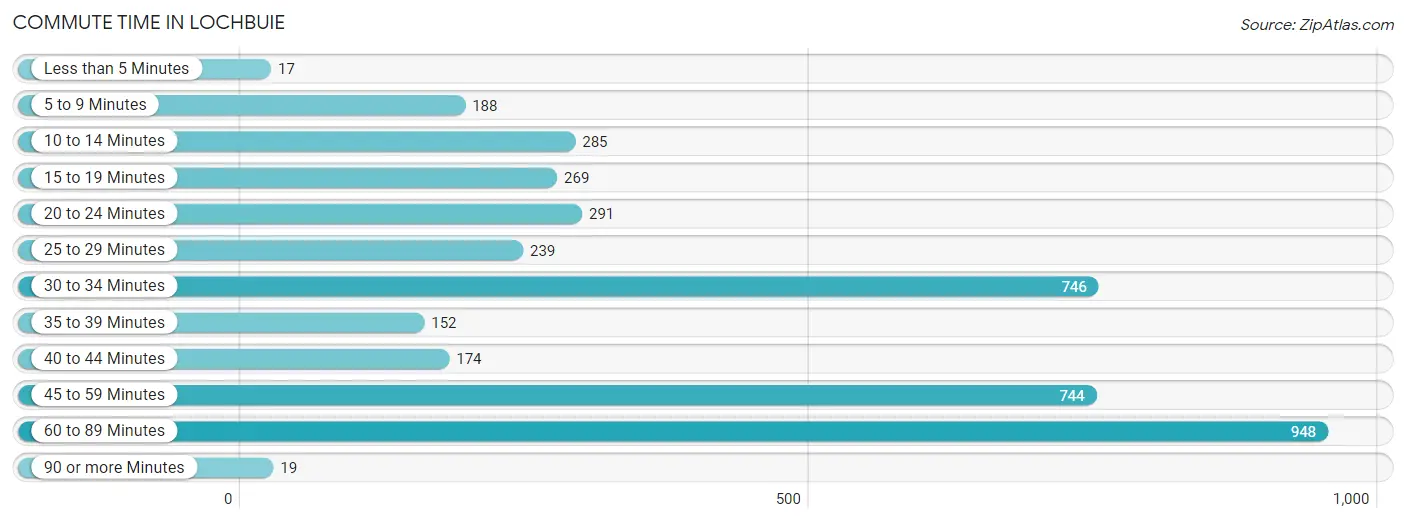
| Commute Time | # Commuters | % Commuters |
| Less than 5 Minutes | 17 | 0.4% |
| 5 to 9 Minutes | 188 | 4.6% |
| 10 to 14 Minutes | 285 | 7.0% |
| 15 to 19 Minutes | 269 | 6.6% |
| 20 to 24 Minutes | 291 | 7.1% |
| 25 to 29 Minutes | 239 | 5.9% |
| 30 to 34 Minutes | 746 | 18.3% |
| 35 to 39 Minutes | 152 | 3.7% |
| 40 to 44 Minutes | 174 | 4.3% |
| 45 to 59 Minutes | 744 | 18.3% |
| 60 to 89 Minutes | 948 | 23.3% |
| 90 or more Minutes | 19 | 0.5% |
Commute Time by Sex in Lochbuie
The most common commute times in Lochbuie are 60 to 89 minutes (658 commuters, 26.5%) for males and 45 to 59 minutes (344 commuters, 21.6%) for females.
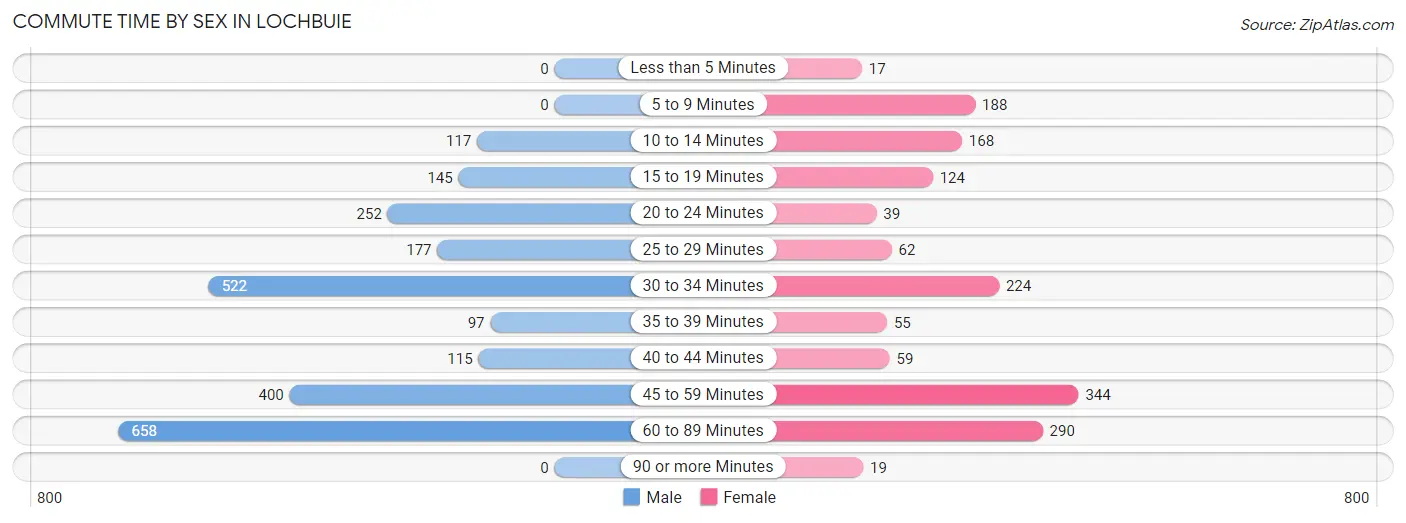
| Commute Time | Male | Female |
| Less than 5 Minutes | 0 (0.0%) | 17 (1.1%) |
| 5 to 9 Minutes | 0 (0.0%) | 188 (11.8%) |
| 10 to 14 Minutes | 117 (4.7%) | 168 (10.6%) |
| 15 to 19 Minutes | 145 (5.8%) | 124 (7.8%) |
| 20 to 24 Minutes | 252 (10.2%) | 39 (2.5%) |
| 25 to 29 Minutes | 177 (7.1%) | 62 (3.9%) |
| 30 to 34 Minutes | 522 (21.0%) | 224 (14.1%) |
| 35 to 39 Minutes | 97 (3.9%) | 55 (3.5%) |
| 40 to 44 Minutes | 115 (4.6%) | 59 (3.7%) |
| 45 to 59 Minutes | 400 (16.1%) | 344 (21.6%) |
| 60 to 89 Minutes | 658 (26.5%) | 290 (18.2%) |
| 90 or more Minutes | 0 (0.0%) | 19 (1.2%) |
Time of Departure to Work by Sex in Lochbuie
The most frequent times of departure to work in Lochbuie are 5:00 AM to 5:29 AM (518, 20.9%) for males and 6:00 AM to 6:29 AM (318, 20.0%) for females.
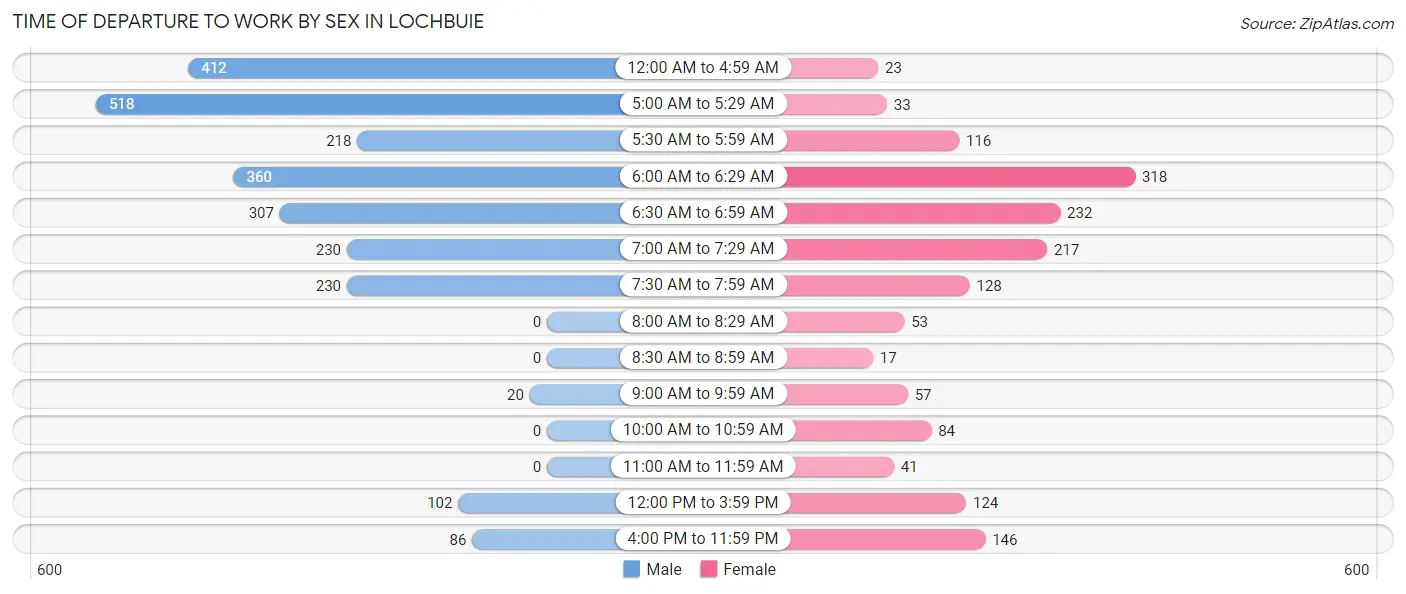
| Time of Departure | Male | Female |
| 12:00 AM to 4:59 AM | 412 (16.6%) | 23 (1.5%) |
| 5:00 AM to 5:29 AM | 518 (20.9%) | 33 (2.1%) |
| 5:30 AM to 5:59 AM | 218 (8.8%) | 116 (7.3%) |
| 6:00 AM to 6:29 AM | 360 (14.5%) | 318 (20.0%) |
| 6:30 AM to 6:59 AM | 307 (12.4%) | 232 (14.6%) |
| 7:00 AM to 7:29 AM | 230 (9.3%) | 217 (13.7%) |
| 7:30 AM to 7:59 AM | 230 (9.3%) | 128 (8.1%) |
| 8:00 AM to 8:29 AM | 0 (0.0%) | 53 (3.3%) |
| 8:30 AM to 8:59 AM | 0 (0.0%) | 17 (1.1%) |
| 9:00 AM to 9:59 AM | 20 (0.8%) | 57 (3.6%) |
| 10:00 AM to 10:59 AM | 0 (0.0%) | 84 (5.3%) |
| 11:00 AM to 11:59 AM | 0 (0.0%) | 41 (2.6%) |
| 12:00 PM to 3:59 PM | 102 (4.1%) | 124 (7.8%) |
| 4:00 PM to 11:59 PM | 86 (3.5%) | 146 (9.2%) |
| Total | 2,483 (100.0%) | 1,589 (100.0%) |
Housing Occupancy in Lochbuie
Occupancy by Ownership in Lochbuie
Of the total 2,839 dwellings in Lochbuie, owner-occupied units account for 2,650 (93.3%), while renter-occupied units make up 189 (6.7%).
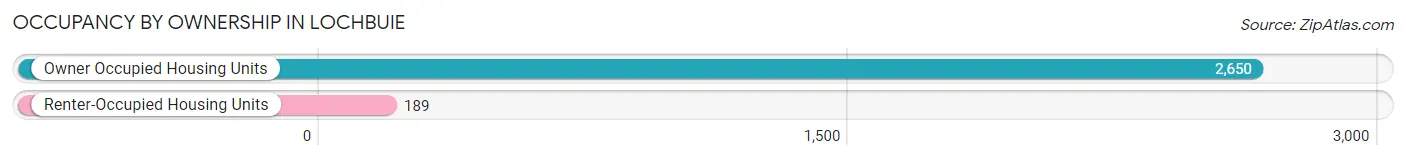
| Occupancy | # Housing Units | % Housing Units |
| Owner Occupied Housing Units | 2,650 | 93.3% |
| Renter-Occupied Housing Units | 189 | 6.7% |
| Total Occupied Housing Units | 2,839 | 100.0% |
Occupancy by Household Size in Lochbuie
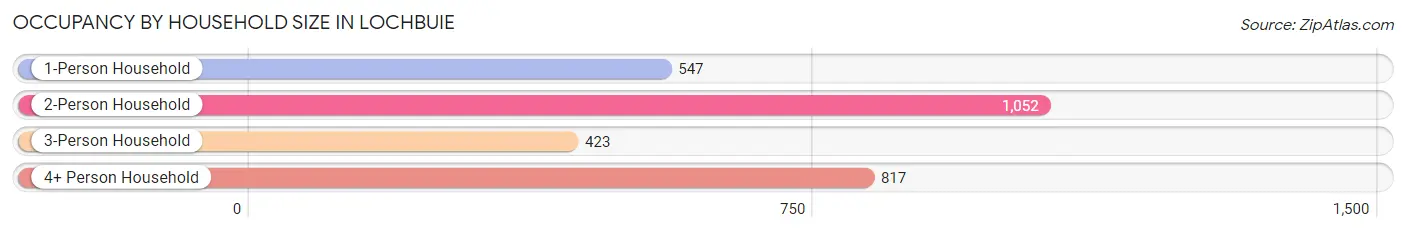
| Household Size | # Housing Units | % Housing Units |
| 1-Person Household | 547 | 19.3% |
| 2-Person Household | 1,052 | 37.1% |
| 3-Person Household | 423 | 14.9% |
| 4+ Person Household | 817 | 28.8% |
| Total Housing Units | 2,839 | 100.0% |
Occupancy by Ownership by Household Size in Lochbuie
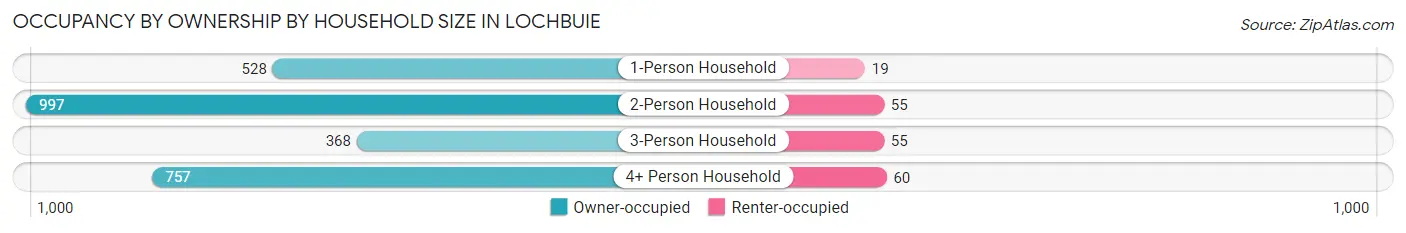
| Household Size | Owner-occupied | Renter-occupied |
| 1-Person Household | 528 (96.5%) | 19 (3.5%) |
| 2-Person Household | 997 (94.8%) | 55 (5.2%) |
| 3-Person Household | 368 (87.0%) | 55 (13.0%) |
| 4+ Person Household | 757 (92.7%) | 60 (7.3%) |
| Total Housing Units | 2,650 (93.3%) | 189 (6.7%) |
Occupancy by Educational Attainment in Lochbuie
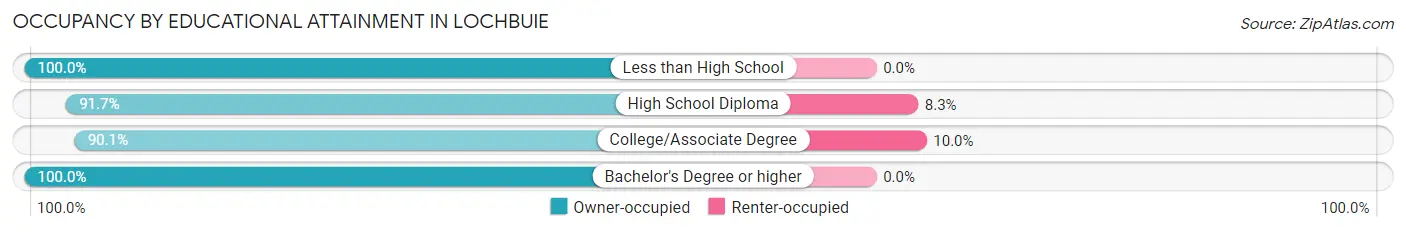
| Household Size | Owner-occupied | Renter-occupied |
| Less than High School | 339 (100.0%) | 0 (0.0%) |
| High School Diploma | 822 (91.7%) | 74 (8.3%) |
| College/Associate Degree | 1,041 (90.0%) | 115 (10.0%) |
| Bachelor's Degree or higher | 448 (100.0%) | 0 (0.0%) |
Occupancy by Age of Householder in Lochbuie
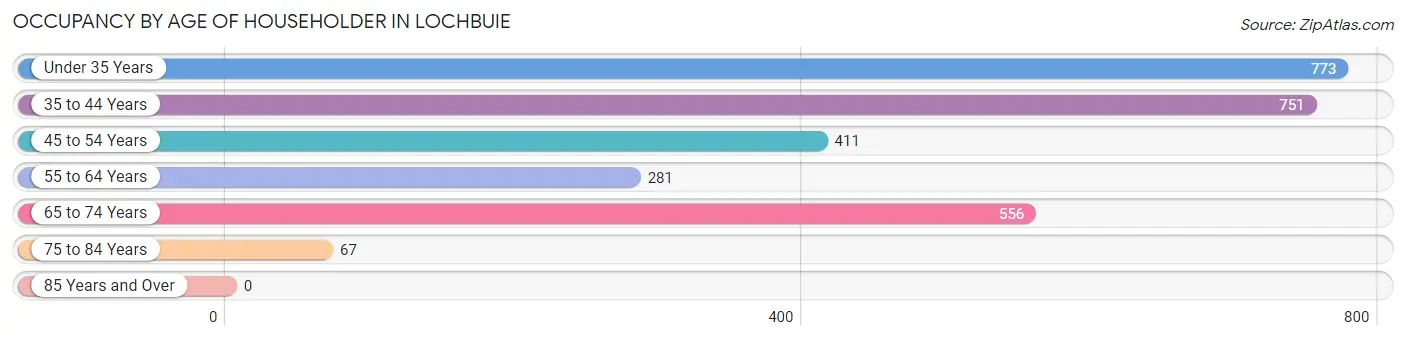
| Age Bracket | # Households | % Households |
| Under 35 Years | 773 | 27.2% |
| 35 to 44 Years | 751 | 26.5% |
| 45 to 54 Years | 411 | 14.5% |
| 55 to 64 Years | 281 | 9.9% |
| 65 to 74 Years | 556 | 19.6% |
| 75 to 84 Years | 67 | 2.4% |
| 85 Years and Over | 0 | 0.0% |
| Total | 2,839 | 100.0% |
Housing Finances in Lochbuie
Median Income by Occupancy in Lochbuie
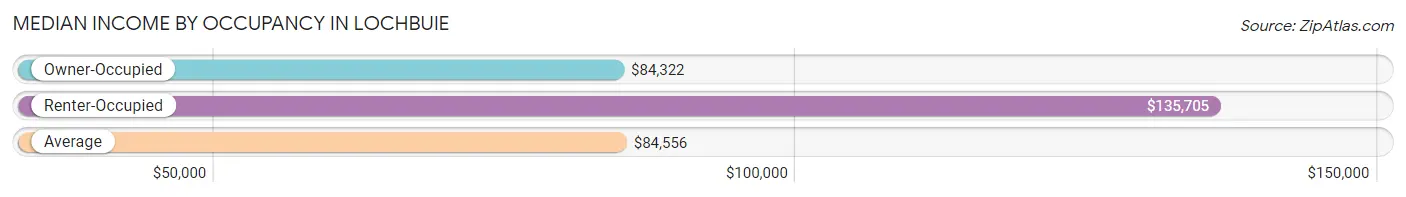
| Occupancy Type | # Households | Median Income |
| Owner-Occupied | 2,650 (93.3%) | $84,322 |
| Renter-Occupied | 189 (6.7%) | $135,705 |
| Average | 2,839 (100.0%) | $84,556 |
Occupancy by Householder Income Bracket in Lochbuie
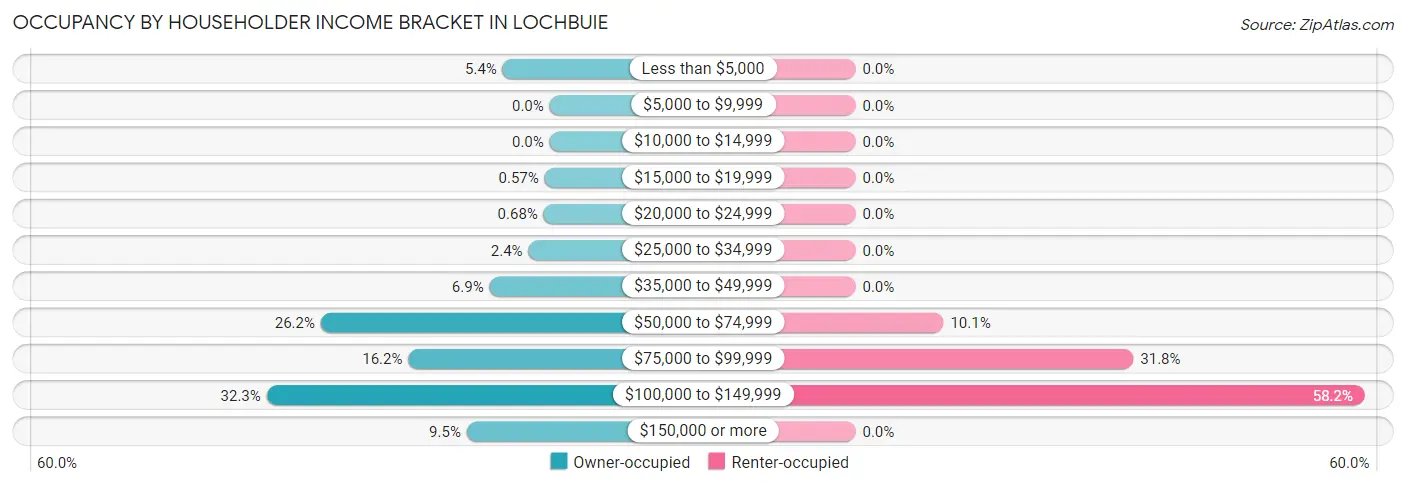
| Income Bracket | Owner-occupied | Renter-occupied |
| Less than $5,000 | 142 (5.4%) | 0 (0.0%) |
| $5,000 to $9,999 | 0 (0.0%) | 0 (0.0%) |
| $10,000 to $14,999 | 0 (0.0%) | 0 (0.0%) |
| $15,000 to $19,999 | 15 (0.6%) | 0 (0.0%) |
| $20,000 to $24,999 | 18 (0.7%) | 0 (0.0%) |
| $25,000 to $34,999 | 64 (2.4%) | 0 (0.0%) |
| $35,000 to $49,999 | 182 (6.9%) | 0 (0.0%) |
| $50,000 to $74,999 | 693 (26.2%) | 19 (10.1%) |
| $75,000 to $99,999 | 428 (16.2%) | 60 (31.8%) |
| $100,000 to $149,999 | 857 (32.3%) | 110 (58.2%) |
| $150,000 or more | 251 (9.5%) | 0 (0.0%) |
| Total | 2,650 (100.0%) | 189 (100.0%) |
Monthly Housing Cost Tiers in Lochbuie
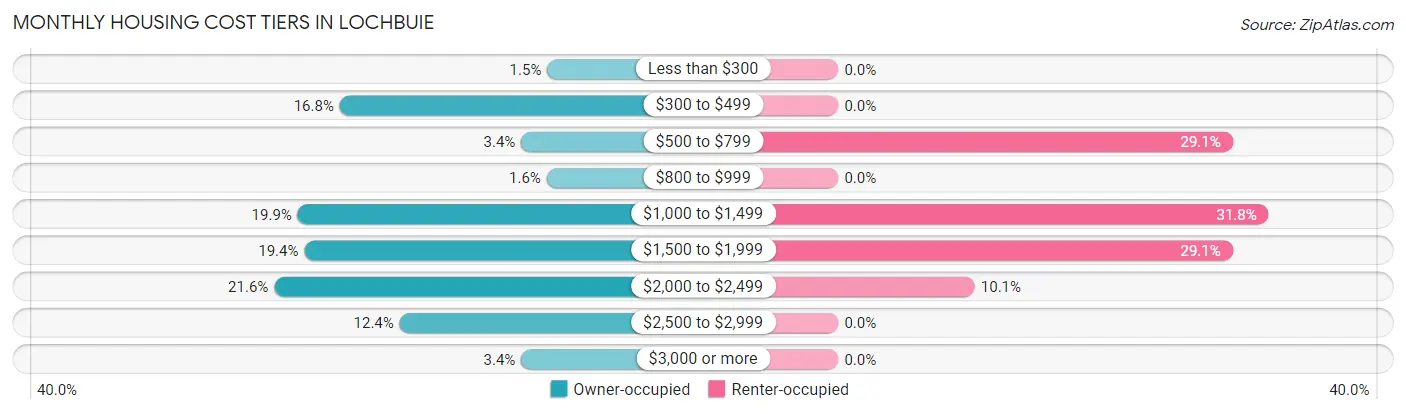
| Monthly Cost | Owner-occupied | Renter-occupied |
| Less than $300 | 40 (1.5%) | 0 (0.0%) |
| $300 to $499 | 445 (16.8%) | 0 (0.0%) |
| $500 to $799 | 91 (3.4%) | 55 (29.1%) |
| $800 to $999 | 41 (1.5%) | 0 (0.0%) |
| $1,000 to $1,499 | 527 (19.9%) | 60 (31.8%) |
| $1,500 to $1,999 | 514 (19.4%) | 55 (29.1%) |
| $2,000 to $2,499 | 573 (21.6%) | 19 (10.1%) |
| $2,500 to $2,999 | 328 (12.4%) | 0 (0.0%) |
| $3,000 or more | 91 (3.4%) | 0 (0.0%) |
| Total | 2,650 (100.0%) | 189 (100.0%) |
Physical Housing Characteristics in Lochbuie
Housing Structures in Lochbuie
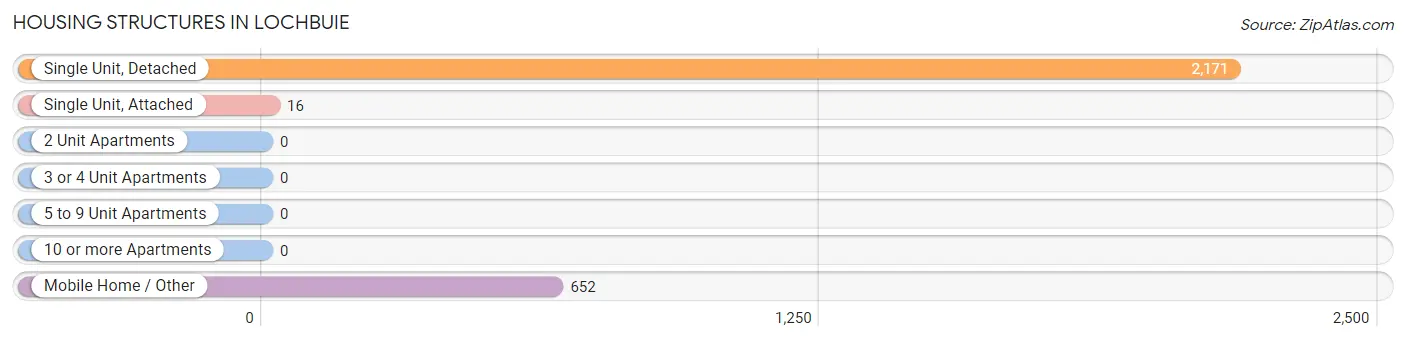
| Structure Type | # Housing Units | % Housing Units |
| Single Unit, Detached | 2,171 | 76.5% |
| Single Unit, Attached | 16 | 0.6% |
| 2 Unit Apartments | 0 | 0.0% |
| 3 or 4 Unit Apartments | 0 | 0.0% |
| 5 to 9 Unit Apartments | 0 | 0.0% |
| 10 or more Apartments | 0 | 0.0% |
| Mobile Home / Other | 652 | 23.0% |
| Total | 2,839 | 100.0% |
Housing Structures by Occupancy in Lochbuie
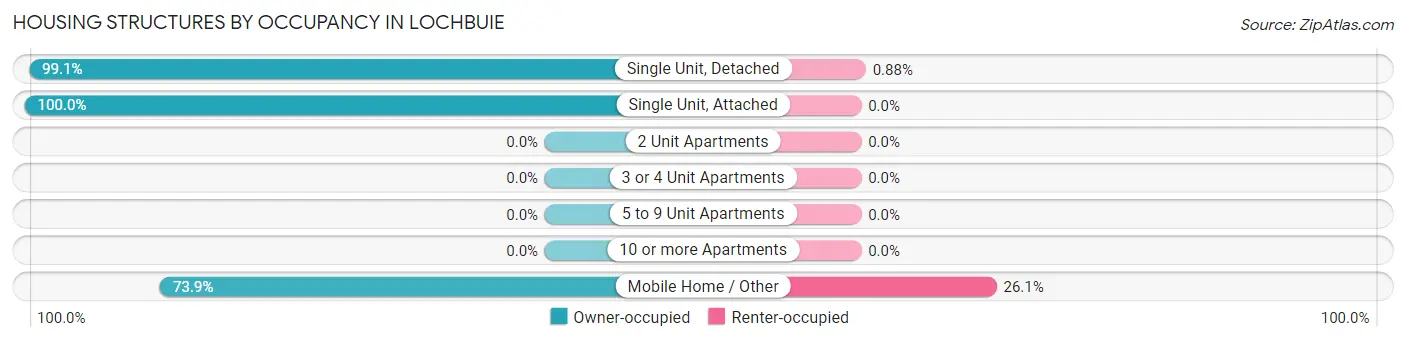
| Structure Type | Owner-occupied | Renter-occupied |
| Single Unit, Detached | 2,152 (99.1%) | 19 (0.9%) |
| Single Unit, Attached | 16 (100.0%) | 0 (0.0%) |
| 2 Unit Apartments | 0 (0.0%) | 0 (0.0%) |
| 3 or 4 Unit Apartments | 0 (0.0%) | 0 (0.0%) |
| 5 to 9 Unit Apartments | 0 (0.0%) | 0 (0.0%) |
| 10 or more Apartments | 0 (0.0%) | 0 (0.0%) |
| Mobile Home / Other | 482 (73.9%) | 170 (26.1%) |
| Total | 2,650 (93.3%) | 189 (6.7%) |
Housing Structures by Number of Rooms in Lochbuie
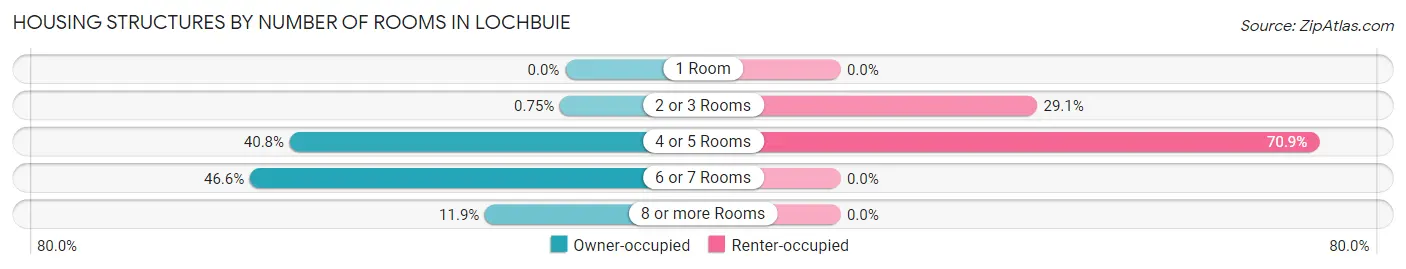
| Number of Rooms | Owner-occupied | Renter-occupied |
| 1 Room | 0 (0.0%) | 0 (0.0%) |
| 2 or 3 Rooms | 20 (0.7%) | 55 (29.1%) |
| 4 or 5 Rooms | 1,080 (40.7%) | 134 (70.9%) |
| 6 or 7 Rooms | 1,236 (46.6%) | 0 (0.0%) |
| 8 or more Rooms | 314 (11.8%) | 0 (0.0%) |
| Total | 2,650 (100.0%) | 189 (100.0%) |
Housing Structure by Heating Type in Lochbuie
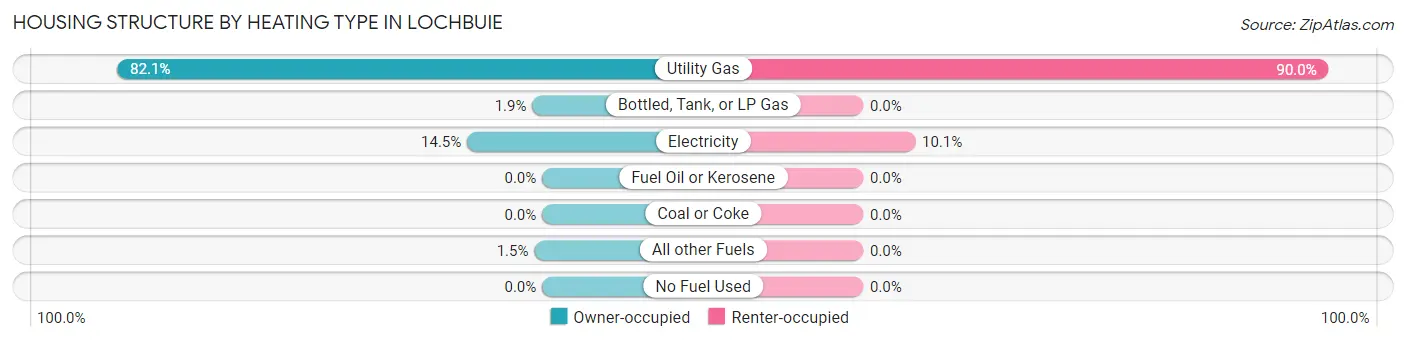
| Heating Type | Owner-occupied | Renter-occupied |
| Utility Gas | 2,176 (82.1%) | 170 (89.9%) |
| Bottled, Tank, or LP Gas | 50 (1.9%) | 0 (0.0%) |
| Electricity | 384 (14.5%) | 19 (10.1%) |
| Fuel Oil or Kerosene | 0 (0.0%) | 0 (0.0%) |
| Coal or Coke | 0 (0.0%) | 0 (0.0%) |
| All other Fuels | 40 (1.5%) | 0 (0.0%) |
| No Fuel Used | 0 (0.0%) | 0 (0.0%) |
| Total | 2,650 (100.0%) | 189 (100.0%) |
Household Vehicle Usage in Lochbuie
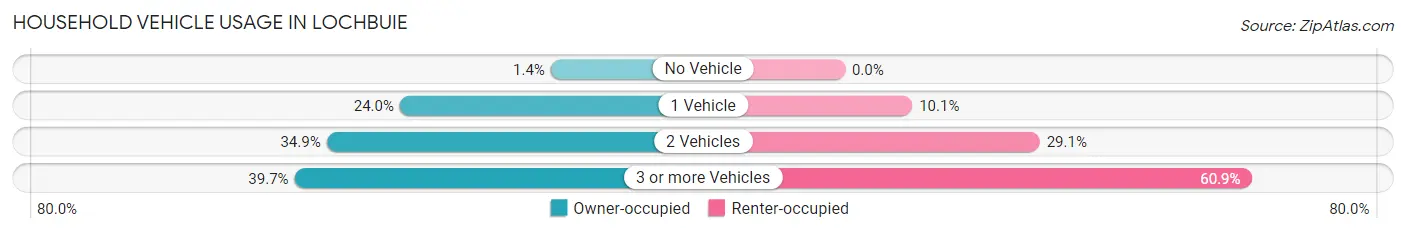
| Vehicles per Household | Owner-occupied | Renter-occupied |
| No Vehicle | 38 (1.4%) | 0 (0.0%) |
| 1 Vehicle | 635 (24.0%) | 19 (10.1%) |
| 2 Vehicles | 925 (34.9%) | 55 (29.1%) |
| 3 or more Vehicles | 1,052 (39.7%) | 115 (60.9%) |
| Total | 2,650 (100.0%) | 189 (100.0%) |
Real Estate & Mortgages in Lochbuie
Real Estate and Mortgage Overview in Lochbuie
| Characteristic | Without Mortgage | With Mortgage |
| Housing Units | 555 | 2,095 |
| Median Property Value | - | - |
| Median Household Income | $58,523 | $215 |
| Monthly Housing Costs | $417 | $91 |
| Real Estate Taxes | $865 | $75 |
Property Value by Mortgage Status in Lochbuie
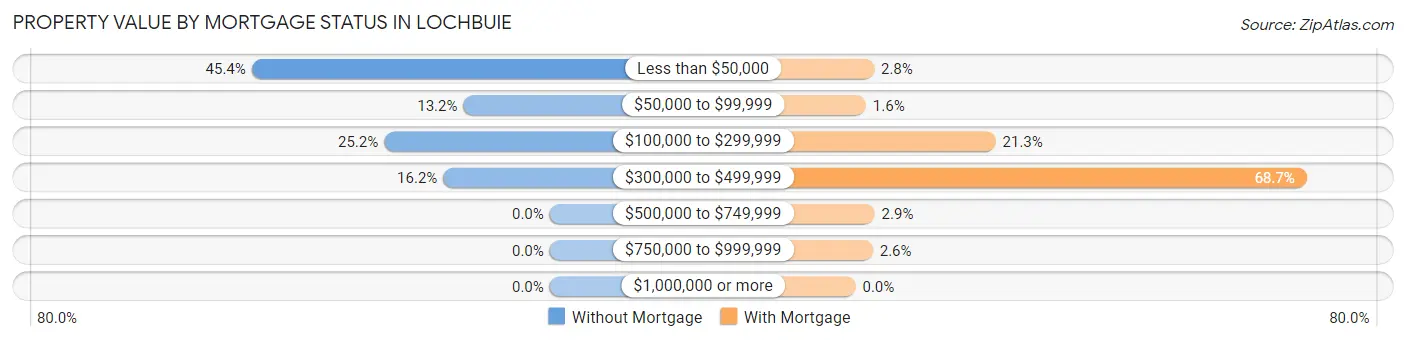
| Property Value | Without Mortgage | With Mortgage |
| Less than $50,000 | 252 (45.4%) | 59 (2.8%) |
| $50,000 to $99,999 | 73 (13.2%) | 33 (1.6%) |
| $100,000 to $299,999 | 140 (25.2%) | 447 (21.3%) |
| $300,000 to $499,999 | 90 (16.2%) | 1,440 (68.7%) |
| $500,000 to $749,999 | 0 (0.0%) | 61 (2.9%) |
| $750,000 to $999,999 | 0 (0.0%) | 55 (2.6%) |
| $1,000,000 or more | 0 (0.0%) | 0 (0.0%) |
| Total | 555 (100.0%) | 2,095 (100.0%) |
Household Income by Mortgage Status in Lochbuie
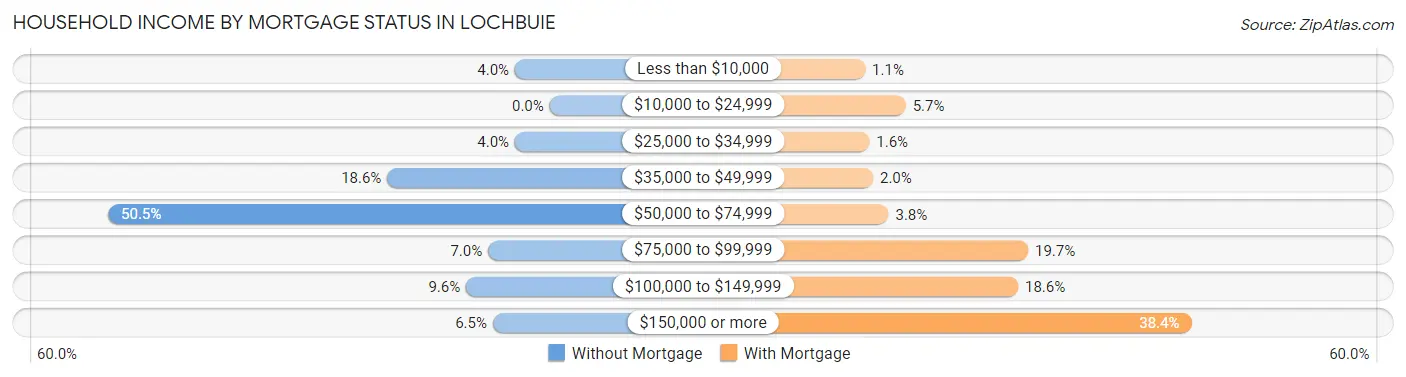
| Household Income | Without Mortgage | With Mortgage |
| Less than $10,000 | 22 (4.0%) | 23 (1.1%) |
| $10,000 to $24,999 | 0 (0.0%) | 120 (5.7%) |
| $25,000 to $34,999 | 22 (4.0%) | 33 (1.6%) |
| $35,000 to $49,999 | 103 (18.6%) | 42 (2.0%) |
| $50,000 to $74,999 | 280 (50.4%) | 79 (3.8%) |
| $75,000 to $99,999 | 39 (7.0%) | 413 (19.7%) |
| $100,000 to $149,999 | 53 (9.6%) | 389 (18.6%) |
| $150,000 or more | 36 (6.5%) | 804 (38.4%) |
| Total | 555 (100.0%) | 2,095 (100.0%) |
Property Value to Household Income Ratio in Lochbuie
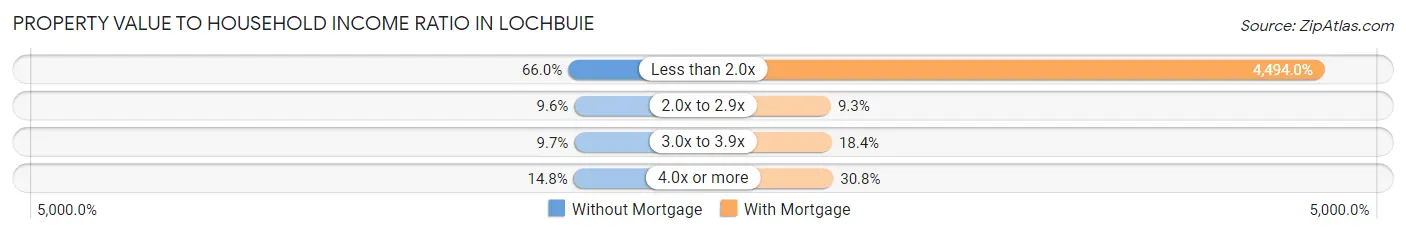
| Value-to-Income Ratio | Without Mortgage | With Mortgage |
| Less than 2.0x | 366 (65.9%) | 94,150 (4,494.0%) |
| 2.0x to 2.9x | 53 (9.6%) | 195 (9.3%) |
| 3.0x to 3.9x | 54 (9.7%) | 385 (18.4%) |
| 4.0x or more | 82 (14.8%) | 645 (30.8%) |
| Total | 555 (100.0%) | 2,095 (100.0%) |
Real Estate Taxes by Mortgage Status in Lochbuie
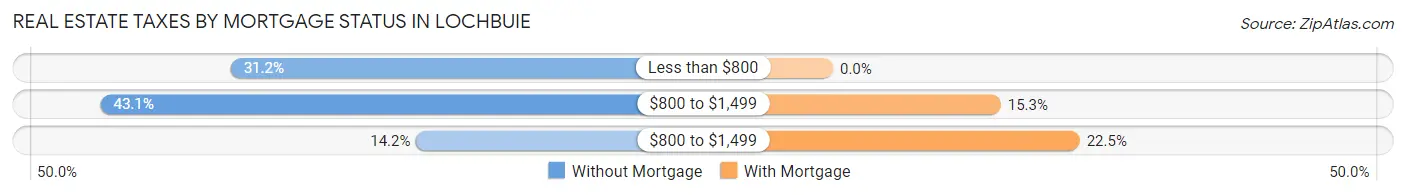
| Property Taxes | Without Mortgage | With Mortgage |
| Less than $800 | 173 (31.2%) | 0 (0.0%) |
| $800 to $1,499 | 239 (43.1%) | 321 (15.3%) |
| $800 to $1,499 | 79 (14.2%) | 472 (22.5%) |
| Total | 555 (100.0%) | 2,095 (100.0%) |
Health & Disability in Lochbuie
Health Insurance Coverage by Age in Lochbuie
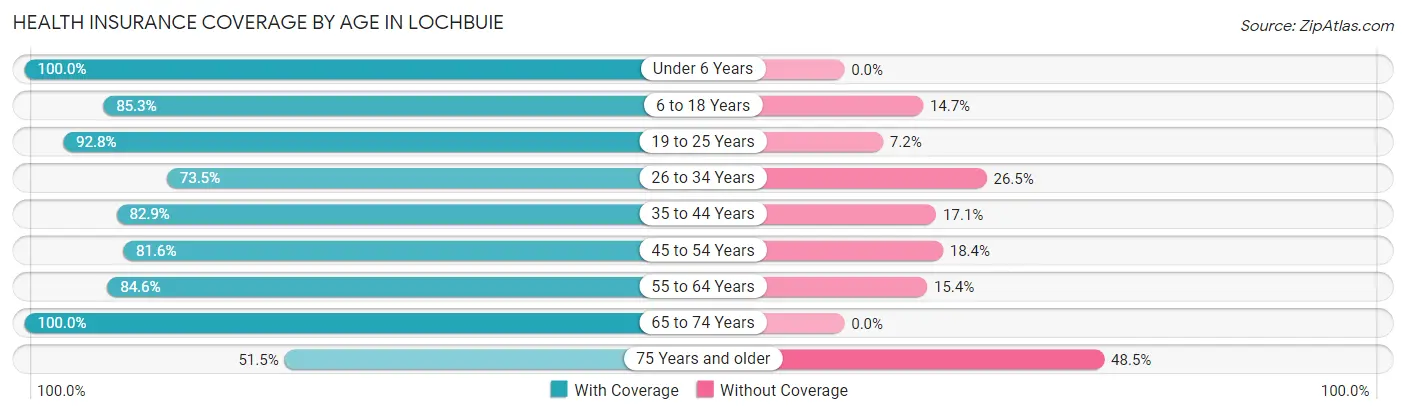
| Age Bracket | With Coverage | Without Coverage |
| Under 6 Years | 869 (100.0%) | 0 (0.0%) |
| 6 to 18 Years | 1,233 (85.3%) | 212 (14.7%) |
| 19 to 25 Years | 709 (92.8%) | 55 (7.2%) |
| 26 to 34 Years | 839 (73.5%) | 303 (26.5%) |
| 35 to 44 Years | 1,074 (82.9%) | 222 (17.1%) |
| 45 to 54 Years | 702 (81.6%) | 158 (18.4%) |
| 55 to 64 Years | 674 (84.6%) | 123 (15.4%) |
| 65 to 74 Years | 660 (100.0%) | 0 (0.0%) |
| 75 Years and older | 67 (51.5%) | 63 (48.5%) |
| Total | 6,827 (85.7%) | 1,136 (14.3%) |
Health Insurance Coverage by Citizenship Status in Lochbuie
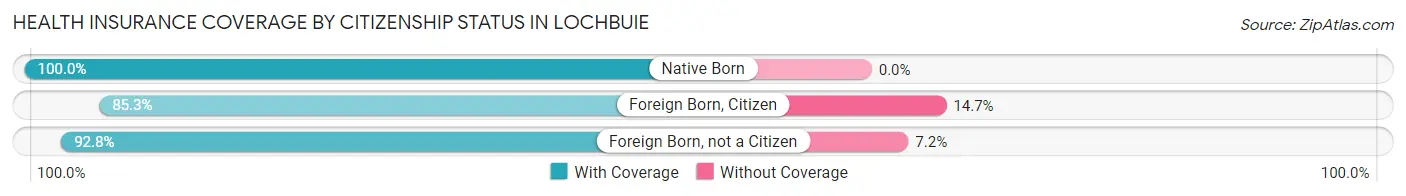
| Citizenship Status | With Coverage | Without Coverage |
| Native Born | 869 (100.0%) | 0 (0.0%) |
| Foreign Born, Citizen | 1,233 (85.3%) | 212 (14.7%) |
| Foreign Born, not a Citizen | 709 (92.8%) | 55 (7.2%) |
Health Insurance Coverage by Household Income in Lochbuie
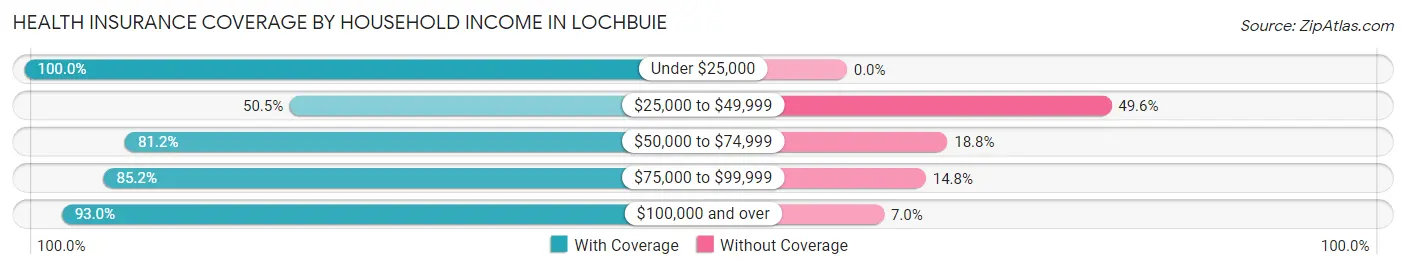
| Household Income | With Coverage | Without Coverage |
| Under $25,000 | 175 (100.0%) | 0 (0.0%) |
| $25,000 to $49,999 | 336 (50.4%) | 330 (49.5%) |
| $50,000 to $74,999 | 1,216 (81.2%) | 282 (18.8%) |
| $75,000 to $99,999 | 1,439 (85.2%) | 250 (14.8%) |
| $100,000 and over | 3,661 (93.0%) | 274 (7.0%) |
Public vs Private Health Insurance Coverage by Age in Lochbuie
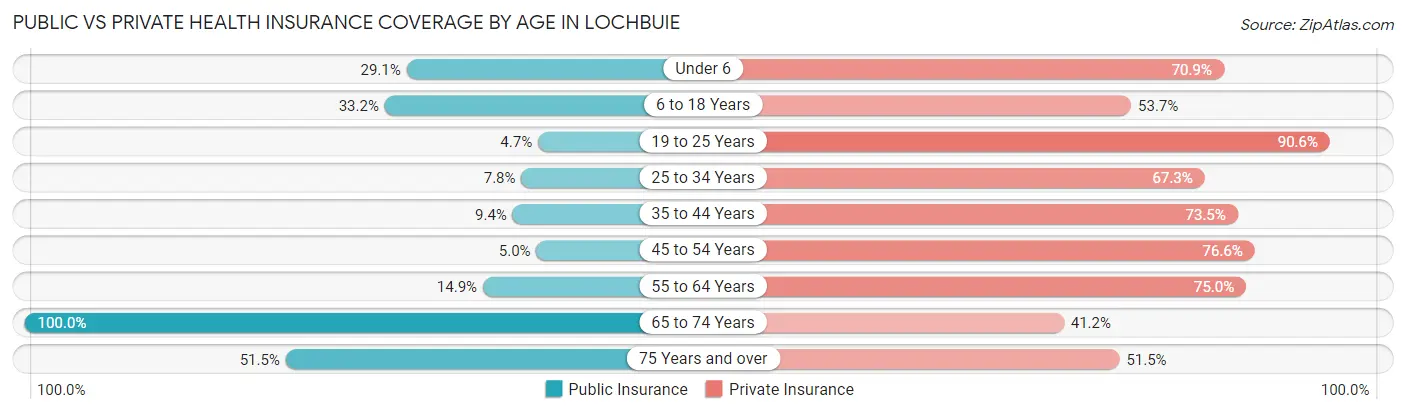
| Age Bracket | Public Insurance | Private Insurance |
| Under 6 | 253 (29.1%) | 616 (70.9%) |
| 6 to 18 Years | 479 (33.2%) | 776 (53.7%) |
| 19 to 25 Years | 36 (4.7%) | 692 (90.6%) |
| 25 to 34 Years | 89 (7.8%) | 769 (67.3%) |
| 35 to 44 Years | 122 (9.4%) | 952 (73.5%) |
| 45 to 54 Years | 43 (5.0%) | 659 (76.6%) |
| 55 to 64 Years | 119 (14.9%) | 598 (75.0%) |
| 65 to 74 Years | 660 (100.0%) | 272 (41.2%) |
| 75 Years and over | 67 (51.5%) | 67 (51.5%) |
| Total | 1,868 (23.5%) | 5,401 (67.8%) |
Disability Status by Sex by Age in Lochbuie
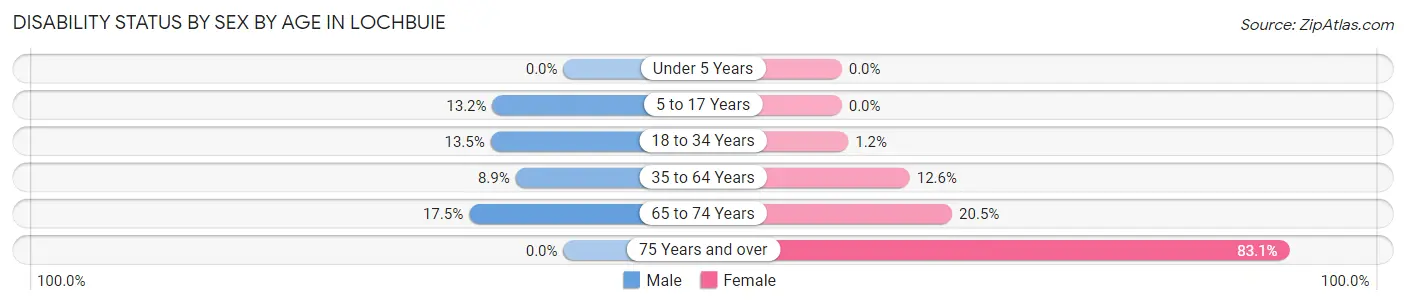
| Age Bracket | Male | Female |
| Under 5 Years | 0 (0.0%) | 0 (0.0%) |
| 5 to 17 Years | 77 (13.2%) | 0 (0.0%) |
| 18 to 34 Years | 141 (13.5%) | 12 (1.2%) |
| 35 to 64 Years | 146 (8.9%) | 165 (12.6%) |
| 65 to 74 Years | 72 (17.5%) | 51 (20.5%) |
| 75 Years and over | 0 (0.0%) | 108 (83.1%) |
Disability Class by Sex by Age in Lochbuie
Disability Class: Hearing Difficulty
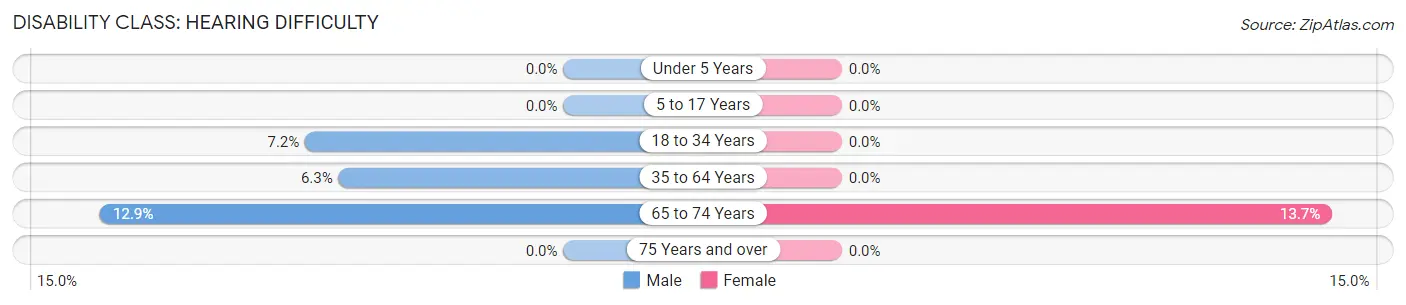
| Age Bracket | Male | Female |
| Under 5 Years | 0 (0.0%) | 0 (0.0%) |
| 5 to 17 Years | 0 (0.0%) | 0 (0.0%) |
| 18 to 34 Years | 75 (7.2%) | 0 (0.0%) |
| 35 to 64 Years | 103 (6.3%) | 0 (0.0%) |
| 65 to 74 Years | 53 (12.9%) | 34 (13.7%) |
| 75 Years and over | 0 (0.0%) | 0 (0.0%) |
Disability Class: Vision Difficulty
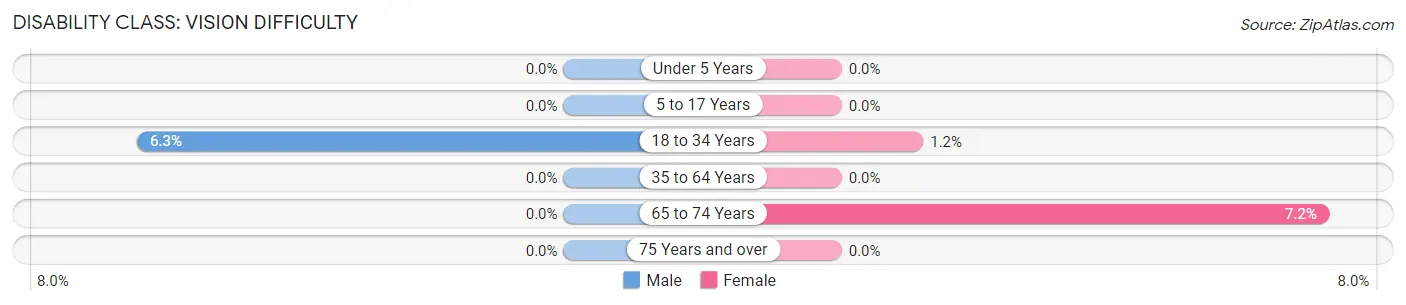
| Age Bracket | Male | Female |
| Under 5 Years | 0 (0.0%) | 0 (0.0%) |
| 5 to 17 Years | 0 (0.0%) | 0 (0.0%) |
| 18 to 34 Years | 66 (6.3%) | 12 (1.2%) |
| 35 to 64 Years | 0 (0.0%) | 0 (0.0%) |
| 65 to 74 Years | 0 (0.0%) | 18 (7.2%) |
| 75 Years and over | 0 (0.0%) | 0 (0.0%) |
Disability Class: Cognitive Difficulty
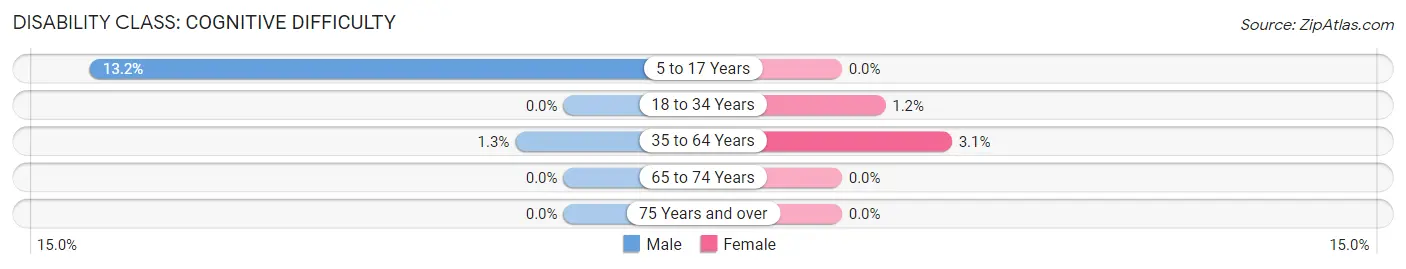
| Age Bracket | Male | Female |
| 5 to 17 Years | 77 (13.2%) | 0 (0.0%) |
| 18 to 34 Years | 0 (0.0%) | 12 (1.2%) |
| 35 to 64 Years | 22 (1.3%) | 40 (3.1%) |
| 65 to 74 Years | 0 (0.0%) | 0 (0.0%) |
| 75 Years and over | 0 (0.0%) | 0 (0.0%) |
Disability Class: Ambulatory Difficulty
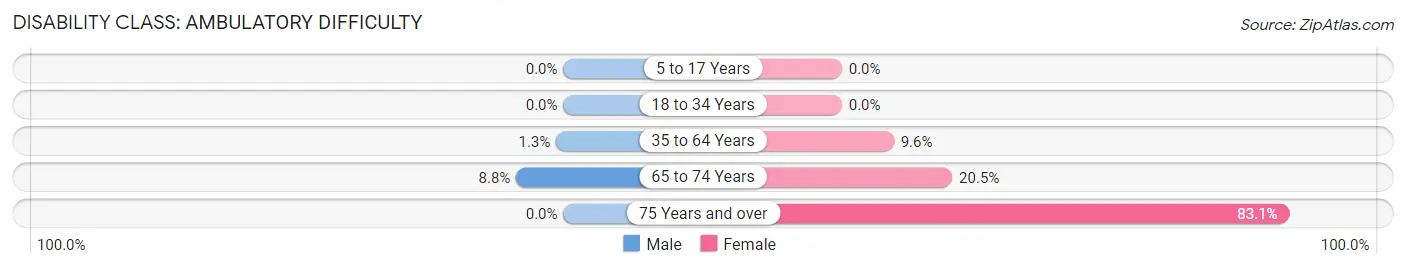
| Age Bracket | Male | Female |
| 5 to 17 Years | 0 (0.0%) | 0 (0.0%) |
| 18 to 34 Years | 0 (0.0%) | 0 (0.0%) |
| 35 to 64 Years | 22 (1.3%) | 126 (9.6%) |
| 65 to 74 Years | 36 (8.8%) | 51 (20.5%) |
| 75 Years and over | 0 (0.0%) | 108 (83.1%) |
Disability Class: Self-Care Difficulty
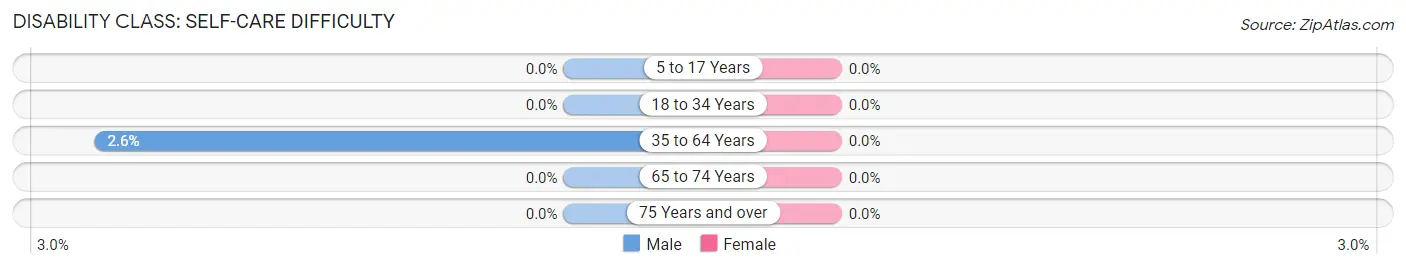
| Age Bracket | Male | Female |
| 5 to 17 Years | 0 (0.0%) | 0 (0.0%) |
| 18 to 34 Years | 0 (0.0%) | 0 (0.0%) |
| 35 to 64 Years | 43 (2.6%) | 0 (0.0%) |
| 65 to 74 Years | 0 (0.0%) | 0 (0.0%) |
| 75 Years and over | 0 (0.0%) | 0 (0.0%) |
Technology Access in Lochbuie
Computing Device Access in Lochbuie
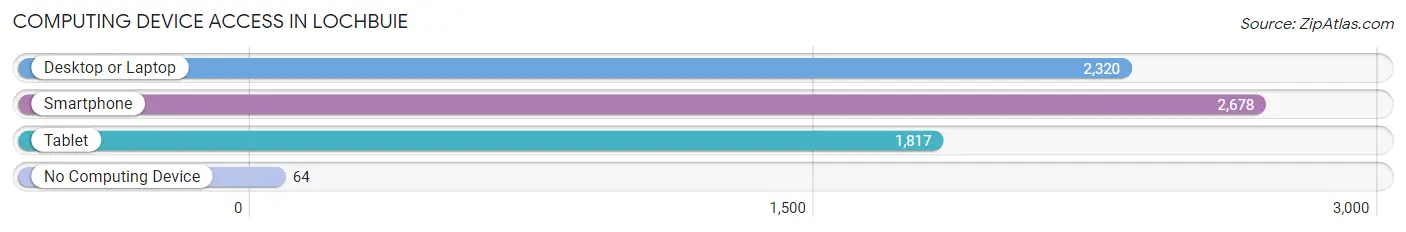
| Device Type | # Households | % Households |
| Desktop or Laptop | 2,320 | 81.7% |
| Smartphone | 2,678 | 94.3% |
| Tablet | 1,817 | 64.0% |
| No Computing Device | 64 | 2.2% |
| Total | 2,839 | 100.0% |
Internet Access in Lochbuie
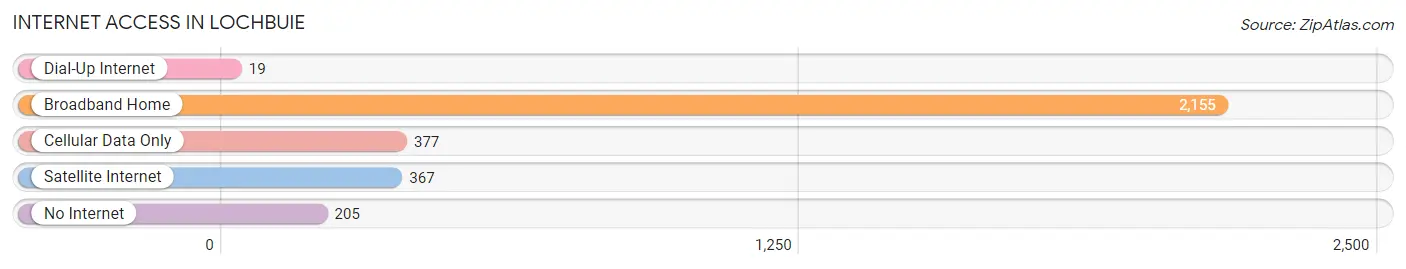
| Internet Type | # Households | % Households |
| Dial-Up Internet | 19 | 0.7% |
| Broadband Home | 2,155 | 75.9% |
| Cellular Data Only | 377 | 13.3% |
| Satellite Internet | 367 | 12.9% |
| No Internet | 205 | 7.2% |
| Total | 2,839 | 100.0% |
Lochbuie Summary
Lochbuie is a town located in Weld County, Colorado, United States. It is located approximately 25 miles northeast of Denver and is part of the Denver-Aurora-Lakewood Metropolitan Statistical Area. The town was incorporated in 1998 and has a population of approximately 5,000 people.
Geography
Lochbuie is located in Weld County, Colorado, at 39°59'N 104°51'W. It is situated at an elevation of 5,093 feet (1,551 m). The town is located in the South Platte River Valley, which is part of the Great Plains region of the United States. The town is bordered by the towns of Hudson to the north, Brighton to the east, and Fort Lupton to the south.
The town is located in a semi-arid climate, with hot summers and cold winters. The average annual precipitation is approximately 16 inches (406 mm). The average high temperature in July is 90°F (32°C), and the average low temperature in January is 16°F (-9°C).
Economy
Lochbuie is primarily a residential community, with a small commercial sector. The town is home to several small businesses, including a grocery store, a hardware store, and a few restaurants. The town is also home to a number of light industrial businesses, including a plastics manufacturer and a metal fabrication shop.
The town is served by the Burlington Northern Santa Fe Railroad, which provides freight service to the area. The town is also served by the Denver International Airport, which is located approximately 25 miles to the south.
Demographics
As of the 2010 census, the population of Lochbuie was 5,224. The racial makeup of the town was 75.3% White, 0.7% African American, 0.7% Native American, 0.7% Asian, 0.1% Pacific Islander, 19.2% from other races, and 3.5% from two or more races. Hispanic or Latino of any race were 37.2% of the population.
The median household income in Lochbuie was $50,938, and the median family income was $54,844. The per capita income for the town was $20,945. About 11.2% of families and 14.2% of the population were below the poverty line, including 19.2% of those under age 18 and 8.2% of those age 65 or over.
The town is served by the Weld County School District, which includes two elementary schools, one middle school, and one high school. The town is also home to a branch of the Weld County Library.
Conclusion
Lochbuie is a small town located in Weld County, Colorado. It is located approximately 25 miles northeast of Denver and is part of the Denver-Aurora-Lakewood Metropolitan Statistical Area. The town was incorporated in 1998 and has a population of approximately 5,000 people. The town is primarily a residential community, with a small commercial sector. The town is served by the Burlington Northern Santa Fe Railroad, and is also served by the Denver International Airport. The racial makeup of the town is 75.3% White, 0.7% African American, 0.7% Native American, 0.7% Asian, 0.1% Pacific Islander, 19.2% from other races, and 3.5% from two or more races. The median household income in Lochbuie was $50,938, and the median family income was $54,844. The town is served by the Weld County School District, which includes two elementary schools, one middle school, and one high school. The town is also home to a branch of the Weld County Library.
Common Questions
What is Per Capita Income in Lochbuie?
Per Capita income in Lochbuie is $34,226.
What is the Median Family Income in Lochbuie?
Median Family Income in Lochbuie is $91,319.
What is the Median Household income in Lochbuie?
Median Household Income in Lochbuie is $84,556.
What is Income or Wage Gap in Lochbuie?
Income or Wage Gap in Lochbuie is 37.4%.
Women in Lochbuie earn 62.6 cents for every dollar earned by a man.
What is Inequality or Gini Index in Lochbuie?
Inequality or Gini Index in Lochbuie is 0.28.
What is the Total Population of Lochbuie?
Total Population of Lochbuie is 7,963.
What is the Total Male Population of Lochbuie?
Total Male Population of Lochbuie is 4,008.
What is the Total Female Population of Lochbuie?
Total Female Population of Lochbuie is 3,955.
What is the Ratio of Males per 100 Females in Lochbuie?
There are 101.34 Males per 100 Females in Lochbuie.
What is the Ratio of Females per 100 Males in Lochbuie?
There are 98.68 Females per 100 Males in Lochbuie.
What is the Median Population Age in Lochbuie?
Median Population Age in Lochbuie is 32.5 Years.
What is the Average Family Size in Lochbuie
Average Family Size in Lochbuie is 3.2 People.
What is the Average Household Size in Lochbuie
Average Household Size in Lochbuie is 2.8 People.
How Large is the Labor Force in Lochbuie?
There are 4,435 People in the Labor Forcein in Lochbuie.
What is the Percentage of People in the Labor Force in Lochbuie?
75.0% of People are in the Labor Force in Lochbuie.
What is the Unemployment Rate in Lochbuie?
Unemployment Rate in Lochbuie is 2.3%.