Zip Codes with the Highest Percentage of Population Employed in Firefighting & Prevention in Colorado
RELATED REPORTS & OPTIONS
Firefighting & Prevention
Colorado
Compare Zip Codes
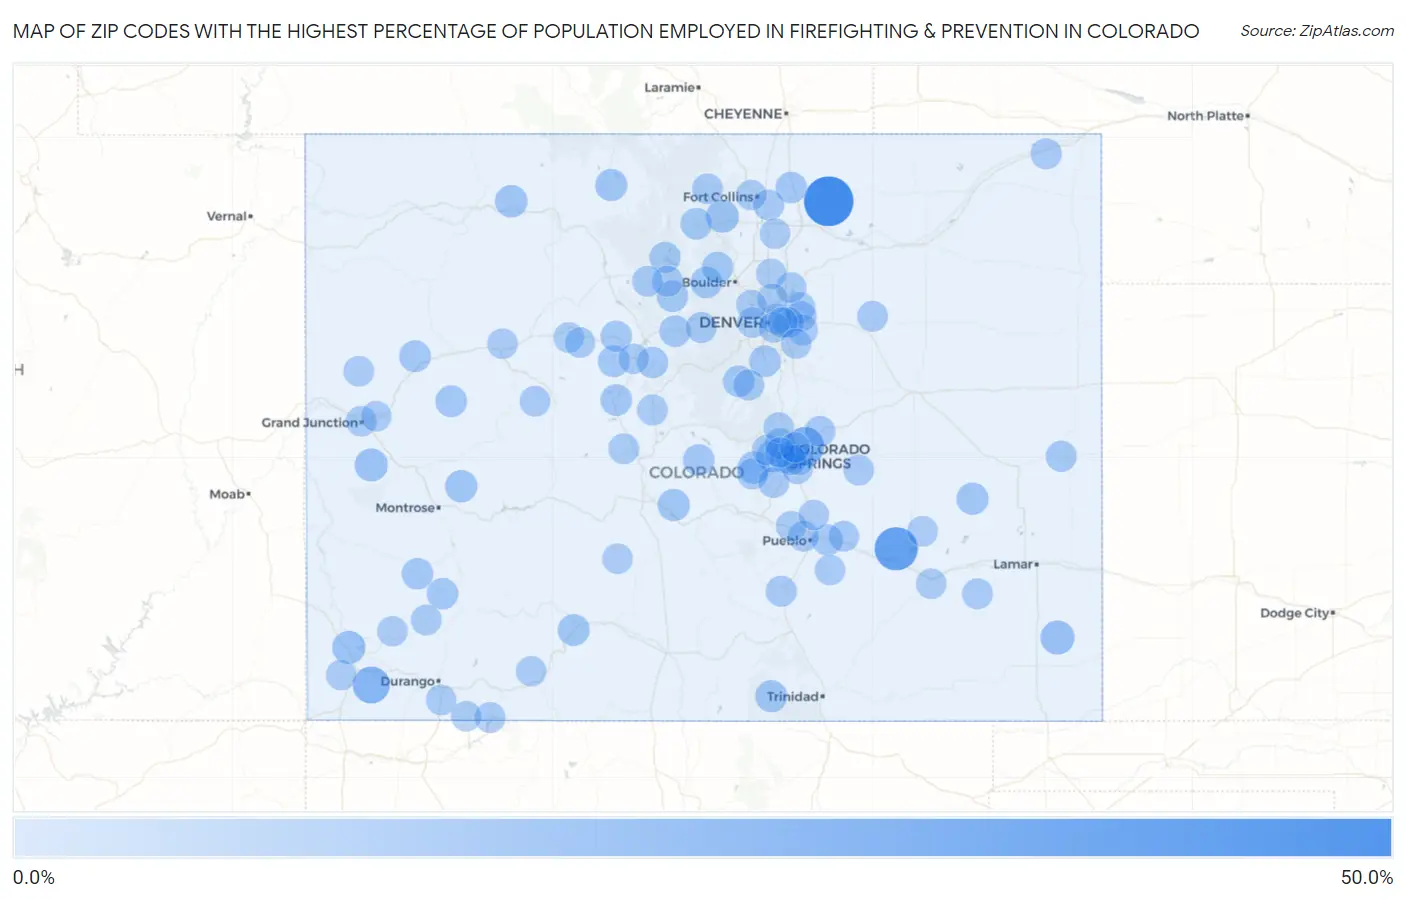
Map of Zip Codes with the Highest Percentage of Population Employed in Firefighting & Prevention in Colorado
0.0%
50.0%
Zip Codes with the Highest Percentage of Population Employed in Firefighting & Prevention in Colorado
| Zip Code | % Employed | vs State | vs National | |
| 1. | 80622 | 42.4% | 1.2%(+41.3)#1 | 1.2%(+41.3)#24 |
| 2. | 81033 | 28.6% | 1.2%(+27.4)#2 | 1.2%(+27.4)#49 |
| 3. | 80938 | 18.5% | 1.2%(+17.3)#3 | 1.2%(+17.3)#109 |
| 4. | 81330 | 15.3% | 1.2%(+14.1)#4 | 1.2%(+14.1)#152 |
| 5. | 81084 | 9.1% | 1.2%(+7.90)#5 | 1.2%(+7.91)#341 |
| 6. | 81327 | 7.4% | 1.2%(+6.22)#6 | 1.2%(+6.22)#468 |
| 7. | 81527 | 7.1% | 1.2%(+5.90)#7 | 1.2%(+5.91)#504 |
| 8. | 80515 | 6.7% | 1.2%(+5.54)#8 | 1.2%(+5.55)#551 |
| 9. | 81639 | 6.2% | 1.2%(+5.00)#9 | 1.2%(+5.00)#646 |
| 10. | 81415 | 5.6% | 1.2%(+4.38)#10 | 1.2%(+4.38)#754 |
| 11. | 80813 | 5.5% | 1.2%(+4.32)#11 | 1.2%(+4.32)#765 |
| 12. | 80480 | 5.3% | 1.2%(+4.11)#12 | 1.2%(+4.12)#806 |
| 13. | 81045 | 5.3% | 1.2%(+4.07)#13 | 1.2%(+4.08)#814 |
| 14. | 81233 | 5.2% | 1.2%(+4.00)#14 | 1.2%(+4.00)#836 |
| 15. | 80829 | 5.2% | 1.2%(+3.99)#15 | 1.2%(+4.00)#841 |
| 16. | 81091 | 5.1% | 1.2%(+3.86)#16 | 1.2%(+3.86)#892 |
| 17. | 81154 | 4.7% | 1.2%(+3.50)#17 | 1.2%(+3.51)#1,030 |
| 18. | 81635 | 4.5% | 1.2%(+3.29)#18 | 1.2%(+3.29)#1,113 |
| 19. | 81649 | 4.4% | 1.2%(+3.21)#19 | 1.2%(+3.21)#1,153 |
| 20. | 80466 | 4.4% | 1.2%(+3.18)#20 | 1.2%(+3.18)#1,166 |
| 21. | 80131 | 4.3% | 1.2%(+3.16)#21 | 1.2%(+3.16)#1,178 |
| 22. | 81624 | 4.3% | 1.2%(+3.14)#22 | 1.2%(+3.15)#1,187 |
| 23. | 80820 | 4.1% | 1.2%(+2.93)#23 | 1.2%(+2.93)#1,291 |
| 24. | 80461 | 4.1% | 1.2%(+2.90)#24 | 1.2%(+2.90)#1,300 |
| 25. | 80517 | 4.0% | 1.2%(+2.83)#25 | 1.2%(+2.83)#1,346 |
| 26. | 80425 | 4.0% | 1.2%(+2.81)#26 | 1.2%(+2.81)#1,360 |
| 27. | 81426 | 4.0% | 1.2%(+2.78)#27 | 1.2%(+2.78)#1,375 |
| 28. | 80482 | 4.0% | 1.2%(+2.78)#28 | 1.2%(+2.78)#1,376 |
| 29. | 80650 | 4.0% | 1.2%(+2.76)#29 | 1.2%(+2.77)#1,382 |
| 30. | 80476 | 3.9% | 1.2%(+2.69)#30 | 1.2%(+2.70)#1,421 |
| 31. | 81430 | 3.8% | 1.2%(+2.60)#31 | 1.2%(+2.61)#1,474 |
| 32. | 80455 | 3.8% | 1.2%(+2.59)#32 | 1.2%(+2.60)#1,481 |
| 33. | 80424 | 3.5% | 1.2%(+2.36)#33 | 1.2%(+2.36)#1,682 |
| 34. | 81657 | 3.3% | 1.2%(+2.16)#34 | 1.2%(+2.16)#1,860 |
| 35. | 80905 | 3.2% | 1.2%(+2.03)#35 | 1.2%(+2.03)#2,001 |
| 36. | 80446 | 3.2% | 1.2%(+1.97)#36 | 1.2%(+1.97)#2,063 |
| 37. | 80810 | 3.1% | 1.2%(+1.86)#37 | 1.2%(+1.87)#2,180 |
| 38. | 80860 | 3.0% | 1.2%(+1.83)#38 | 1.2%(+1.84)#2,216 |
| 39. | 81006 | 3.0% | 1.2%(+1.79)#39 | 1.2%(+1.79)#2,275 |
| 40. | 80135 | 2.9% | 1.2%(+1.75)#40 | 1.2%(+1.76)#2,323 |
| 41. | 80452 | 2.9% | 1.2%(+1.74)#41 | 1.2%(+1.74)#2,339 |
| 42. | 80809 | 2.9% | 1.2%(+1.73)#42 | 1.2%(+1.73)#2,354 |
| 43. | 81069 | 2.9% | 1.2%(+1.71)#43 | 1.2%(+1.72)#2,378 |
| 44. | 80749 | 2.9% | 1.2%(+1.69)#44 | 1.2%(+1.69)#2,421 |
| 45. | 80478 | 2.9% | 1.2%(+1.66)#45 | 1.2%(+1.67)#2,465 |
| 46. | 80440 | 2.8% | 1.2%(+1.63)#46 | 1.2%(+1.63)#2,541 |
| 47. | 80926 | 2.7% | 1.2%(+1.49)#47 | 1.2%(+1.49)#2,755 |
| 48. | 80249 | 2.6% | 1.2%(+1.39)#48 | 1.2%(+1.39)#2,940 |
| 49. | 80018 | 2.6% | 1.2%(+1.39)#49 | 1.2%(+1.39)#2,944 |
| 50. | 80547 | 2.5% | 1.2%(+1.35)#50 | 1.2%(+1.35)#3,018 |
| 51. | 81054 | 2.5% | 1.2%(+1.35)#51 | 1.2%(+1.35)#3,021 |
| 52. | 80019 | 2.5% | 1.2%(+1.34)#52 | 1.2%(+1.34)#3,039 |
| 53. | 80919 | 2.5% | 1.2%(+1.31)#53 | 1.2%(+1.32)#3,086 |
| 54. | 81025 | 2.5% | 1.2%(+1.31)#54 | 1.2%(+1.31)#3,095 |
| 55. | 81121 | 2.5% | 1.2%(+1.31)#55 | 1.2%(+1.31)#3,096 |
| 56. | 80451 | 2.5% | 1.2%(+1.28)#56 | 1.2%(+1.28)#3,166 |
| 57. | 80103 | 2.4% | 1.2%(+1.24)#57 | 1.2%(+1.25)#3,253 |
| 58. | 80512 | 2.4% | 1.2%(+1.19)#58 | 1.2%(+1.20)#3,380 |
| 59. | 80831 | 2.4% | 1.2%(+1.19)#59 | 1.2%(+1.19)#3,397 |
| 60. | 80864 | 2.4% | 1.2%(+1.18)#60 | 1.2%(+1.18)#3,416 |
| 61. | 81654 | 2.3% | 1.2%(+1.09)#61 | 1.2%(+1.09)#3,627 |
| 62. | 81003 | 2.3% | 1.2%(+1.08)#62 | 1.2%(+1.08)#3,660 |
| 63. | 81211 | 2.3% | 1.2%(+1.07)#63 | 1.2%(+1.07)#3,696 |
| 64. | 81332 | 2.2% | 1.2%(+1.02)#64 | 1.2%(+1.03)#3,822 |
| 65. | 81501 | 2.2% | 1.2%(+1.01)#65 | 1.2%(+1.01)#3,865 |
| 66. | 80011 | 2.2% | 1.2%(+0.981)#66 | 1.2%(+0.985)#3,954 |
| 67. | 81303 | 2.2% | 1.2%(+0.971)#67 | 1.2%(+0.975)#3,985 |
| 68. | 81520 | 2.1% | 1.2%(+0.888)#68 | 1.2%(+0.892)#4,226 |
| 69. | 81137 | 2.1% | 1.2%(+0.871)#69 | 1.2%(+0.876)#4,291 |
| 70. | 80207 | 2.1% | 1.2%(+0.864)#70 | 1.2%(+0.868)#4,316 |
| 71. | 81076 | 2.0% | 1.2%(+0.827)#71 | 1.2%(+0.832)#4,452 |
| 72. | 80911 | 2.0% | 1.2%(+0.823)#72 | 1.2%(+0.827)#4,471 |
| 73. | 80916 | 2.0% | 1.2%(+0.811)#73 | 1.2%(+0.815)#4,506 |
| 74. | 81630 | 2.0% | 1.2%(+0.794)#74 | 1.2%(+0.798)#4,561 |
| 75. | 80521 | 2.0% | 1.2%(+0.778)#75 | 1.2%(+0.782)#4,636 |
| 76. | 80603 | 2.0% | 1.2%(+0.776)#76 | 1.2%(+0.781)#4,641 |
| 77. | 81050 | 2.0% | 1.2%(+0.776)#77 | 1.2%(+0.780)#4,644 |
| 78. | 80215 | 1.9% | 1.2%(+0.751)#78 | 1.2%(+0.755)#4,743 |
| 79. | 81321 | 1.9% | 1.2%(+0.734)#79 | 1.2%(+0.738)#4,813 |
| 80. | 80514 | 1.9% | 1.2%(+0.724)#80 | 1.2%(+0.728)#4,864 |
| 81. | 81631 | 1.9% | 1.2%(+0.711)#81 | 1.2%(+0.715)#4,918 |
| 82. | 81601 | 1.9% | 1.2%(+0.708)#82 | 1.2%(+0.713)#4,928 |
| 83. | 81149 | 1.9% | 1.2%(+0.688)#83 | 1.2%(+0.692)#5,016 |
| 84. | 81007 | 1.9% | 1.2%(+0.688)#84 | 1.2%(+0.692)#5,018 |
| 85. | 80921 | 1.9% | 1.2%(+0.679)#85 | 1.2%(+0.684)#5,047 |
| 86. | 80910 | 1.9% | 1.2%(+0.664)#86 | 1.2%(+0.668)#5,121 |
| 87. | 80443 | 1.8% | 1.2%(+0.655)#87 | 1.2%(+0.659)#5,156 |
| 88. | 81022 | 1.8% | 1.2%(+0.649)#88 | 1.2%(+0.653)#5,179 |
| 89. | 81147 | 1.8% | 1.2%(+0.638)#89 | 1.2%(+0.642)#5,224 |
| 90. | 81632 | 1.8% | 1.2%(+0.636)#90 | 1.2%(+0.641)#5,236 |
| 91. | 80233 | 1.8% | 1.2%(+0.630)#91 | 1.2%(+0.634)#5,260 |
| 92. | 80005 | 1.8% | 1.2%(+0.621)#92 | 1.2%(+0.625)#5,298 |
| 93. | 80246 | 1.8% | 1.2%(+0.618)#93 | 1.2%(+0.622)#5,317 |
| 94. | 81323 | 1.8% | 1.2%(+0.602)#94 | 1.2%(+0.606)#5,391 |
| 95. | 80534 | 1.8% | 1.2%(+0.597)#95 | 1.2%(+0.601)#5,408 |
| 96. | 81008 | 1.8% | 1.2%(+0.593)#96 | 1.2%(+0.597)#5,431 |
| 97. | 80904 | 1.8% | 1.2%(+0.587)#97 | 1.2%(+0.591)#5,463 |
| 98. | 80917 | 1.8% | 1.2%(+0.569)#98 | 1.2%(+0.573)#5,548 |
| 99. | 80010 | 1.7% | 1.2%(+0.557)#99 | 1.2%(+0.562)#5,593 |
| 100. | 80016 | 1.7% | 1.2%(+0.536)#100 | 1.2%(+0.541)#5,702 |
Common Questions
What are the Top 10 Zip Codes with the Highest Percentage of Population Employed in Firefighting & Prevention in Colorado?
Top 10 Zip Codes with the Highest Percentage of Population Employed in Firefighting & Prevention in Colorado are:
What zip code has the Highest Percentage of Population Employed in Firefighting & Prevention in Colorado?
80622 has the Highest Percentage of Population Employed in Firefighting & Prevention in Colorado with 42.4%.
What is the Percentage of Population Employed in Firefighting & Prevention in the State of Colorado?
Percentage of Population Employed in Firefighting & Prevention in Colorado is 1.2%.
What is the Percentage of Population Employed in Firefighting & Prevention in the United States?
Percentage of Population Employed in Firefighting & Prevention in the United States is 1.2%.