El Moro, CO Map & Demographics
El Moro Map
El Moro Overview
$38,084
PER CAPITA INCOME
$104,722
AVG FAMILY INCOME
$91,250
AVG HOUSEHOLD INCOME
16.2%
WAGE / INCOME GAP [ % ]
83.8¢/ $1
WAGE / INCOME GAP [ $ ]
0.18
INEQUALITY / GINI INDEX
220
TOTAL POPULATION
121
MALE POPULATION
99
FEMALE POPULATION
122.22
MALES / 100 FEMALES
81.82
FEMALES / 100 MALES
51.4
MEDIAN AGE
2.7
AVG FAMILY SIZE
2.3
AVG HOUSEHOLD SIZE
173
LABOR FORCE [ PEOPLE ]
87.4%
PERCENT IN LABOR FORCE
5.8%
UNEMPLOYMENT RATE
Income in El Moro
Income Overview in El Moro
Per Capita Income in El Moro is $38,084, while median incomes of families and households are $104,722 and $91,250 respectively.
| Characteristic | Number | Measure |
| Per Capita Income | 220 | $38,084 |
| Median Family Income | 68 | $104,722 |
| Mean Family Income | 68 | $108,946 |
| Median Household Income | 94 | $91,250 |
| Mean Household Income | 94 | $96,170 |
| Income Deficit | 68 | $0 |
| Wage / Income Gap (%) | 220 | 16.16% |
| Wage / Income Gap ($) | 220 | 83.84¢ per $1 |
| Gini / Inequality Index | 220 | 0.18 |
Earnings by Sex in El Moro
Average Earnings in El Moro are $37,188, $43,611 for men and $36,563 for women, a difference of 16.2%.
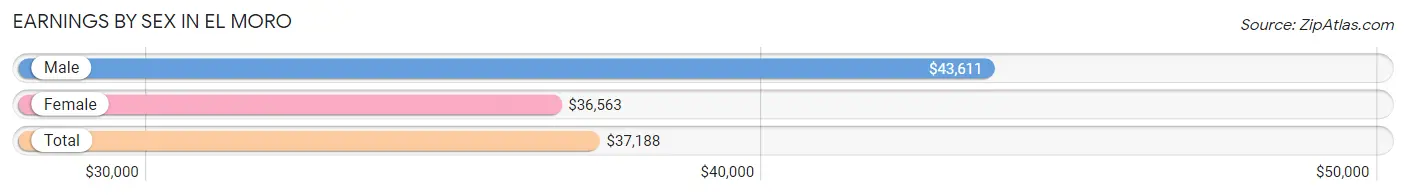
| Sex | Number | Average Earnings |
| Male | 88 (51.8%) | $43,611 |
| Female | 82 (48.2%) | $36,563 |
| Total | 170 (100.0%) | $37,188 |
Earnings by Sex by Income Bracket in El Moro
The most common earnings brackets in El Moro are $50,000 to $54,999 for men (17 | 19.3%) and $55,000 to $64,999 for women (18 | 22.0%).
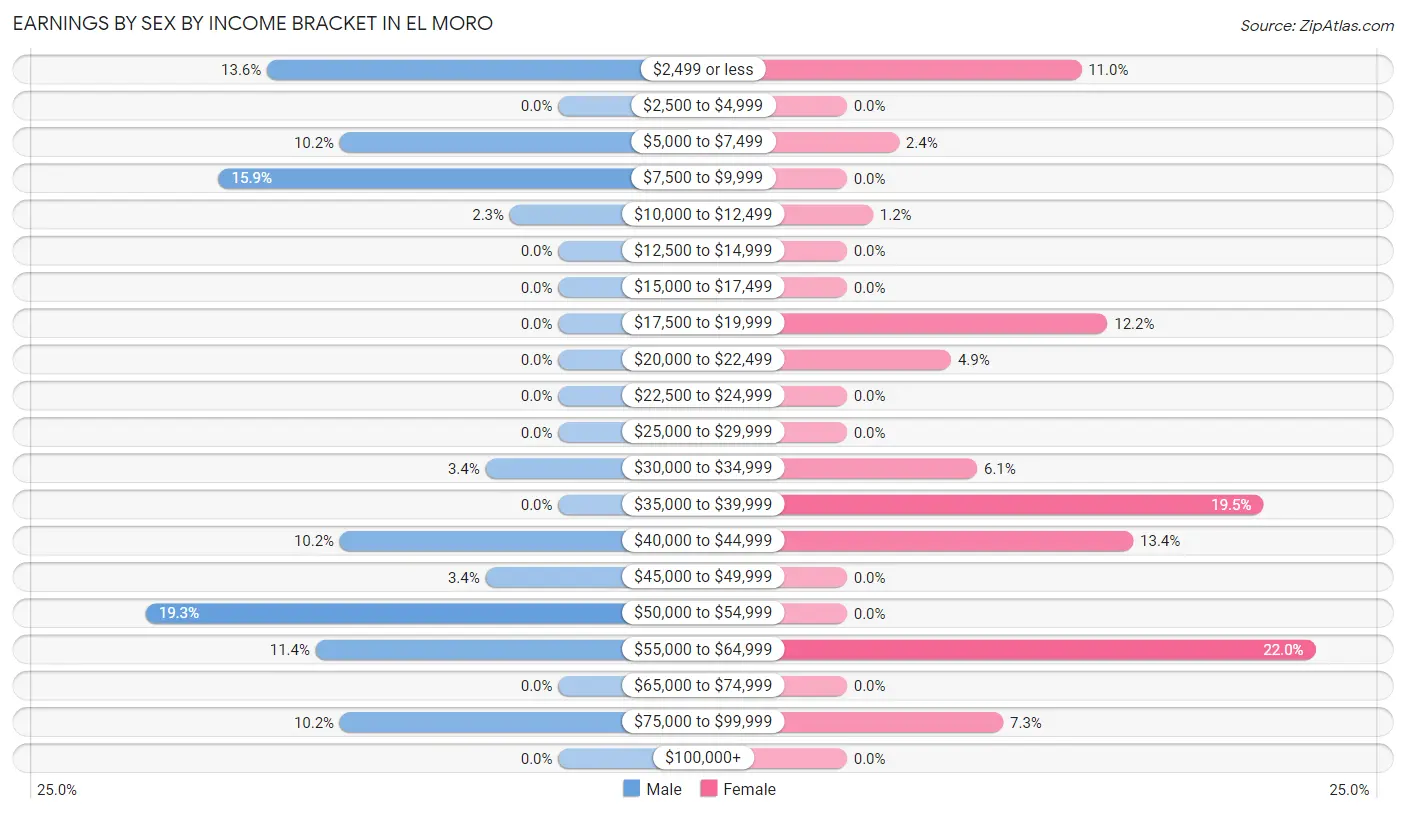
| Income | Male | Female |
| $2,499 or less | 12 (13.6%) | 9 (11.0%) |
| $2,500 to $4,999 | 0 (0.0%) | 0 (0.0%) |
| $5,000 to $7,499 | 9 (10.2%) | 2 (2.4%) |
| $7,500 to $9,999 | 14 (15.9%) | 0 (0.0%) |
| $10,000 to $12,499 | 2 (2.3%) | 1 (1.2%) |
| $12,500 to $14,999 | 0 (0.0%) | 0 (0.0%) |
| $15,000 to $17,499 | 0 (0.0%) | 0 (0.0%) |
| $17,500 to $19,999 | 0 (0.0%) | 10 (12.2%) |
| $20,000 to $22,499 | 0 (0.0%) | 4 (4.9%) |
| $22,500 to $24,999 | 0 (0.0%) | 0 (0.0%) |
| $25,000 to $29,999 | 0 (0.0%) | 0 (0.0%) |
| $30,000 to $34,999 | 3 (3.4%) | 5 (6.1%) |
| $35,000 to $39,999 | 0 (0.0%) | 16 (19.5%) |
| $40,000 to $44,999 | 9 (10.2%) | 11 (13.4%) |
| $45,000 to $49,999 | 3 (3.4%) | 0 (0.0%) |
| $50,000 to $54,999 | 17 (19.3%) | 0 (0.0%) |
| $55,000 to $64,999 | 10 (11.4%) | 18 (22.0%) |
| $65,000 to $74,999 | 0 (0.0%) | 0 (0.0%) |
| $75,000 to $99,999 | 9 (10.2%) | 6 (7.3%) |
| $100,000+ | 0 (0.0%) | 0 (0.0%) |
| Total | 88 (100.0%) | 82 (100.0%) |
Earnings by Sex by Educational Attainment in El Moro
Average earnings in El Moro are $49,167 for men and $37,266 for women, a difference of 24.2%. Men with an educational attainment of college or associate's degree enjoy the highest average annual earnings of $43,750, while those with college or associate's degree education earn the least with $43,750. Women with an educational attainment of college or associate's degree earn the most with the average annual earnings of $36,964, while those with college or associate's degree education have the smallest earnings of $36,964.
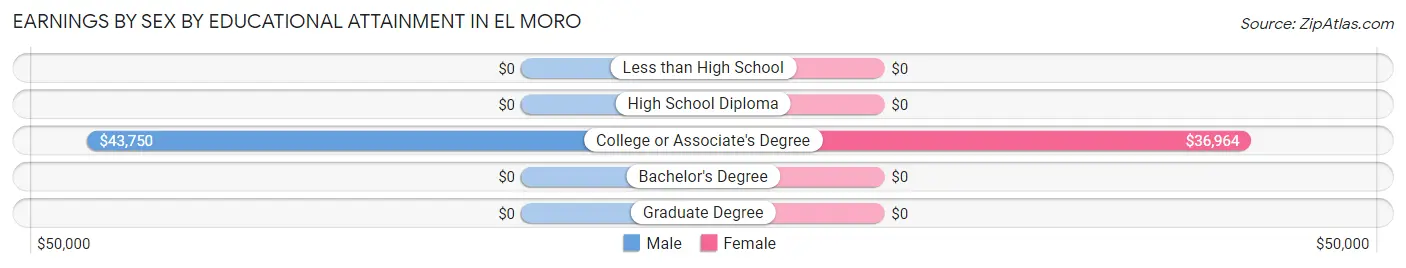
| Educational Attainment | Male Income | Female Income |
| Less than High School | - | - |
| High School Diploma | - | - |
| College or Associate's Degree | $43,750 | $36,964 |
| Bachelor's Degree | - | - |
| Graduate Degree | - | - |
| Total | $49,167 | $37,266 |
Family Income in El Moro
Family Income Brackets in El Moro
According to the El Moro family income data, there are 29 families falling into the $100,000 to $149,999 income range, which is the most common income bracket and makes up 42.6% of all families.
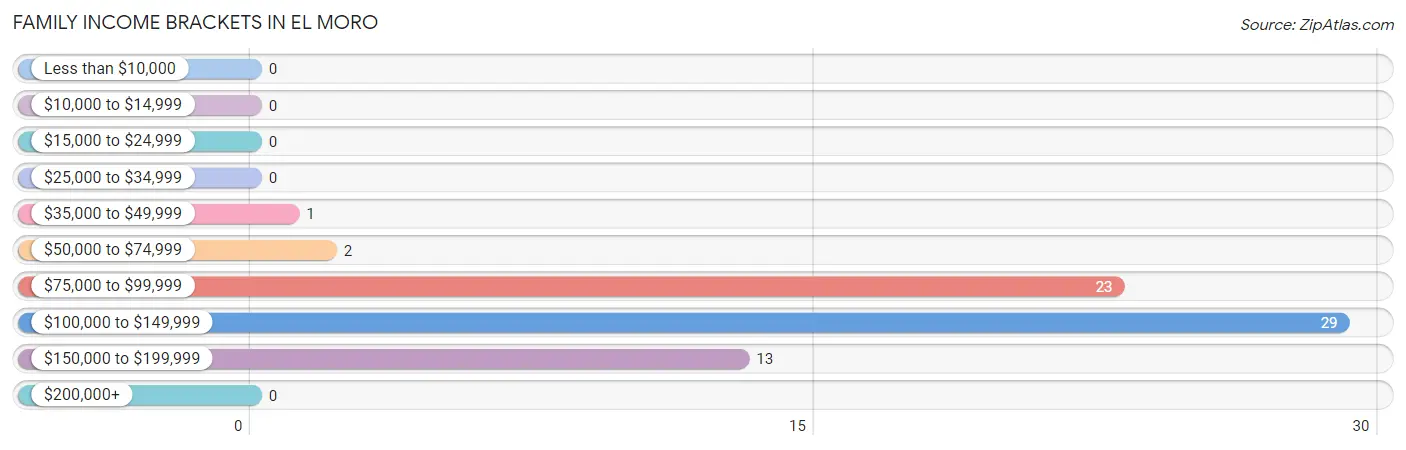
| Income Bracket | # Families | % Families |
| Less than $10,000 | 0 | 0.0% |
| $10,000 to $14,999 | 0 | 0.0% |
| $15,000 to $24,999 | 0 | 0.0% |
| $25,000 to $34,999 | 0 | 0.0% |
| $35,000 to $49,999 | 1 | 1.5% |
| $50,000 to $74,999 | 2 | 2.9% |
| $75,000 to $99,999 | 23 | 33.8% |
| $100,000 to $149,999 | 29 | 42.6% |
| $150,000 to $199,999 | 13 | 19.1% |
| $200,000+ | 0 | 0.0% |
Family Income by Famaliy Size in El Moro
2-person families (38 | 55.9%) account for the highest median family income in El Moro with $104,167 per family, while 2-person families (38 | 55.9%) have the highest median income of $52,084 per family member.
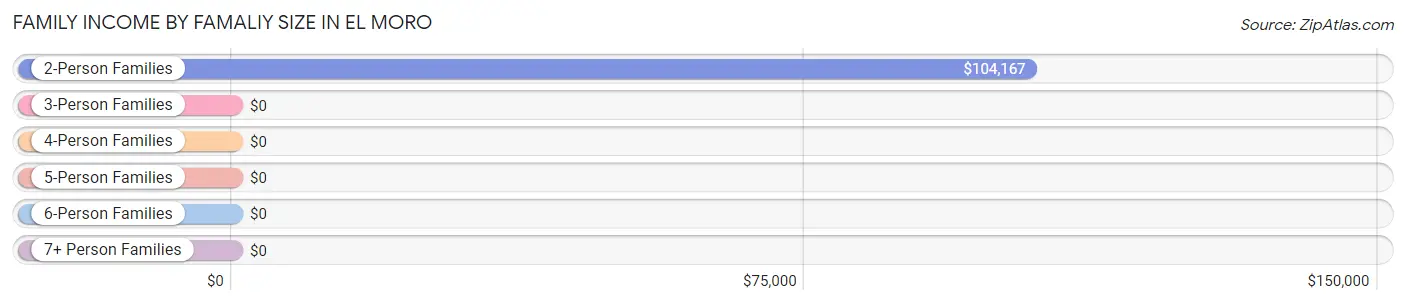
| Income Bracket | # Families | Median Income |
| 2-Person Families | 38 (55.9%) | $104,167 |
| 3-Person Families | 21 (30.9%) | $0 |
| 4-Person Families | 2 (2.9%) | $0 |
| 5-Person Families | 7 (10.3%) | $0 |
| 6-Person Families | 0 (0.0%) | $0 |
| 7+ Person Families | 0 (0.0%) | $0 |
| Total | 68 (100.0%) | $104,722 |
Family Income by Number of Earners in El Moro
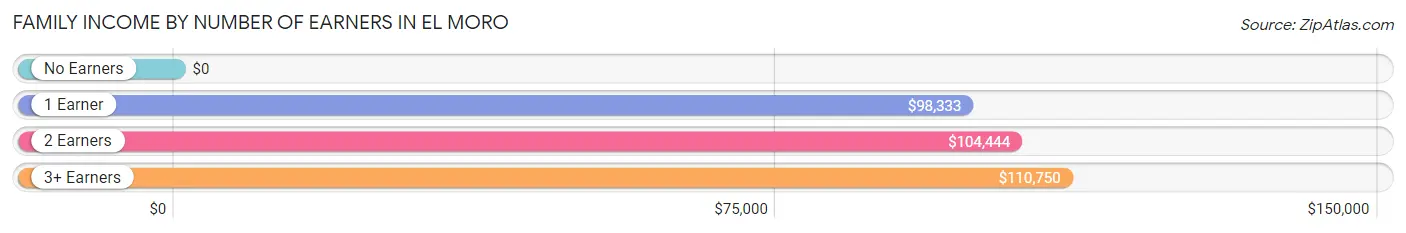
| Number of Earners | # Families | Median Income |
| No Earners | 0 (0.0%) | $0 |
| 1 Earner | 18 (26.5%) | $98,333 |
| 2 Earners | 22 (32.4%) | $104,444 |
| 3+ Earners | 28 (41.2%) | $110,750 |
| Total | 68 (100.0%) | $104,722 |
Household Income in El Moro
Household Income Brackets in El Moro
With 29 households falling in the category, the $100,000 to $149,999 income range is the most frequent in El Moro, accounting for 30.8% of all households.
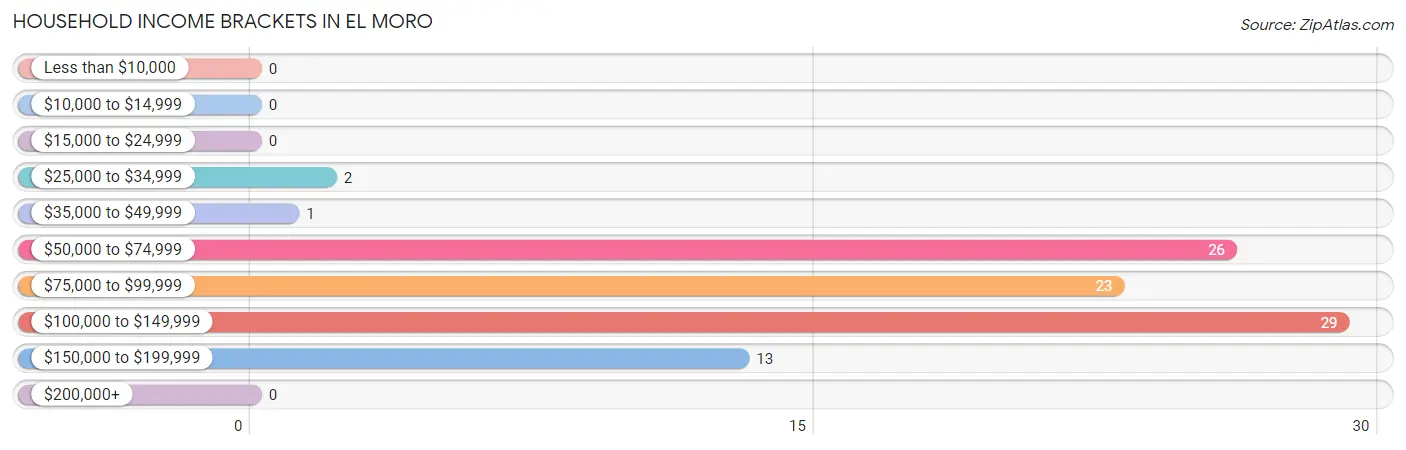
| Income Bracket | # Households | % Households |
| Less than $10,000 | 0 | 0.0% |
| $10,000 to $14,999 | 0 | 0.0% |
| $15,000 to $24,999 | 0 | 0.0% |
| $25,000 to $34,999 | 2 | 2.1% |
| $35,000 to $49,999 | 1 | 1.1% |
| $50,000 to $74,999 | 26 | 27.7% |
| $75,000 to $99,999 | 23 | 24.5% |
| $100,000 to $149,999 | 29 | 30.9% |
| $150,000 to $199,999 | 13 | 13.8% |
| $200,000+ | 0 | 0.0% |
Household Income by Householder Age in El Moro
The median household income in El Moro is $91,250, with the highest median household income of $103,611 found in the 45 to 64 years age bracket for the primary householder. A total of 42 households (44.7%) fall into this category.
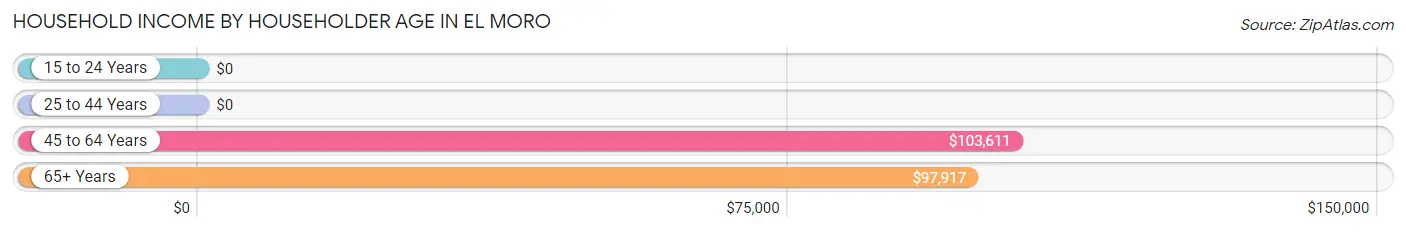
| Income Bracket | # Households | Median Income |
| 15 to 24 Years | 0 (0.0%) | $0 |
| 25 to 44 Years | 13 (13.8%) | $0 |
| 45 to 64 Years | 42 (44.7%) | $103,611 |
| 65+ Years | 39 (41.5%) | $97,917 |
| Total | 94 (100.0%) | $91,250 |
Poverty in El Moro
Income Below Poverty by Sex and Age in El Moro
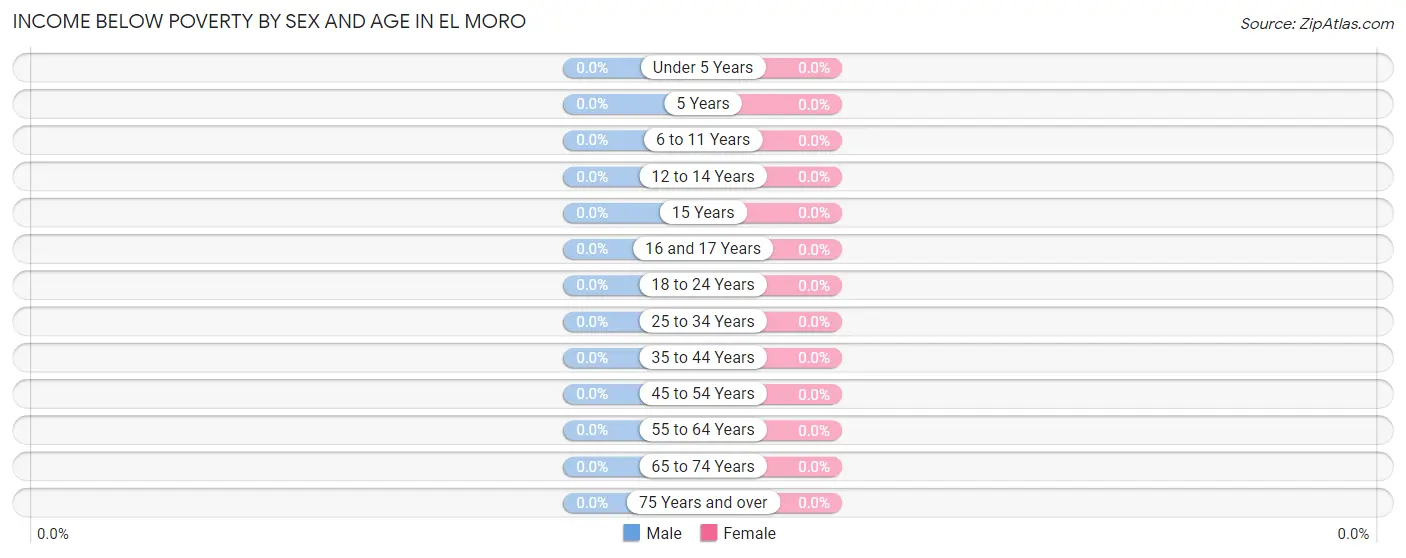
| Age Bracket | Male | Female |
| Under 5 Years | 0 (0.0%) | 0 (0.0%) |
| 5 Years | 0 (0.0%) | 0 (0.0%) |
| 6 to 11 Years | 0 (0.0%) | 0 (0.0%) |
| 12 to 14 Years | 0 (0.0%) | 0 (0.0%) |
| 15 Years | 0 (0.0%) | 0 (0.0%) |
| 16 and 17 Years | 0 (0.0%) | 0 (0.0%) |
| 18 to 24 Years | 0 (0.0%) | 0 (0.0%) |
| 25 to 34 Years | 0 (0.0%) | 0 (0.0%) |
| 35 to 44 Years | 0 (0.0%) | 0 (0.0%) |
| 45 to 54 Years | 0 (0.0%) | 0 (0.0%) |
| 55 to 64 Years | 0 (0.0%) | 0 (0.0%) |
| 65 to 74 Years | 0 (0.0%) | 0 (0.0%) |
| 75 Years and over | 0 (0.0%) | 0 (0.0%) |
| Total | 0 (0.0%) | 0 (0.0%) |
Income Above Poverty by Sex and Age in El Moro
According to the poverty statistics in El Moro, males aged under 5 years and females aged 6 to 11 years are the age groups that are most secure financially, with 100.0% of males and 100.0% of females in these age groups living above the poverty line.
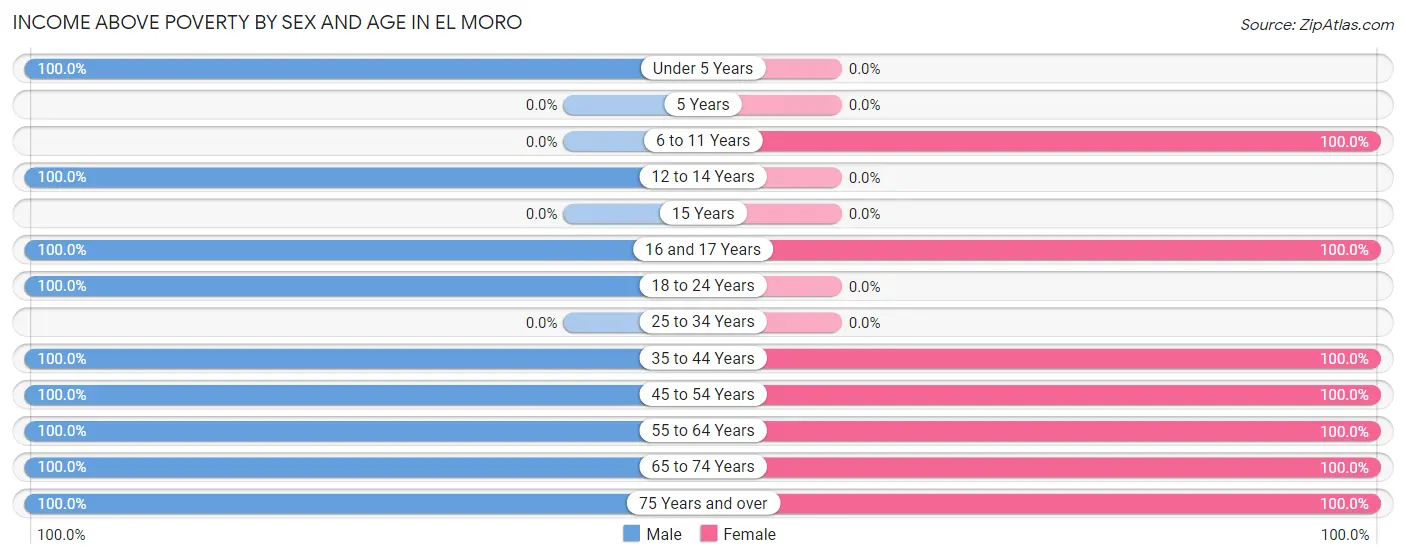
| Age Bracket | Male | Female |
| Under 5 Years | 16 (100.0%) | 0 (0.0%) |
| 5 Years | 0 (0.0%) | 0 (0.0%) |
| 6 to 11 Years | 0 (0.0%) | 4 (100.0%) |
| 12 to 14 Years | 2 (100.0%) | 0 (0.0%) |
| 15 Years | 0 (0.0%) | 0 (0.0%) |
| 16 and 17 Years | 7 (100.0%) | 9 (100.0%) |
| 18 to 24 Years | 7 (100.0%) | 0 (0.0%) |
| 25 to 34 Years | 0 (0.0%) | 0 (0.0%) |
| 35 to 44 Years | 17 (100.0%) | 17 (100.0%) |
| 45 to 54 Years | 6 (100.0%) | 28 (100.0%) |
| 55 to 64 Years | 37 (100.0%) | 17 (100.0%) |
| 65 to 74 Years | 11 (100.0%) | 14 (100.0%) |
| 75 Years and over | 18 (100.0%) | 10 (100.0%) |
| Total | 121 (100.0%) | 99 (100.0%) |
Income Below Poverty Among Married-Couple Families in El Moro
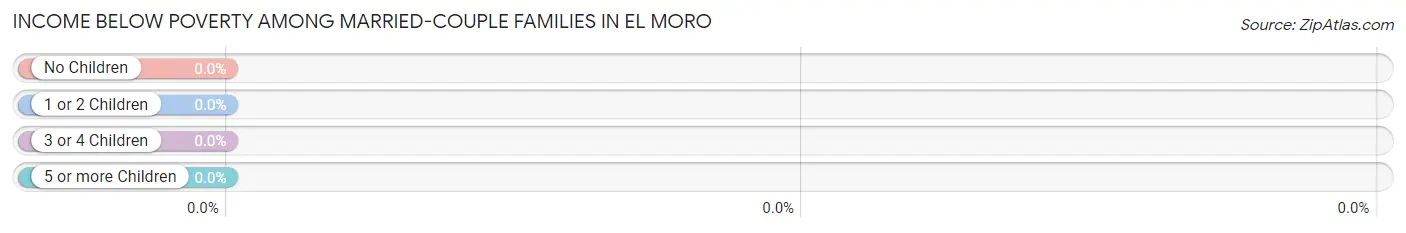
| Children | Above Poverty | Below Poverty |
| No Children | 38 (100.0%) | 0 (0.0%) |
| 1 or 2 Children | 20 (100.0%) | 0 (0.0%) |
| 3 or 4 Children | 0 (0.0%) | 0 (0.0%) |
| 5 or more Children | 0 (0.0%) | 0 (0.0%) |
| Total | 58 (100.0%) | 0 (0.0%) |
Income Below Poverty Among Single-Parent Households in El Moro
| Children | Single Father | Single Mother |
| No Children | 0 (0.0%) | 0 (0.0%) |
| 1 or 2 Children | 0 (0.0%) | 0 (0.0%) |
| 3 or 4 Children | 0 (0.0%) | 0 (0.0%) |
| 5 or more Children | 0 (0.0%) | 0 (0.0%) |
| Total | 0 (0.0%) | 0 (0.0%) |
Income Below Poverty Among Married-Couple vs Single-Parent Households in El Moro
| Children | Married-Couple Families | Single-Parent Households |
| No Children | 0 (0.0%) | 0 (0.0%) |
| 1 or 2 Children | 0 (0.0%) | 0 (0.0%) |
| 3 or 4 Children | 0 (0.0%) | 0 (0.0%) |
| 5 or more Children | 0 (0.0%) | 0 (0.0%) |
| Total | 0 (0.0%) | 0 (0.0%) |
Race in El Moro
The most populous races in El Moro are White / Caucasian (186 | 84.6%), Hispanic or Latino (47 | 21.4%), and Two or more Races (18 | 8.2%).
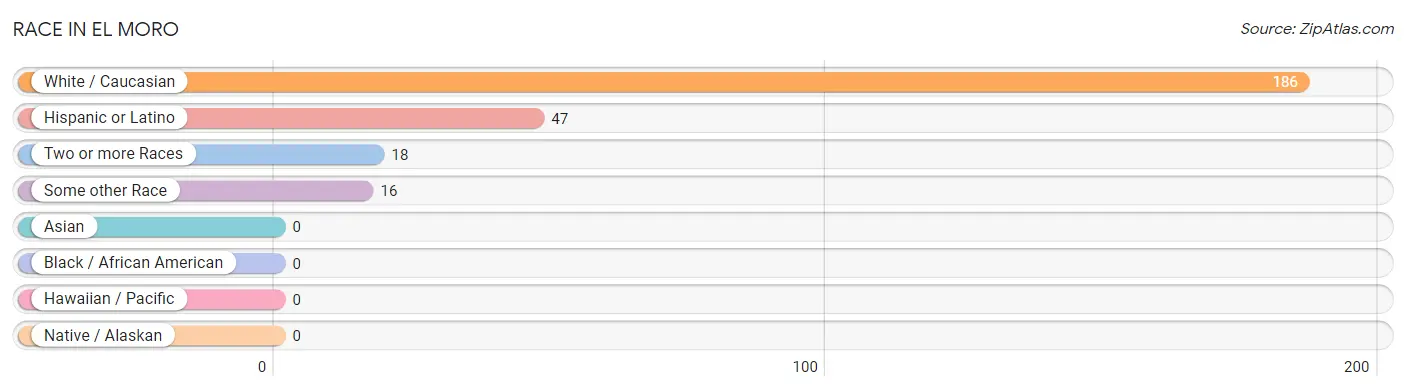
| Race | # Population | % Population |
| Asian | 0 | 0.0% |
| Black / African American | 0 | 0.0% |
| Hawaiian / Pacific | 0 | 0.0% |
| Hispanic or Latino | 47 | 21.4% |
| Native / Alaskan | 0 | 0.0% |
| White / Caucasian | 186 | 84.6% |
| Two or more Races | 18 | 8.2% |
| Some other Race | 16 | 7.3% |
| Total | 220 | 100.0% |
Ancestry in El Moro
The most populous ancestries reported in El Moro are Italian (83 | 37.7%), German (77 | 35.0%), Polish (37 | 16.8%), English (33 | 15.0%), and Spaniard (27 | 12.3%), together accounting for 116.8% of all El Moro residents.
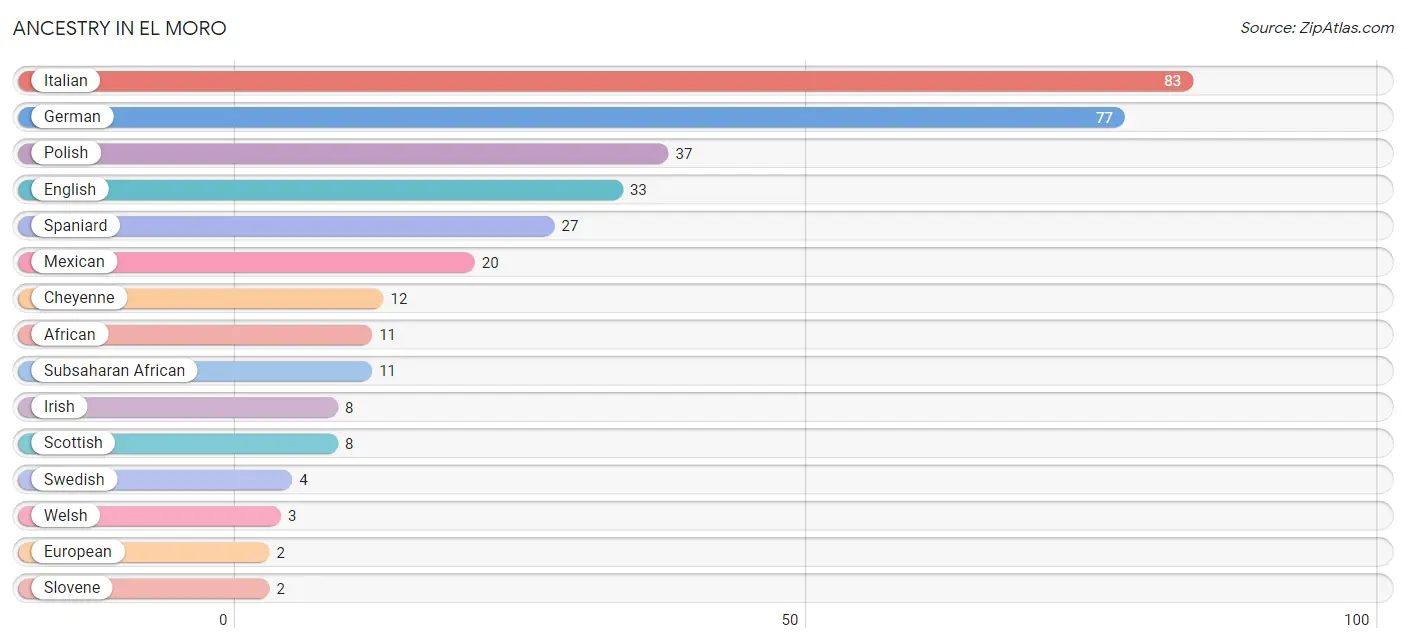
| Ancestry | # Population | % Population |
| African | 11 | 5.0% |
| Cheyenne | 12 | 5.4% |
| English | 33 | 15.0% |
| European | 2 | 0.9% |
| German | 77 | 35.0% |
| Irish | 8 | 3.6% |
| Italian | 83 | 37.7% |
| Mexican | 20 | 9.1% |
| Polish | 37 | 16.8% |
| Scottish | 8 | 3.6% |
| Slovene | 2 | 0.9% |
| Spaniard | 27 | 12.3% |
| Subsaharan African | 11 | 5.0% |
| Swedish | 4 | 1.8% |
| Welsh | 3 | 1.4% | View All 15 Rows |
Immigrants in El Moro
The most numerous immigrant groups reported in El Moro came from Europe (2 | 0.9%), Germany (2 | 0.9%), and Western Europe (2 | 0.9%), together accounting for 2.7% of all El Moro residents.
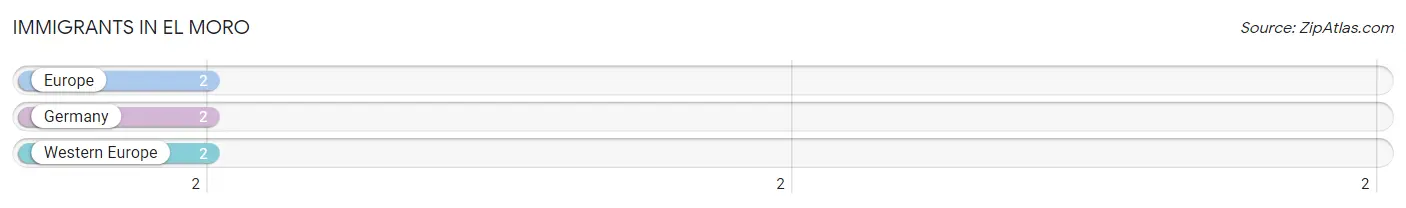
| Immigration Origin | # Population | % Population |
| Europe | 2 | 0.9% |
| Germany | 2 | 0.9% |
| Western Europe | 2 | 0.9% | View All 3 Rows |
Sex and Age in El Moro
Sex and Age in El Moro
The most populous age groups in El Moro are 60 to 64 Years (24 | 19.8%) for men and 45 to 49 Years (17 | 17.2%) for women.
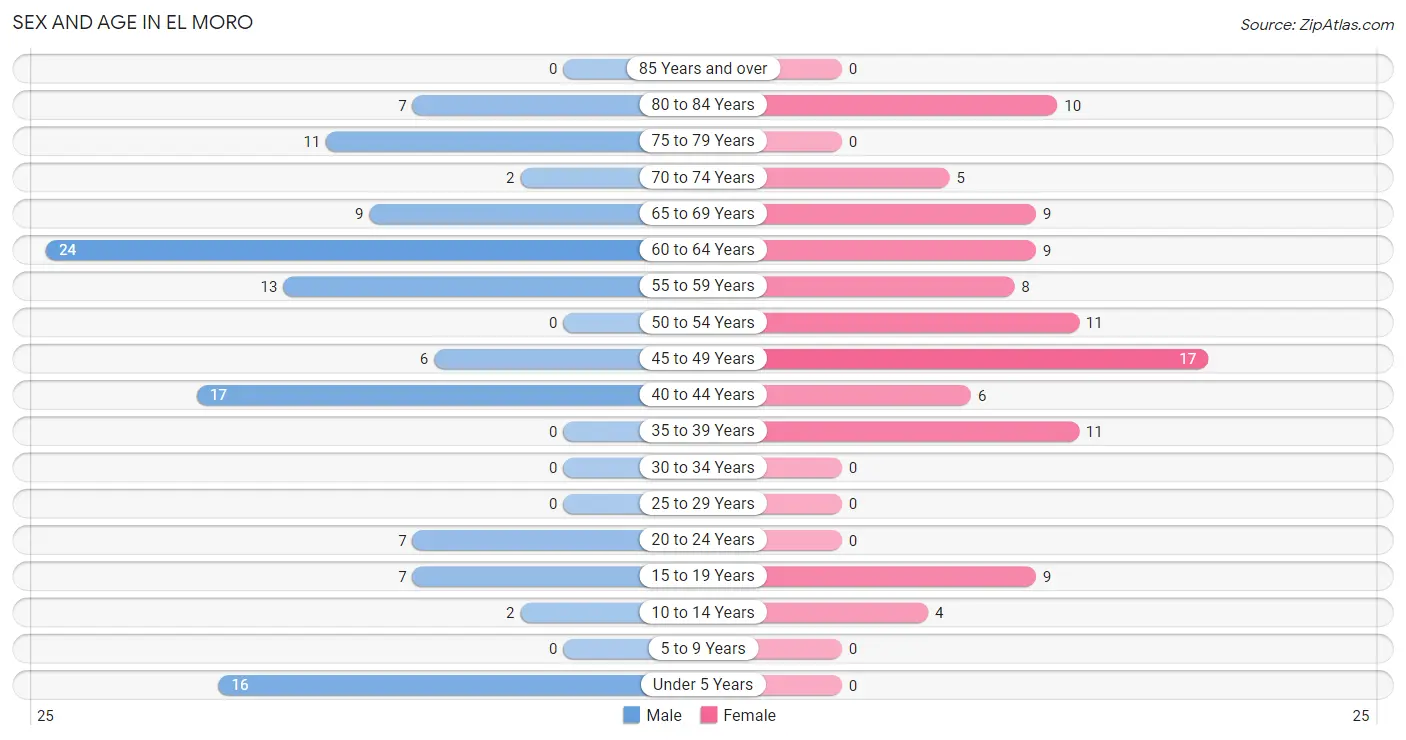
| Age Bracket | Male | Female |
| Under 5 Years | 16 (13.2%) | 0 (0.0%) |
| 5 to 9 Years | 0 (0.0%) | 0 (0.0%) |
| 10 to 14 Years | 2 (1.7%) | 4 (4.0%) |
| 15 to 19 Years | 7 (5.8%) | 9 (9.1%) |
| 20 to 24 Years | 7 (5.8%) | 0 (0.0%) |
| 25 to 29 Years | 0 (0.0%) | 0 (0.0%) |
| 30 to 34 Years | 0 (0.0%) | 0 (0.0%) |
| 35 to 39 Years | 0 (0.0%) | 11 (11.1%) |
| 40 to 44 Years | 17 (14.1%) | 6 (6.1%) |
| 45 to 49 Years | 6 (5.0%) | 17 (17.2%) |
| 50 to 54 Years | 0 (0.0%) | 11 (11.1%) |
| 55 to 59 Years | 13 (10.7%) | 8 (8.1%) |
| 60 to 64 Years | 24 (19.8%) | 9 (9.1%) |
| 65 to 69 Years | 9 (7.4%) | 9 (9.1%) |
| 70 to 74 Years | 2 (1.7%) | 5 (5.1%) |
| 75 to 79 Years | 11 (9.1%) | 0 (0.0%) |
| 80 to 84 Years | 7 (5.8%) | 10 (10.1%) |
| 85 Years and over | 0 (0.0%) | 0 (0.0%) |
| Total | 121 (100.0%) | 99 (100.0%) |
Families and Households in El Moro
Median Family Size in El Moro
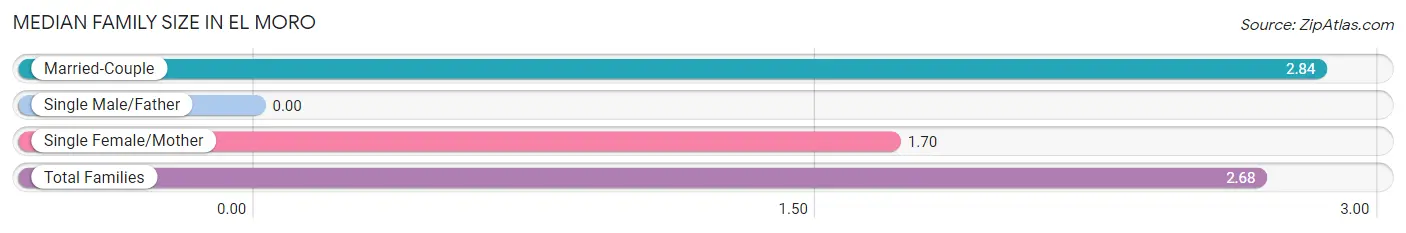
| Family Type | # Families | Family Size |
| Married-Couple | 58 (85.3%) | 2.84 |
| Single Male/Father | 0 (0.0%) | - |
| Single Female/Mother | 10 (14.7%) | 1.70 |
| Total Families | 68 (100.0%) | 2.68 |
Median Household Size in El Moro
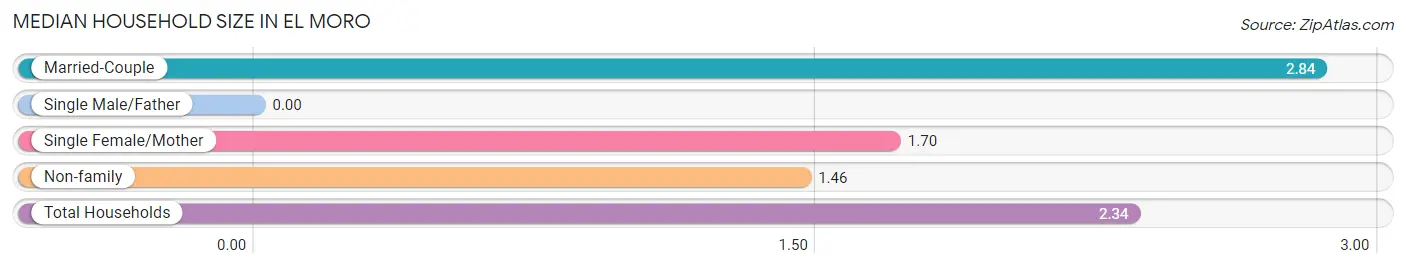
| Household Type | # Households | Household Size |
| Married-Couple | 58 (61.7%) | 2.84 |
| Single Male/Father | 0 (0.0%) | - |
| Single Female/Mother | 10 (10.6%) | 1.70 |
| Non-family | 26 (27.7%) | 1.46 |
| Total Households | 94 (100.0%) | 2.34 |
Household Size by Marriage Status in El Moro
Out of a total of 94 households in El Moro, 68 (72.3%) are family households, while 26 (27.7%) are nonfamily households. The most numerous type of family households are 2-person households, comprising 38, and the most common type of nonfamily households are 2-person households, comprising 15.
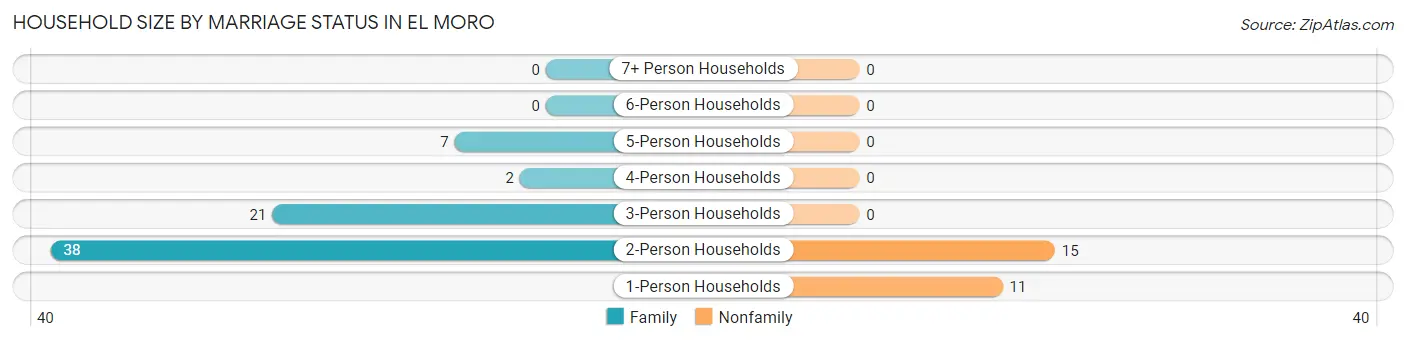
| Household Size | Family Households | Nonfamily Households |
| 1-Person Households | - | 11 (11.7%) |
| 2-Person Households | 38 (40.4%) | 15 (16.0%) |
| 3-Person Households | 21 (22.3%) | 0 (0.0%) |
| 4-Person Households | 2 (2.1%) | 0 (0.0%) |
| 5-Person Households | 7 (7.4%) | 0 (0.0%) |
| 6-Person Households | 0 (0.0%) | 0 (0.0%) |
| 7+ Person Households | 0 (0.0%) | 0 (0.0%) |
| Total | 68 (72.3%) | 26 (27.7%) |
Female Fertility in El Moro
Fertility by Age in El Moro
| Age Bracket | Women with Births | Births / 1,000 Women |
| 15 to 19 years | 0 (0.0%) | 0.0 |
| 20 to 34 years | 0 (0.0%) | 0.0 |
| 35 to 50 years | 0 (0.0%) | 0.0 |
| Total | 0 (0.0%) | 0.0 |
Fertility by Age by Marriage Status in El Moro
| Age Bracket | Married | Unmarried |
| 15 to 19 years | 0 (0.0%) | 0 (0.0%) |
| 20 to 34 years | 0 (0.0%) | 0 (0.0%) |
| 35 to 50 years | 0 (0.0%) | 0 (0.0%) |
| Total | 0 (0.0%) | 0 (0.0%) |
Fertility by Education in El Moro
| Educational Attainment | Women with Births | Births / 1,000 Women |
| Less than High School | 0 (0.0%) | 0.0 |
| High School Diploma | 0 (0.0%) | 0.0 |
| College or Associate's Degree | 0 (0.0%) | 0.0 |
| Bachelor's Degree | 0 (0.0%) | 0.0 |
| Graduate Degree | 0 (0.0%) | 0.0 |
| Total | 0 (0.0%) | 0.0 |
Fertility by Education by Marriage Status in El Moro
| Educational Attainment | Married | Unmarried |
| Less than High School | 0 (0.0%) | 0 (0.0%) |
| High School Diploma | 0 (0.0%) | 0 (0.0%) |
| College or Associate's Degree | 0 (0.0%) | 0 (0.0%) |
| Bachelor's Degree | 0 (0.0%) | 0 (0.0%) |
| Graduate Degree | 0 (0.0%) | 0 (0.0%) |
| Total | 0 (0.0%) | 0 (0.0%) |
Employment Characteristics in El Moro
Employment by Class of Employer in El Moro
Among the 163 employed individuals in El Moro, private company employees (52 | 31.9%), state government employees (44 | 27.0%), and self-employed (not incorporated) (24 | 14.7%) make up the most common classes of employment.
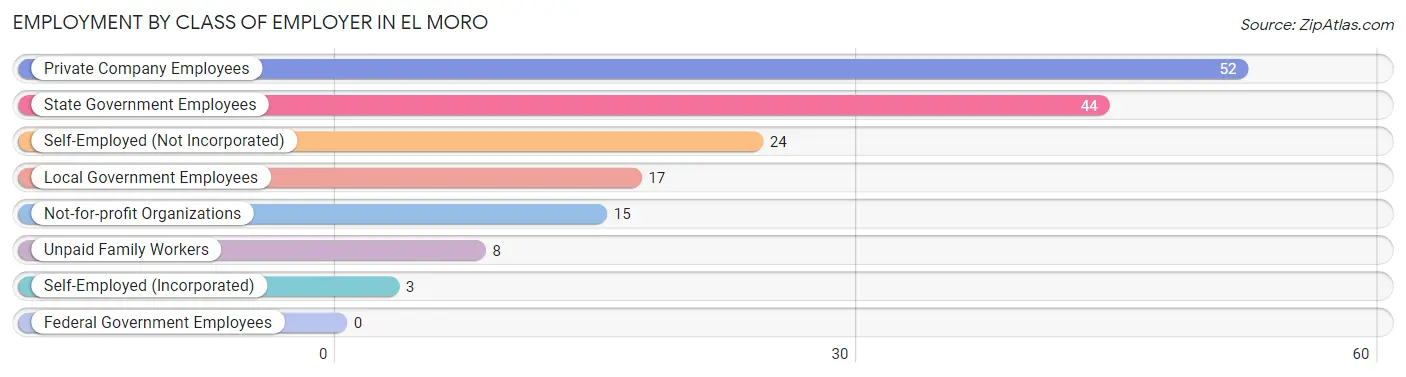
| Employer Class | # Employees | % Employees |
| Private Company Employees | 52 | 31.9% |
| Self-Employed (Incorporated) | 3 | 1.8% |
| Self-Employed (Not Incorporated) | 24 | 14.7% |
| Not-for-profit Organizations | 15 | 9.2% |
| Local Government Employees | 17 | 10.4% |
| State Government Employees | 44 | 27.0% |
| Federal Government Employees | 0 | 0.0% |
| Unpaid Family Workers | 8 | 4.9% |
| Total | 163 | 100.0% |
Employment Status by Age in El Moro
According to the labor force statistics for El Moro, out of the total population over 16 years of age (198), 87.4% or 173 individuals are in the labor force, with 5.8% or 10 of them unemployed. The age group with the highest labor force participation rate is 16 to 19 years, with 100.0% or 16 individuals in the labor force. Within the labor force, the 45 to 54 years age range has the highest percentage of unemployed individuals, with 34.5% or 10 of them being unemployed.
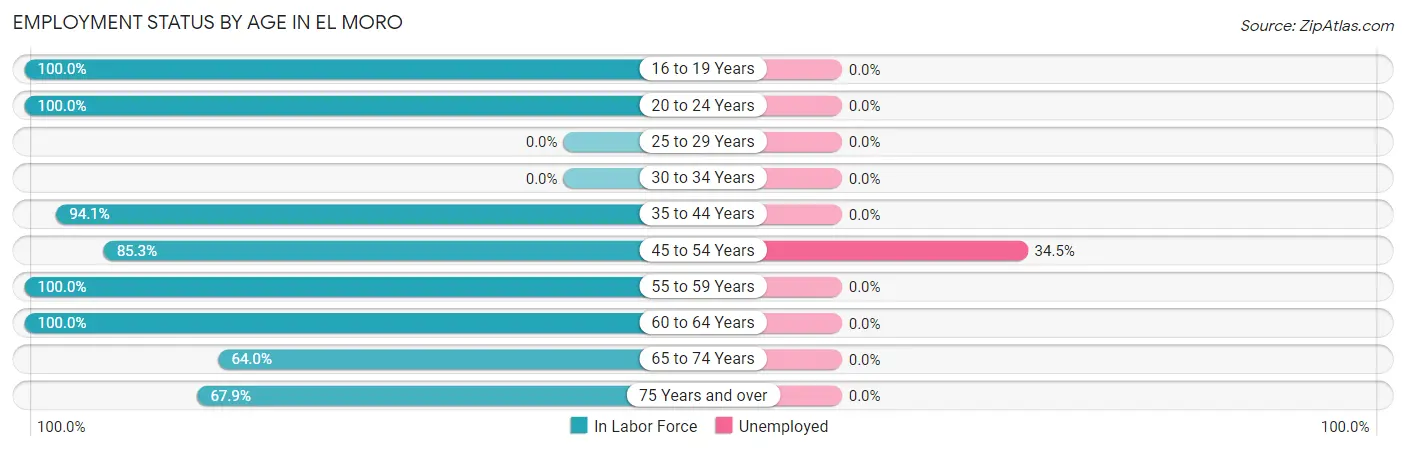
| Age Bracket | In Labor Force | Unemployed |
| 16 to 19 Years | 16 (100.0%) | 0 (0.0%) |
| 20 to 24 Years | 7 (100.0%) | 0 (0.0%) |
| 25 to 29 Years | 0 (0.0%) | 0 (0.0%) |
| 30 to 34 Years | 0 (0.0%) | 0 (0.0%) |
| 35 to 44 Years | 32 (94.1%) | 0 (0.0%) |
| 45 to 54 Years | 29 (85.3%) | 10 (34.5%) |
| 55 to 59 Years | 21 (100.0%) | 0 (0.0%) |
| 60 to 64 Years | 33 (100.0%) | 0 (0.0%) |
| 65 to 74 Years | 16 (64.0%) | 0 (0.0%) |
| 75 Years and over | 19 (67.9%) | 0 (0.0%) |
| Total | 173 (87.4%) | 10 (5.8%) |
Employment Status by Educational Attainment in El Moro
According to labor force statistics for El Moro, 94.3% of individuals (115) out of the total population between 25 and 64 years of age (122) are in the labor force, with 8.7% or 10 of them being unemployed. The group with the highest labor force participation rate are those with the educational attainment of high school diploma, with 100.0% or 18 individuals in the labor force. Within the labor force, individuals with college / associate degree education have the highest percentage of unemployment, with 12.8% or 10 of them being unemployed.
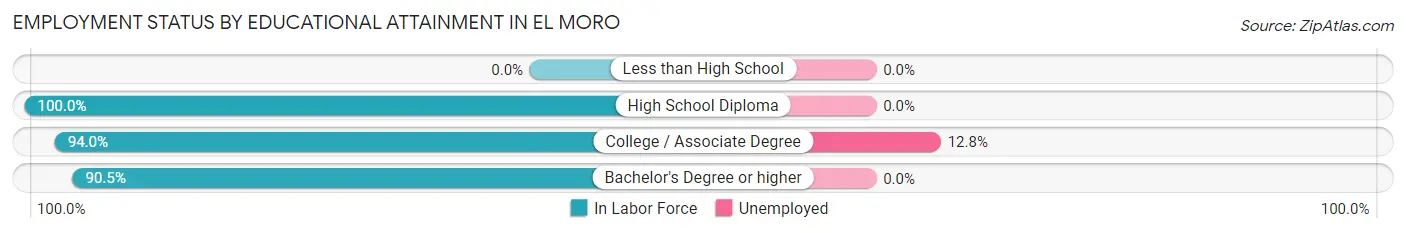
| Educational Attainment | In Labor Force | Unemployed |
| Less than High School | 0 (0.0%) | 0 (0.0%) |
| High School Diploma | 18 (100.0%) | 0 (0.0%) |
| College / Associate Degree | 78 (94.0%) | 11 (12.8%) |
| Bachelor's Degree or higher | 19 (90.5%) | 0 (0.0%) |
| Total | 115 (94.3%) | 11 (8.7%) |
Employment Occupations by Sex in El Moro
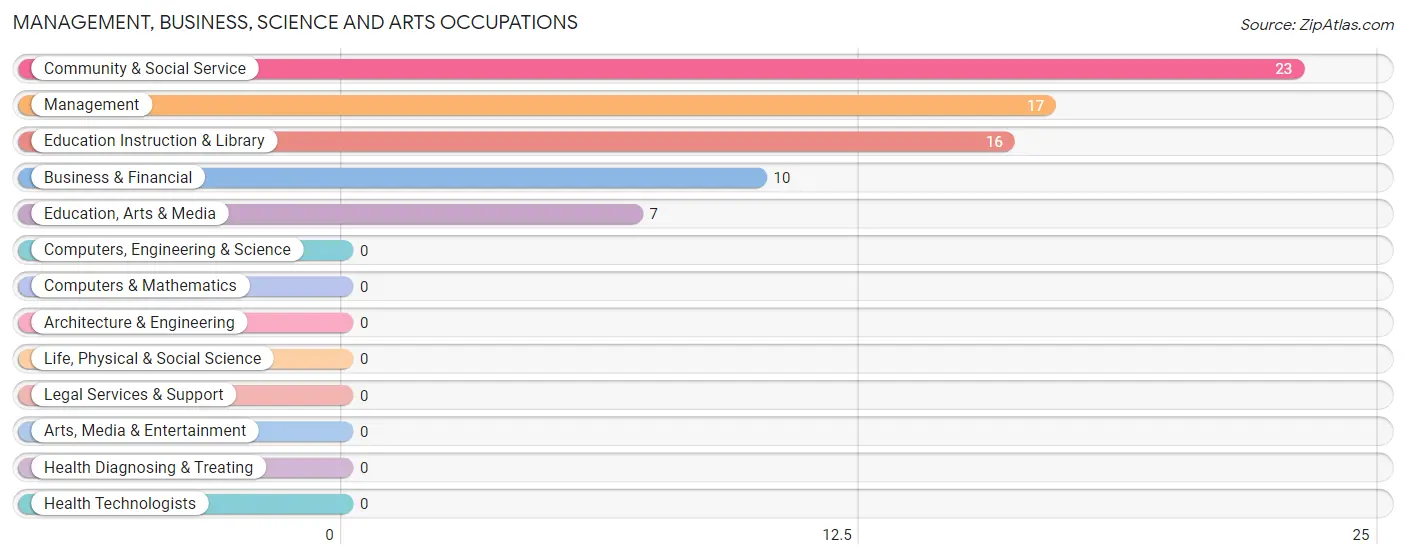
Management, Business, Science and Arts Occupations
The most common Management, Business, Science and Arts occupations in El Moro are Community & Social Service (23 | 14.1%), Management (17 | 10.4%), Education Instruction & Library (16 | 9.8%), Business & Financial (10 | 6.1%), and Education, Arts & Media (7 | 4.3%).
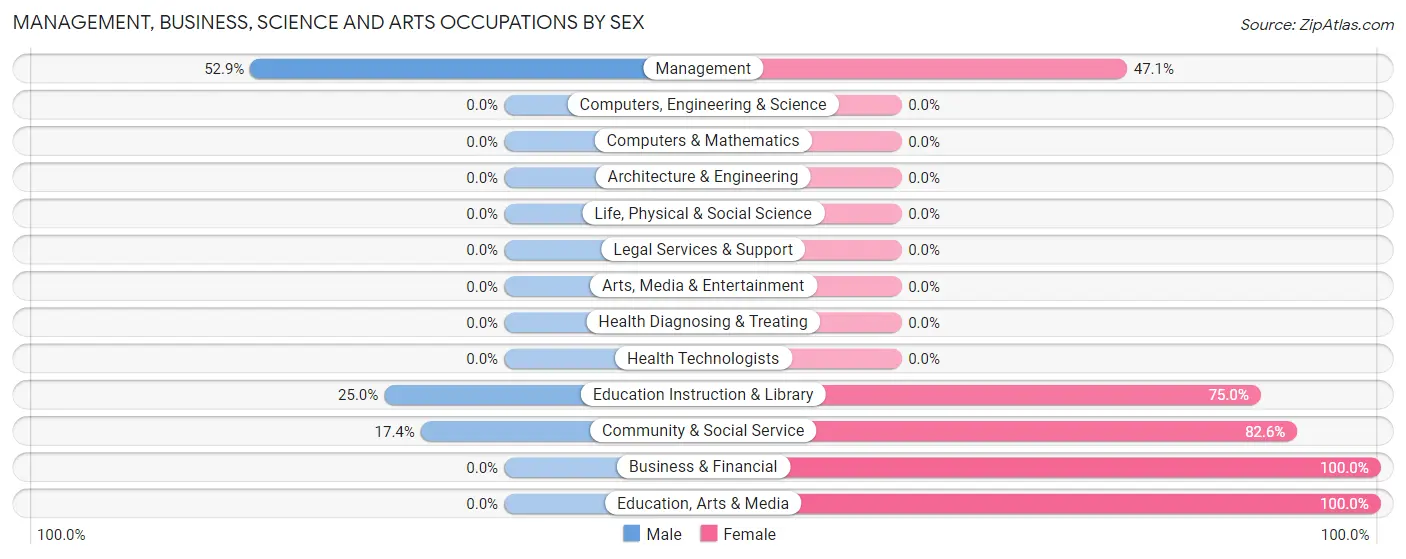
Management, Business, Science and Arts Occupations by Sex
Within the Management, Business, Science and Arts occupations in El Moro, the most male-oriented occupations are Management (52.9%), Education Instruction & Library (25.0%), and Community & Social Service (17.4%), while the most female-oriented occupations are Business & Financial (100.0%), Education, Arts & Media (100.0%), and Community & Social Service (82.6%).
| Occupation | Male | Female |
| Management | 9 (52.9%) | 8 (47.1%) |
| Business & Financial | 0 (0.0%) | 10 (100.0%) |
| Computers, Engineering & Science | 0 (0.0%) | 0 (0.0%) |
| Computers & Mathematics | 0 (0.0%) | 0 (0.0%) |
| Architecture & Engineering | 0 (0.0%) | 0 (0.0%) |
| Life, Physical & Social Science | 0 (0.0%) | 0 (0.0%) |
| Community & Social Service | 4 (17.4%) | 19 (82.6%) |
| Education, Arts & Media | 0 (0.0%) | 7 (100.0%) |
| Legal Services & Support | 0 (0.0%) | 0 (0.0%) |
| Education Instruction & Library | 4 (25.0%) | 12 (75.0%) |
| Arts, Media & Entertainment | 0 (0.0%) | 0 (0.0%) |
| Health Diagnosing & Treating | 0 (0.0%) | 0 (0.0%) |
| Health Technologists | 0 (0.0%) | 0 (0.0%) |
| Total (Category) | 13 (26.0%) | 37 (74.0%) |
| Total (Overall) | 88 (54.0%) | 75 (46.0%) |
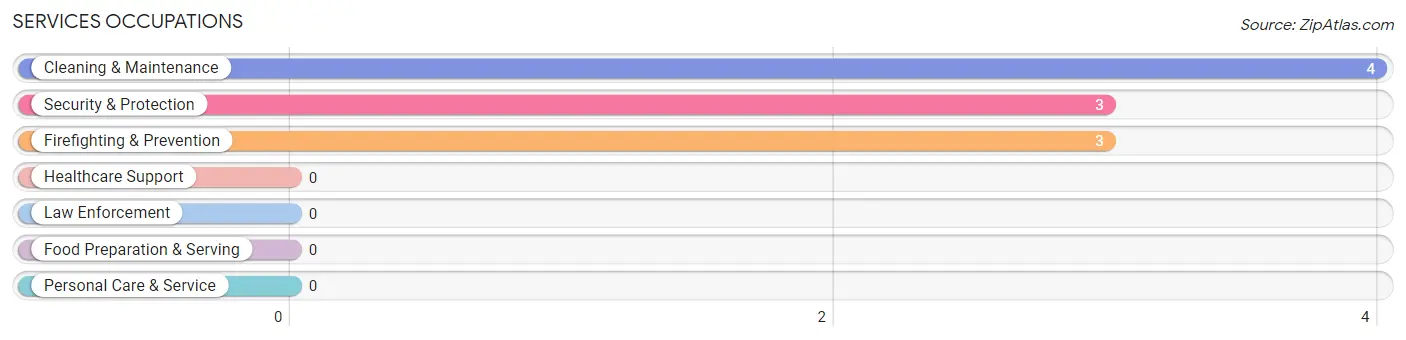
Services Occupations
The most common Services occupations in El Moro are Cleaning & Maintenance (4 | 2.5%), Security & Protection (3 | 1.8%), and Firefighting & Prevention (3 | 1.8%).
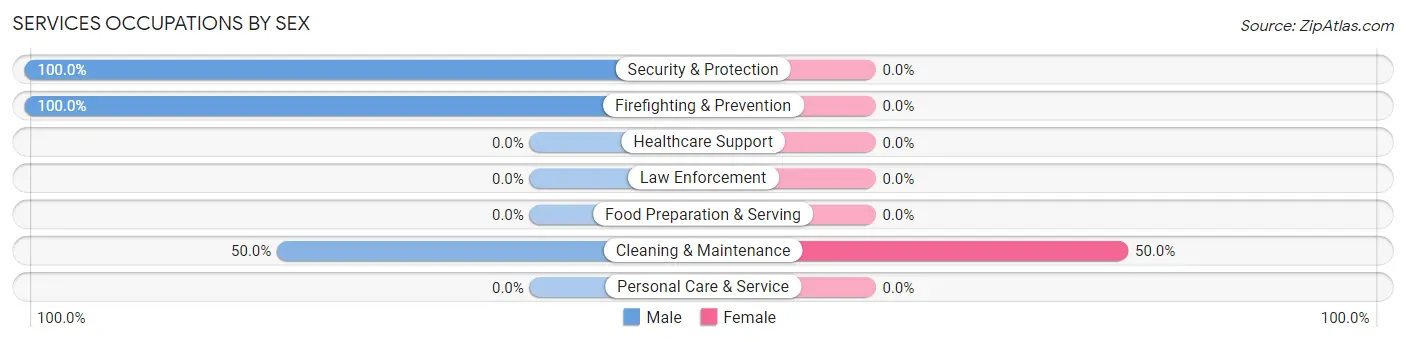
Services Occupations by Sex
| Occupation | Male | Female |
| Healthcare Support | 0 (0.0%) | 0 (0.0%) |
| Security & Protection | 3 (100.0%) | 0 (0.0%) |
| Firefighting & Prevention | 3 (100.0%) | 0 (0.0%) |
| Law Enforcement | 0 (0.0%) | 0 (0.0%) |
| Food Preparation & Serving | 0 (0.0%) | 0 (0.0%) |
| Cleaning & Maintenance | 2 (50.0%) | 2 (50.0%) |
| Personal Care & Service | 0 (0.0%) | 0 (0.0%) |
| Total (Category) | 5 (71.4%) | 2 (28.6%) |
| Total (Overall) | 88 (54.0%) | 75 (46.0%) |
Sales and Office Occupations
The most common Sales and Office occupations in El Moro are Sales & Related (32 | 19.6%), and Office & Administration (28 | 17.2%).

Sales and Office Occupations by Sex
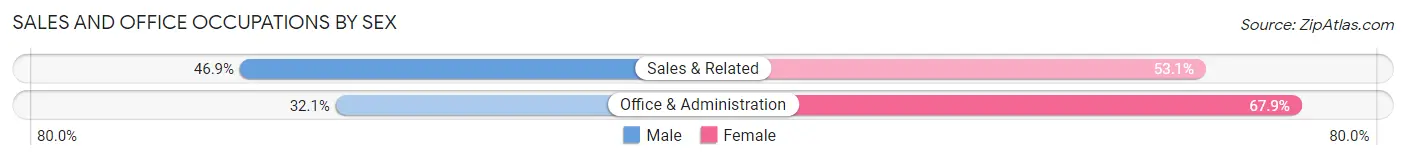
| Occupation | Male | Female |
| Sales & Related | 15 (46.9%) | 17 (53.1%) |
| Office & Administration | 9 (32.1%) | 19 (67.9%) |
| Total (Category) | 24 (40.0%) | 36 (60.0%) |
| Total (Overall) | 88 (54.0%) | 75 (46.0%) |
Natural Resources, Construction and Maintenance Occupations
The most common Natural Resources, Construction and Maintenance occupations in El Moro are , and Construction & Extraction (16 | 9.8%).
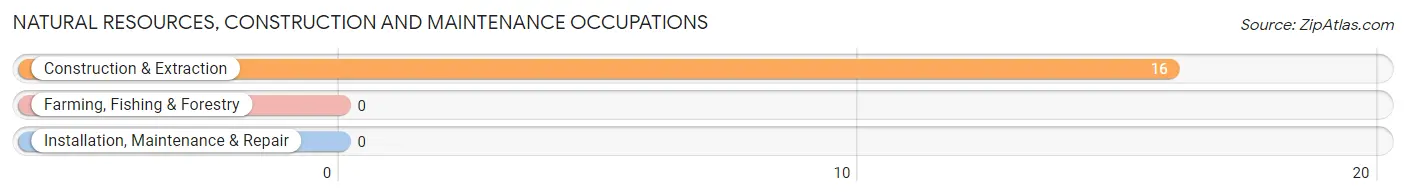
Natural Resources, Construction and Maintenance Occupations by Sex
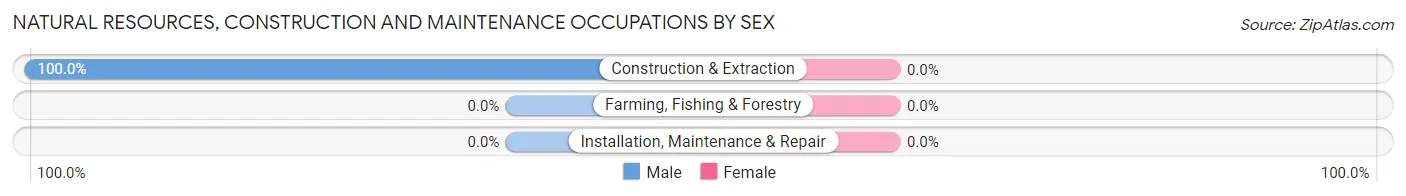
| Occupation | Male | Female |
| Farming, Fishing & Forestry | 0 (0.0%) | 0 (0.0%) |
| Construction & Extraction | 16 (100.0%) | 0 (0.0%) |
| Installation, Maintenance & Repair | 0 (0.0%) | 0 (0.0%) |
| Total (Category) | 16 (100.0%) | 0 (0.0%) |
| Total (Overall) | 88 (54.0%) | 75 (46.0%) |
Production, Transportation and Moving Occupations
The most common Production, Transportation and Moving occupations in El Moro are Transportation (23 | 14.1%), and Material Moving (7 | 4.3%).
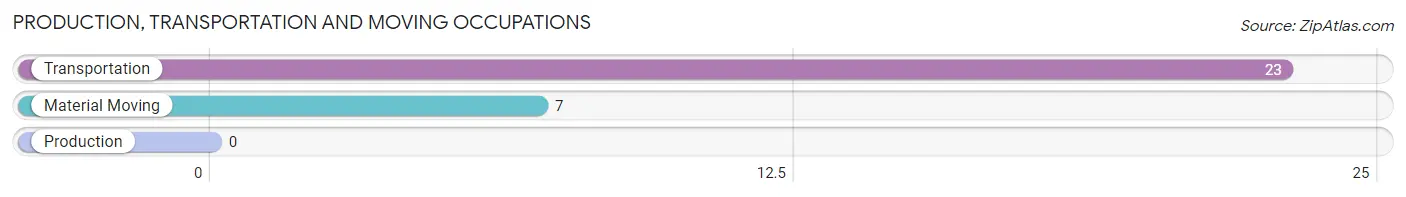
Production, Transportation and Moving Occupations by Sex
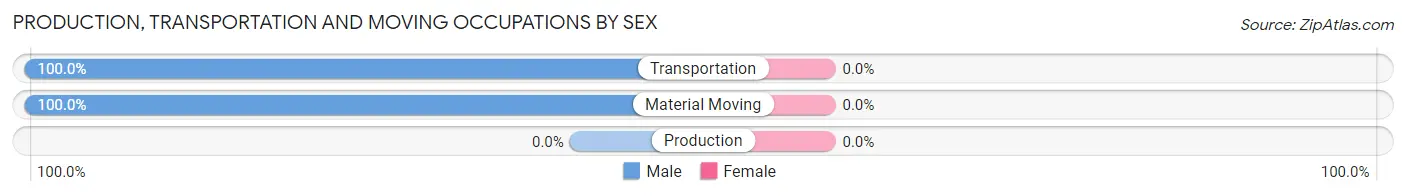
| Occupation | Male | Female |
| Production | 0 (0.0%) | 0 (0.0%) |
| Transportation | 23 (100.0%) | 0 (0.0%) |
| Material Moving | 7 (100.0%) | 0 (0.0%) |
| Total (Category) | 30 (100.0%) | 0 (0.0%) |
| Total (Overall) | 88 (54.0%) | 75 (46.0%) |
Employment Industries by Sex in El Moro
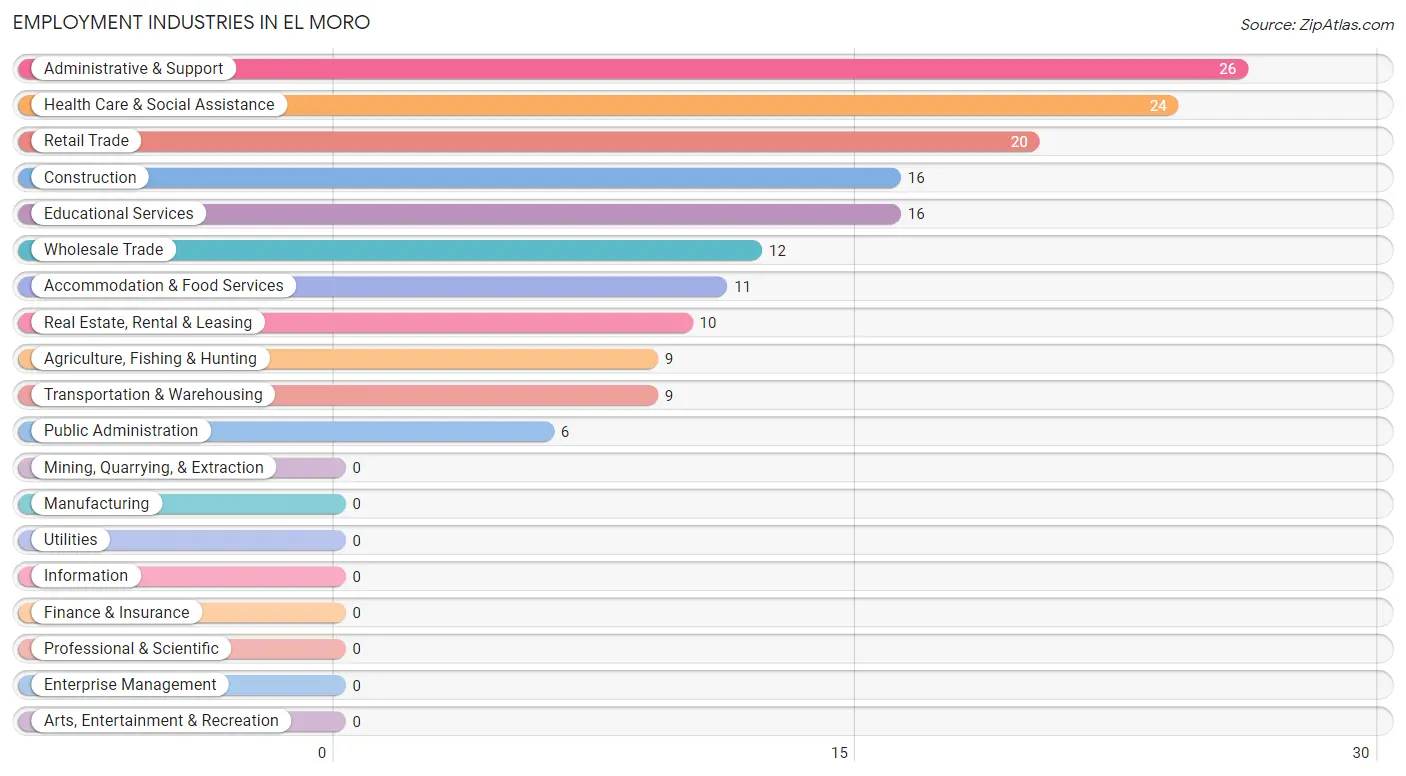
Employment Industries in El Moro
The major employment industries in El Moro include Administrative & Support (26 | 16.0%), Health Care & Social Assistance (24 | 14.7%), Retail Trade (20 | 12.3%), Construction (16 | 9.8%), and Educational Services (16 | 9.8%).
Employment Industries by Sex in El Moro
The El Moro industries that see more men than women are Agriculture, Fishing & Hunting (100.0%), Construction (100.0%), and Wholesale Trade (100.0%), whereas the industries that tend to have a higher number of women are Real Estate, Rental & Leasing (100.0%), Health Care & Social Assistance (100.0%), and Retail Trade (85.0%).
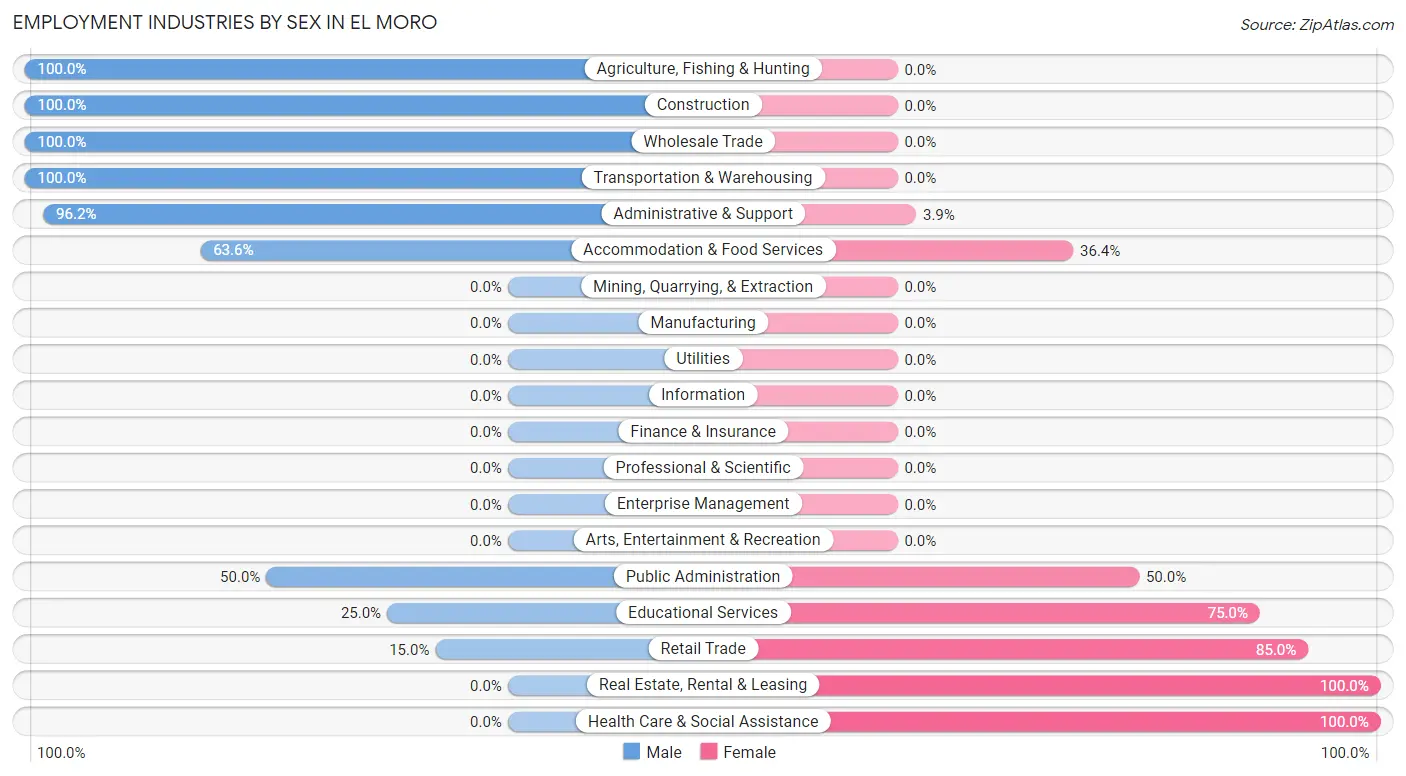
| Industry | Male | Female |
| Agriculture, Fishing & Hunting | 9 (100.0%) | 0 (0.0%) |
| Mining, Quarrying, & Extraction | 0 (0.0%) | 0 (0.0%) |
| Construction | 16 (100.0%) | 0 (0.0%) |
| Manufacturing | 0 (0.0%) | 0 (0.0%) |
| Wholesale Trade | 12 (100.0%) | 0 (0.0%) |
| Retail Trade | 3 (15.0%) | 17 (85.0%) |
| Transportation & Warehousing | 9 (100.0%) | 0 (0.0%) |
| Utilities | 0 (0.0%) | 0 (0.0%) |
| Information | 0 (0.0%) | 0 (0.0%) |
| Finance & Insurance | 0 (0.0%) | 0 (0.0%) |
| Real Estate, Rental & Leasing | 0 (0.0%) | 10 (100.0%) |
| Professional & Scientific | 0 (0.0%) | 0 (0.0%) |
| Enterprise Management | 0 (0.0%) | 0 (0.0%) |
| Administrative & Support | 25 (96.2%) | 1 (3.8%) |
| Educational Services | 4 (25.0%) | 12 (75.0%) |
| Health Care & Social Assistance | 0 (0.0%) | 24 (100.0%) |
| Arts, Entertainment & Recreation | 0 (0.0%) | 0 (0.0%) |
| Accommodation & Food Services | 7 (63.6%) | 4 (36.4%) |
| Public Administration | 3 (50.0%) | 3 (50.0%) |
| Total | 88 (54.0%) | 75 (46.0%) |
Education in El Moro
School Enrollment in El Moro
The most common levels of schooling among the 29 students in El Moro are high school (16 | 55.2%), college / undergraduate (7 | 24.1%), and middle school (6 | 20.7%).
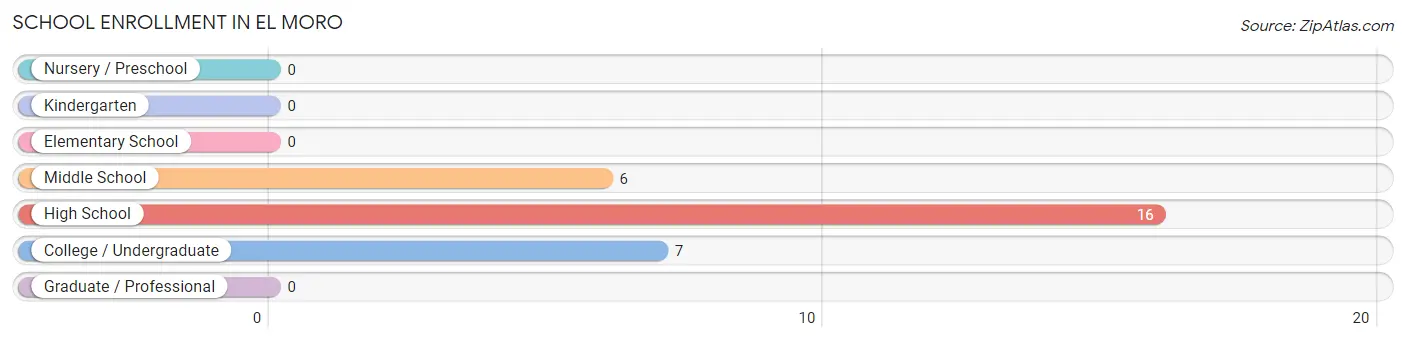
| School Level | # Students | % Students |
| Nursery / Preschool | 0 | 0.0% |
| Kindergarten | 0 | 0.0% |
| Elementary School | 0 | 0.0% |
| Middle School | 6 | 20.7% |
| High School | 16 | 55.2% |
| College / Undergraduate | 7 | 24.1% |
| Graduate / Professional | 0 | 0.0% |
| Total | 29 | 100.0% |
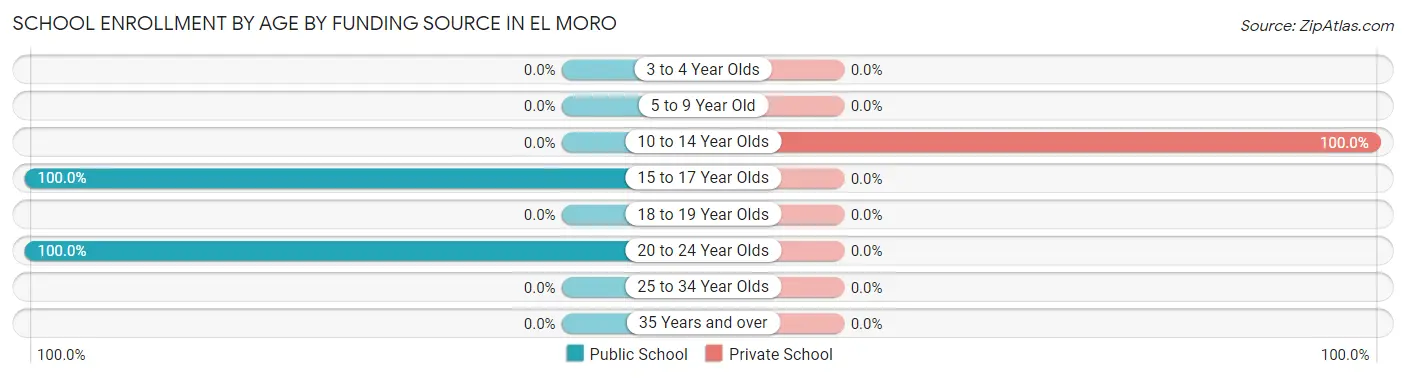
School Enrollment by Age by Funding Source in El Moro
Out of a total of 29 students who are enrolled in schools in El Moro, 6 (20.7%) attend a private institution, while the remaining 23 (79.3%) are enrolled in public schools. The age group of 10 to 14 year olds has the highest likelihood of being enrolled in private schools, with 6 (100.0% in the age bracket) enrolled. Conversely, the age group of 15 to 17 year olds has the lowest likelihood of being enrolled in a private school, with 16 (100.0% in the age bracket) attending a public institution.
| Age Bracket | Public School | Private School |
| 3 to 4 Year Olds | 0 (0.0%) | 0 (0.0%) |
| 5 to 9 Year Old | 0 (0.0%) | 0 (0.0%) |
| 10 to 14 Year Olds | 0 (0.0%) | 6 (100.0%) |
| 15 to 17 Year Olds | 16 (100.0%) | 0 (0.0%) |
| 18 to 19 Year Olds | 0 (0.0%) | 0 (0.0%) |
| 20 to 24 Year Olds | 7 (100.0%) | 0 (0.0%) |
| 25 to 34 Year Olds | 0 (0.0%) | 0 (0.0%) |
| 35 Years and over | 0 (0.0%) | 0 (0.0%) |
| Total | 23 (79.3%) | 6 (20.7%) |
Educational Attainment by Field of Study in El Moro
Education (18 | 41.9%), business (12 | 27.9%), visual & performing arts (6 | 14.0%), communications (4 | 9.3%), and engineering (3 | 7.0%) are the most common fields of study among 43 individuals in El Moro who have obtained a bachelor's degree or higher.
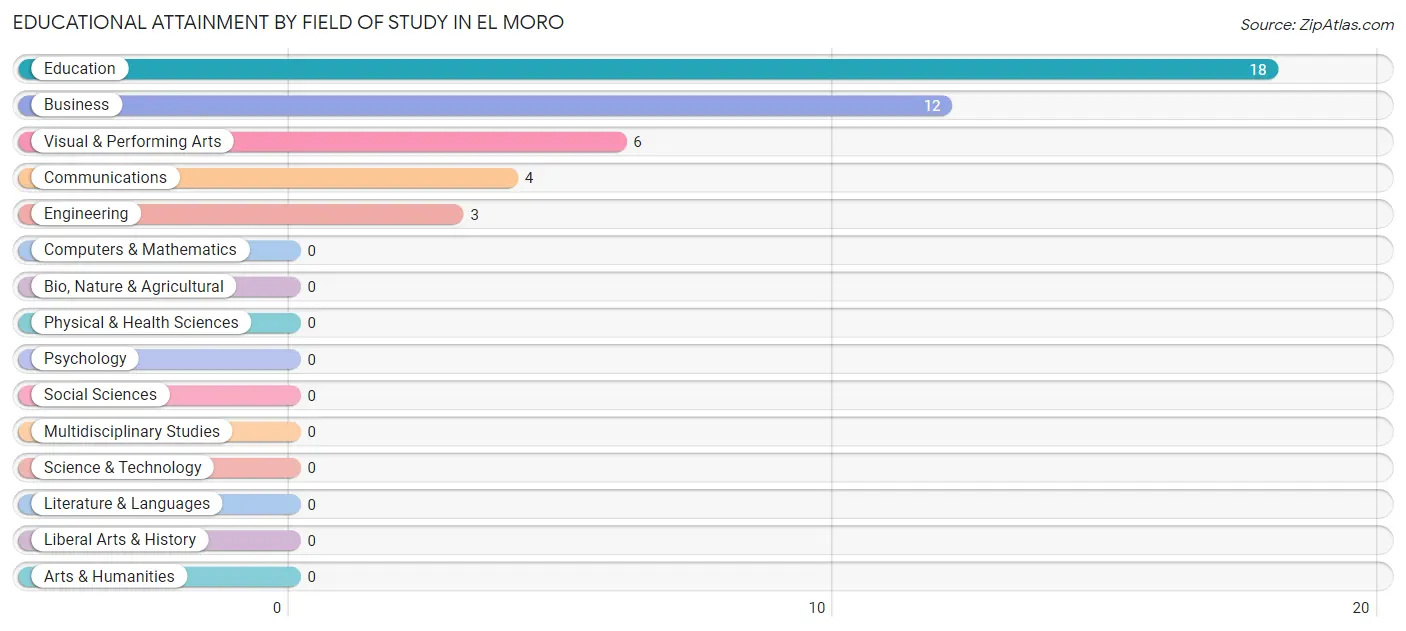
| Field of Study | # Graduates | % Graduates |
| Computers & Mathematics | 0 | 0.0% |
| Bio, Nature & Agricultural | 0 | 0.0% |
| Physical & Health Sciences | 0 | 0.0% |
| Psychology | 0 | 0.0% |
| Social Sciences | 0 | 0.0% |
| Engineering | 3 | 7.0% |
| Multidisciplinary Studies | 0 | 0.0% |
| Science & Technology | 0 | 0.0% |
| Business | 12 | 27.9% |
| Education | 18 | 41.9% |
| Literature & Languages | 0 | 0.0% |
| Liberal Arts & History | 0 | 0.0% |
| Visual & Performing Arts | 6 | 14.0% |
| Communications | 4 | 9.3% |
| Arts & Humanities | 0 | 0.0% |
| Total | 43 | 100.0% |
Transportation & Commute in El Moro
Vehicle Availability by Sex in El Moro
The most prevalent vehicle ownership categories in El Moro are males with 4 vehicles (32, accounting for 36.4%) and females with 4 vehicles (27, making up 42.7%).
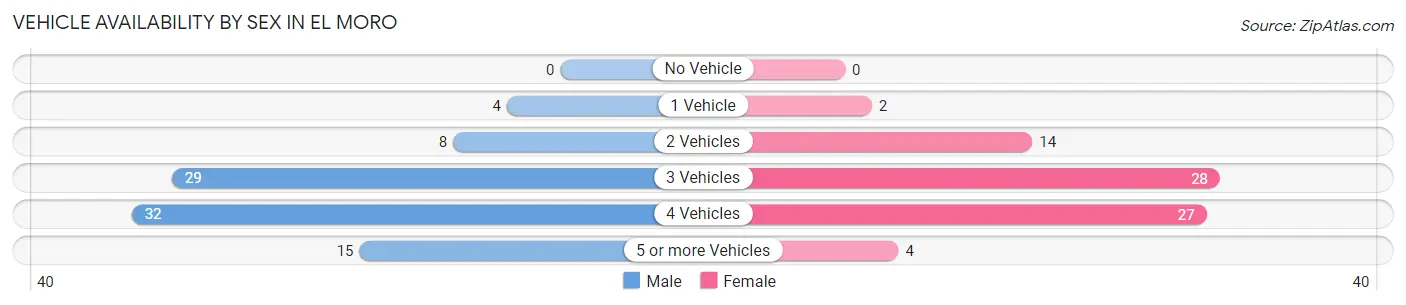
| Vehicles Available | Male | Female |
| No Vehicle | 0 (0.0%) | 0 (0.0%) |
| 1 Vehicle | 4 (4.5%) | 2 (2.7%) |
| 2 Vehicles | 8 (9.1%) | 14 (18.7%) |
| 3 Vehicles | 29 (33.0%) | 28 (37.3%) |
| 4 Vehicles | 32 (36.4%) | 27 (36.0%) |
| 5 or more Vehicles | 15 (17.1%) | 4 (5.3%) |
| Total | 88 (100.0%) | 75 (100.0%) |
Commute Time in El Moro
The most frequently occuring commute durations in El Moro are 15 to 19 minutes (37 commuters, 28.5%), 5 to 9 minutes (34 commuters, 26.2%), and 10 to 14 minutes (25 commuters, 19.2%).
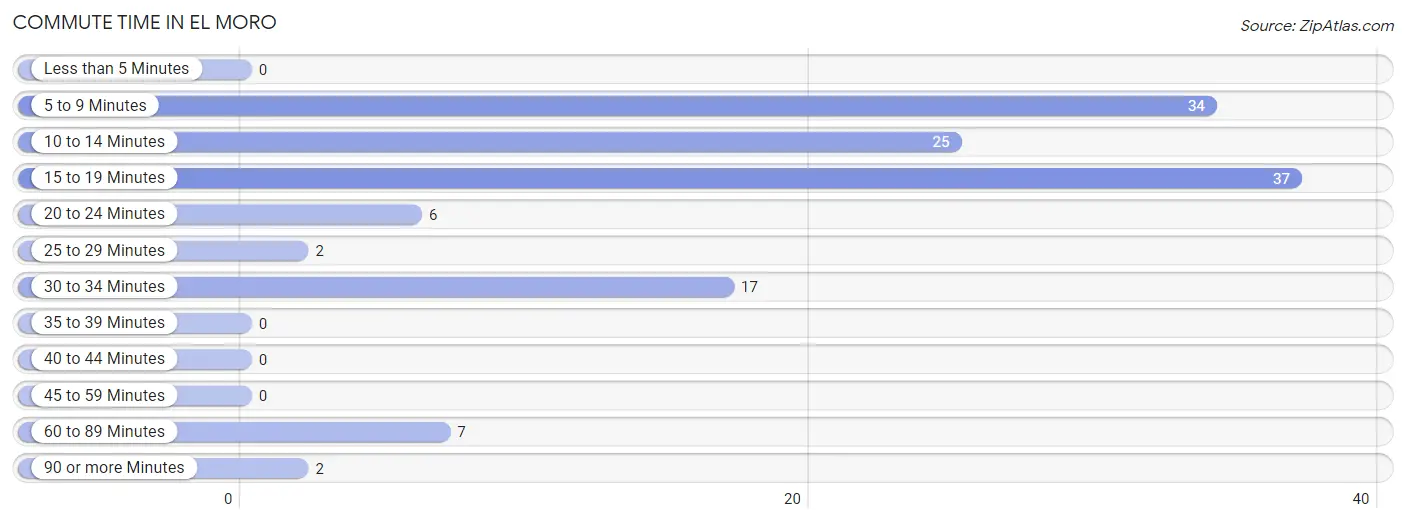
| Commute Time | # Commuters | % Commuters |
| Less than 5 Minutes | 0 | 0.0% |
| 5 to 9 Minutes | 34 | 26.2% |
| 10 to 14 Minutes | 25 | 19.2% |
| 15 to 19 Minutes | 37 | 28.5% |
| 20 to 24 Minutes | 6 | 4.6% |
| 25 to 29 Minutes | 2 | 1.5% |
| 30 to 34 Minutes | 17 | 13.1% |
| 35 to 39 Minutes | 0 | 0.0% |
| 40 to 44 Minutes | 0 | 0.0% |
| 45 to 59 Minutes | 0 | 0.0% |
| 60 to 89 Minutes | 7 | 5.4% |
| 90 or more Minutes | 2 | 1.5% |
Commute Time by Sex in El Moro
The most common commute times in El Moro are 5 to 9 minutes (17 commuters, 30.4%) for males and 15 to 19 minutes (24 commuters, 32.4%) for females.
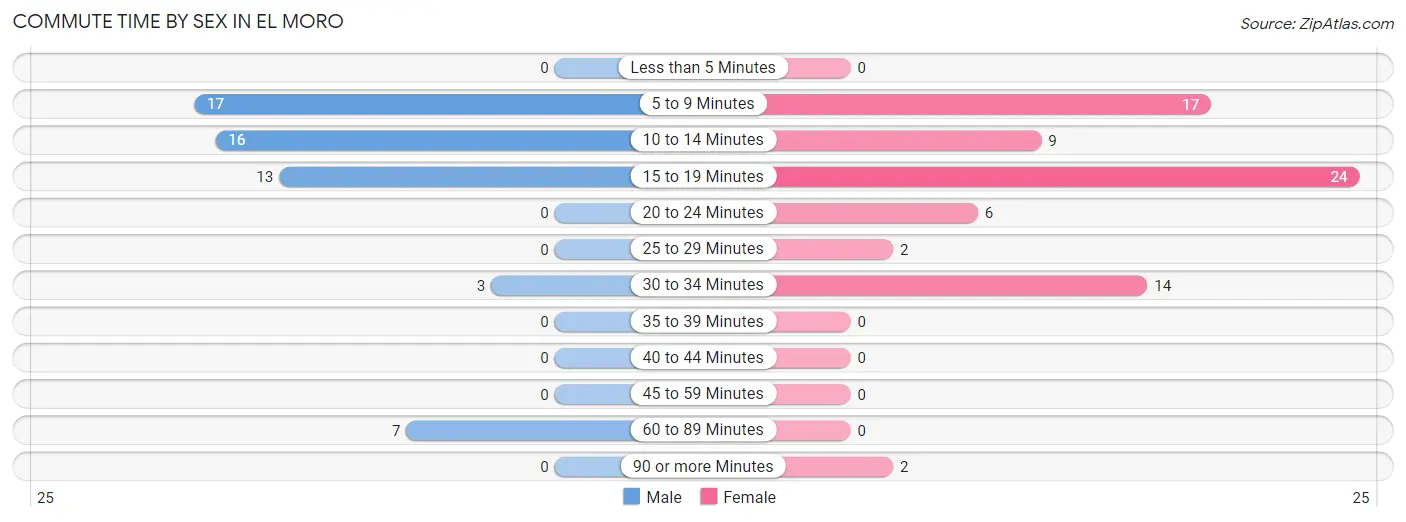
| Commute Time | Male | Female |
| Less than 5 Minutes | 0 (0.0%) | 0 (0.0%) |
| 5 to 9 Minutes | 17 (30.4%) | 17 (23.0%) |
| 10 to 14 Minutes | 16 (28.6%) | 9 (12.2%) |
| 15 to 19 Minutes | 13 (23.2%) | 24 (32.4%) |
| 20 to 24 Minutes | 0 (0.0%) | 6 (8.1%) |
| 25 to 29 Minutes | 0 (0.0%) | 2 (2.7%) |
| 30 to 34 Minutes | 3 (5.4%) | 14 (18.9%) |
| 35 to 39 Minutes | 0 (0.0%) | 0 (0.0%) |
| 40 to 44 Minutes | 0 (0.0%) | 0 (0.0%) |
| 45 to 59 Minutes | 0 (0.0%) | 0 (0.0%) |
| 60 to 89 Minutes | 7 (12.5%) | 0 (0.0%) |
| 90 or more Minutes | 0 (0.0%) | 2 (2.7%) |
Time of Departure to Work by Sex in El Moro
The most frequent times of departure to work in El Moro are 6:30 AM to 6:59 AM (16, 28.6%) for males and 8:30 AM to 8:59 AM (27, 36.5%) for females.
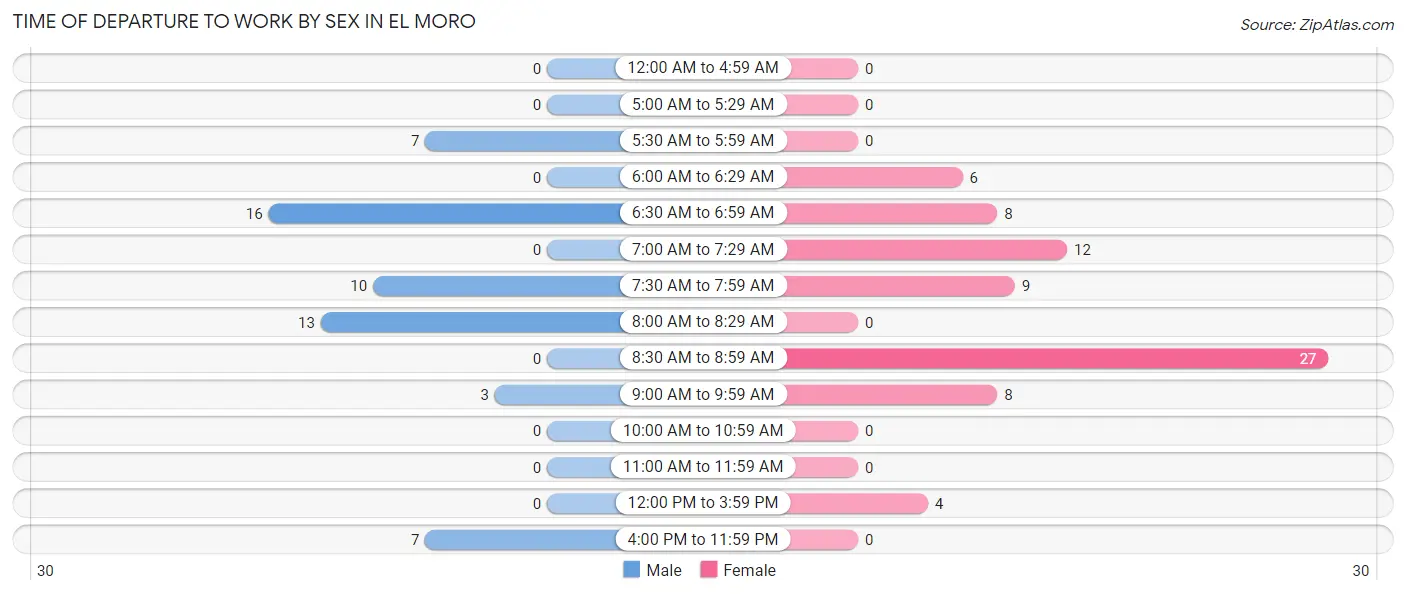
| Time of Departure | Male | Female |
| 12:00 AM to 4:59 AM | 0 (0.0%) | 0 (0.0%) |
| 5:00 AM to 5:29 AM | 0 (0.0%) | 0 (0.0%) |
| 5:30 AM to 5:59 AM | 7 (12.5%) | 0 (0.0%) |
| 6:00 AM to 6:29 AM | 0 (0.0%) | 6 (8.1%) |
| 6:30 AM to 6:59 AM | 16 (28.6%) | 8 (10.8%) |
| 7:00 AM to 7:29 AM | 0 (0.0%) | 12 (16.2%) |
| 7:30 AM to 7:59 AM | 10 (17.9%) | 9 (12.2%) |
| 8:00 AM to 8:29 AM | 13 (23.2%) | 0 (0.0%) |
| 8:30 AM to 8:59 AM | 0 (0.0%) | 27 (36.5%) |
| 9:00 AM to 9:59 AM | 3 (5.4%) | 8 (10.8%) |
| 10:00 AM to 10:59 AM | 0 (0.0%) | 0 (0.0%) |
| 11:00 AM to 11:59 AM | 0 (0.0%) | 0 (0.0%) |
| 12:00 PM to 3:59 PM | 0 (0.0%) | 4 (5.4%) |
| 4:00 PM to 11:59 PM | 7 (12.5%) | 0 (0.0%) |
| Total | 56 (100.0%) | 74 (100.0%) |
Housing Occupancy in El Moro
Occupancy by Ownership in El Moro
Of the total 94 dwellings in El Moro, owner-occupied units account for 94 (100.0%), while renter-occupied units make up 0 (0.0%).
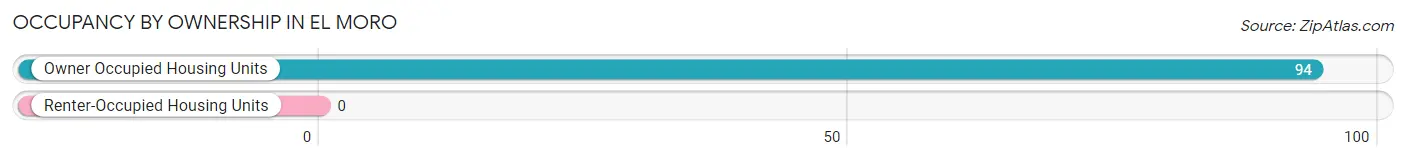
| Occupancy | # Housing Units | % Housing Units |
| Owner Occupied Housing Units | 94 | 100.0% |
| Renter-Occupied Housing Units | 0 | 0.0% |
| Total Occupied Housing Units | 94 | 100.0% |
Occupancy by Household Size in El Moro
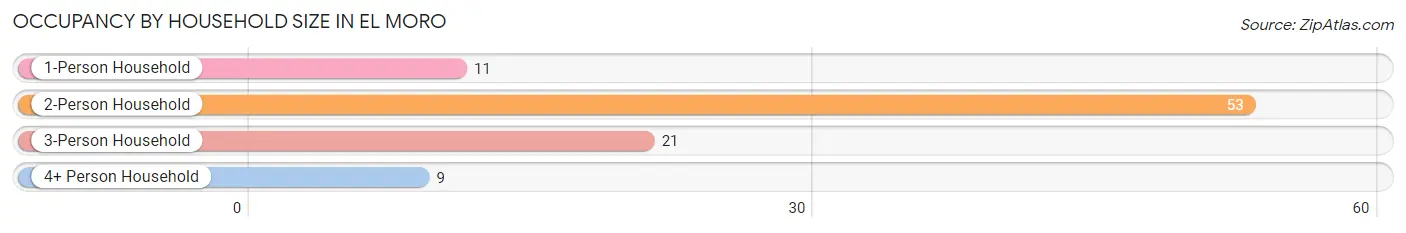
| Household Size | # Housing Units | % Housing Units |
| 1-Person Household | 11 | 11.7% |
| 2-Person Household | 53 | 56.4% |
| 3-Person Household | 21 | 22.3% |
| 4+ Person Household | 9 | 9.6% |
| Total Housing Units | 94 | 100.0% |
Occupancy by Ownership by Household Size in El Moro
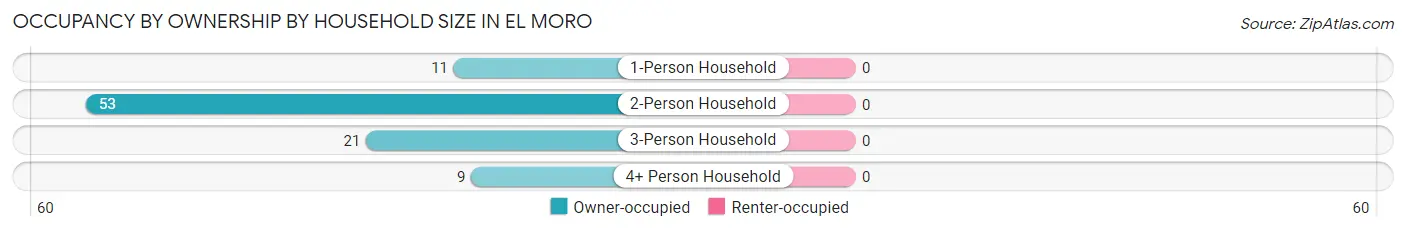
| Household Size | Owner-occupied | Renter-occupied |
| 1-Person Household | 11 (100.0%) | 0 (0.0%) |
| 2-Person Household | 53 (100.0%) | 0 (0.0%) |
| 3-Person Household | 21 (100.0%) | 0 (0.0%) |
| 4+ Person Household | 9 (100.0%) | 0 (0.0%) |
| Total Housing Units | 94 (100.0%) | 0 (0.0%) |
Occupancy by Educational Attainment in El Moro
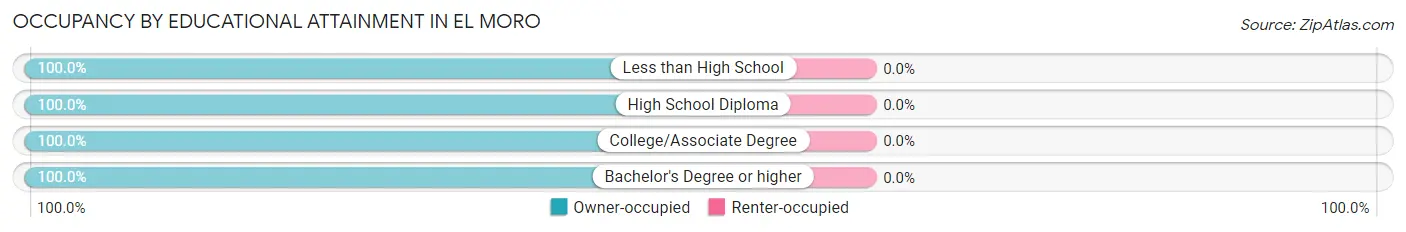
| Household Size | Owner-occupied | Renter-occupied |
| Less than High School | 7 (100.0%) | 0 (0.0%) |
| High School Diploma | 3 (100.0%) | 0 (0.0%) |
| College/Associate Degree | 61 (100.0%) | 0 (0.0%) |
| Bachelor's Degree or higher | 23 (100.0%) | 0 (0.0%) |
Occupancy by Age of Householder in El Moro
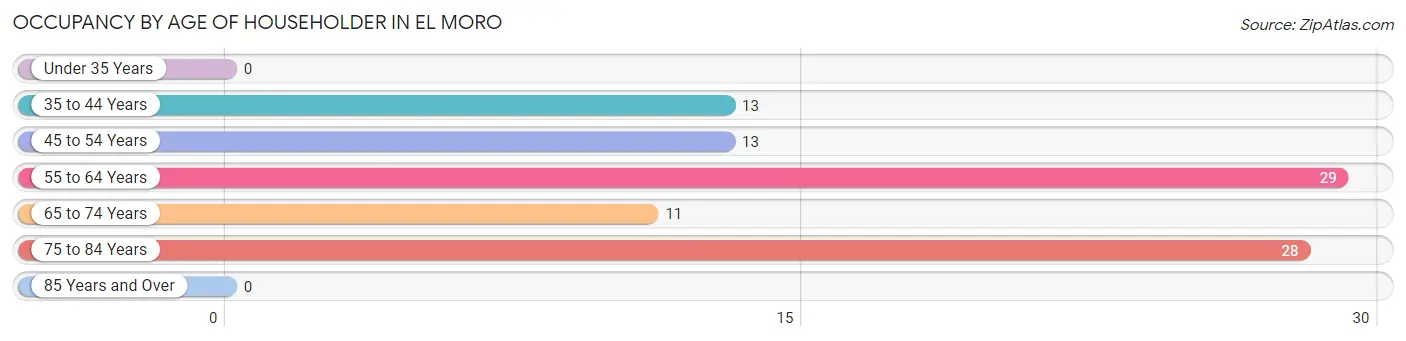
| Age Bracket | # Households | % Households |
| Under 35 Years | 0 | 0.0% |
| 35 to 44 Years | 13 | 13.8% |
| 45 to 54 Years | 13 | 13.8% |
| 55 to 64 Years | 29 | 30.8% |
| 65 to 74 Years | 11 | 11.7% |
| 75 to 84 Years | 28 | 29.8% |
| 85 Years and Over | 0 | 0.0% |
| Total | 94 | 100.0% |
Housing Finances in El Moro
Median Income by Occupancy in El Moro
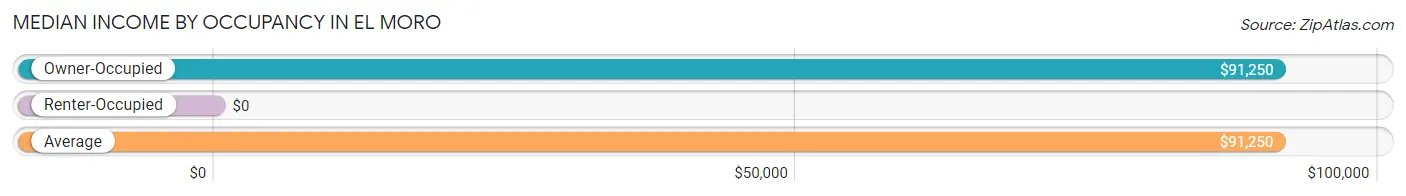
| Occupancy Type | # Households | Median Income |
| Owner-Occupied | 94 (100.0%) | $91,250 |
| Renter-Occupied | 0 (0.0%) | $0 |
| Average | 94 (100.0%) | $91,250 |
Occupancy by Householder Income Bracket in El Moro
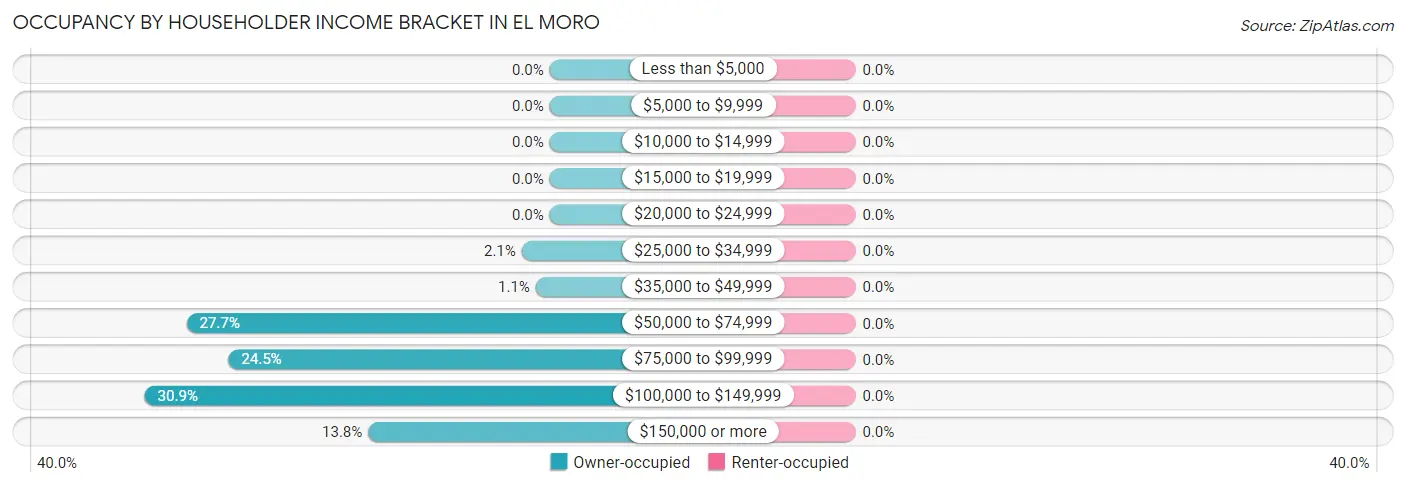
| Income Bracket | Owner-occupied | Renter-occupied |
| Less than $5,000 | 0 (0.0%) | 0 (0.0%) |
| $5,000 to $9,999 | 0 (0.0%) | 0 (0.0%) |
| $10,000 to $14,999 | 0 (0.0%) | 0 (0.0%) |
| $15,000 to $19,999 | 0 (0.0%) | 0 (0.0%) |
| $20,000 to $24,999 | 0 (0.0%) | 0 (0.0%) |
| $25,000 to $34,999 | 2 (2.1%) | 0 (0.0%) |
| $35,000 to $49,999 | 1 (1.1%) | 0 (0.0%) |
| $50,000 to $74,999 | 26 (27.7%) | 0 (0.0%) |
| $75,000 to $99,999 | 23 (24.5%) | 0 (0.0%) |
| $100,000 to $149,999 | 29 (30.8%) | 0 (0.0%) |
| $150,000 or more | 13 (13.8%) | 0 (0.0%) |
| Total | 94 (100.0%) | 0 (0.0%) |
Monthly Housing Cost Tiers in El Moro
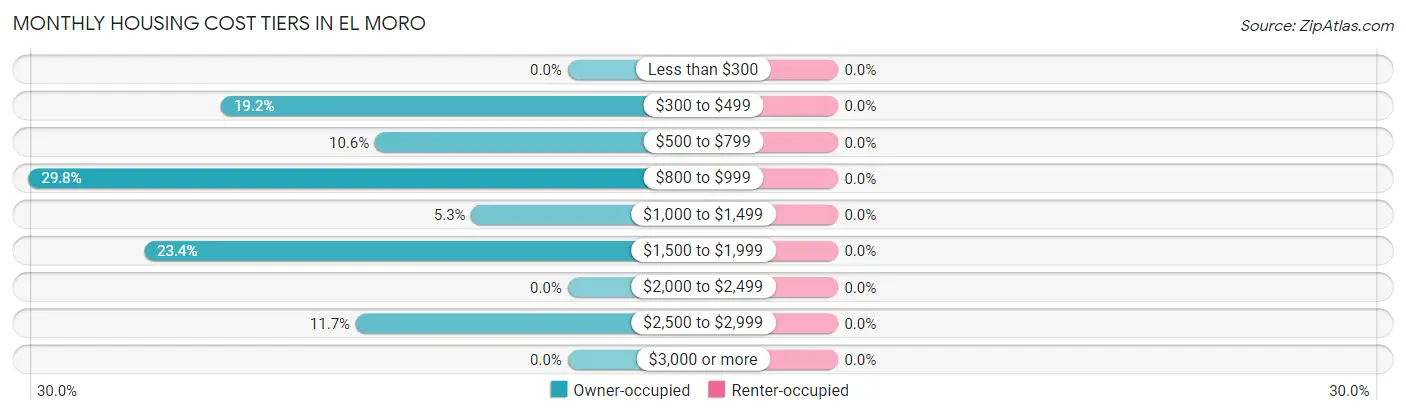
| Monthly Cost | Owner-occupied | Renter-occupied |
| Less than $300 | 0 (0.0%) | 0 (0.0%) |
| $300 to $499 | 18 (19.2%) | 0 (0.0%) |
| $500 to $799 | 10 (10.6%) | 0 (0.0%) |
| $800 to $999 | 28 (29.8%) | 0 (0.0%) |
| $1,000 to $1,499 | 5 (5.3%) | 0 (0.0%) |
| $1,500 to $1,999 | 22 (23.4%) | 0 (0.0%) |
| $2,000 to $2,499 | 0 (0.0%) | 0 (0.0%) |
| $2,500 to $2,999 | 11 (11.7%) | 0 (0.0%) |
| $3,000 or more | 0 (0.0%) | 0 (0.0%) |
| Total | 94 (100.0%) | 0 (0.0%) |
Physical Housing Characteristics in El Moro
Housing Structures in El Moro
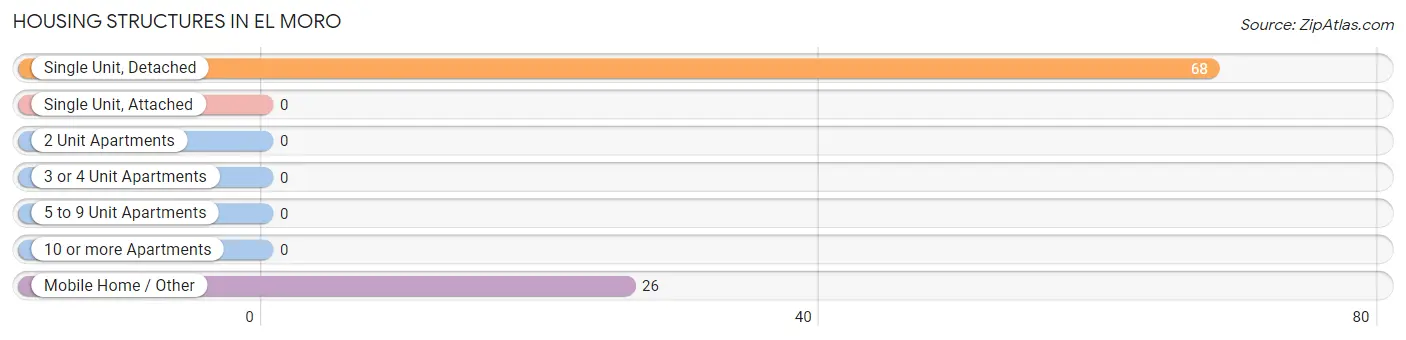
| Structure Type | # Housing Units | % Housing Units |
| Single Unit, Detached | 68 | 72.3% |
| Single Unit, Attached | 0 | 0.0% |
| 2 Unit Apartments | 0 | 0.0% |
| 3 or 4 Unit Apartments | 0 | 0.0% |
| 5 to 9 Unit Apartments | 0 | 0.0% |
| 10 or more Apartments | 0 | 0.0% |
| Mobile Home / Other | 26 | 27.7% |
| Total | 94 | 100.0% |
Housing Structures by Occupancy in El Moro
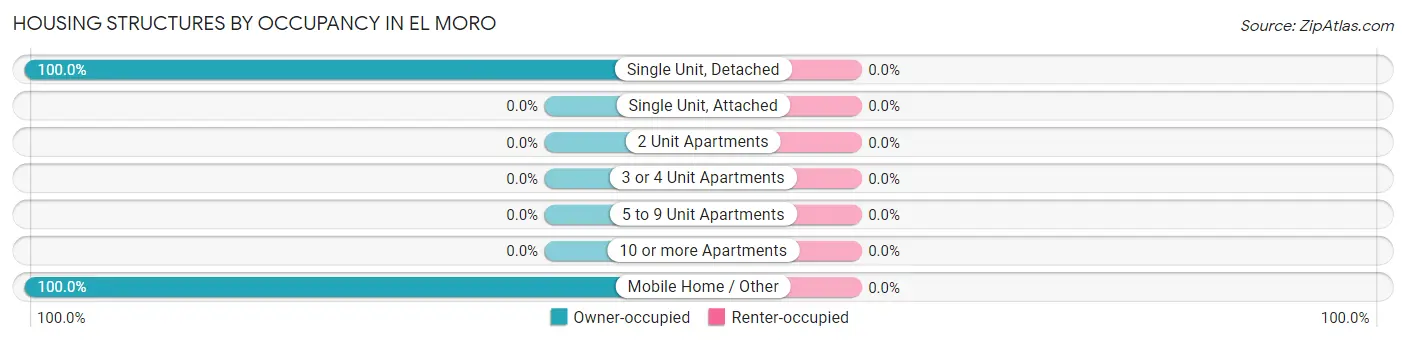
| Structure Type | Owner-occupied | Renter-occupied |
| Single Unit, Detached | 68 (100.0%) | 0 (0.0%) |
| Single Unit, Attached | 0 (0.0%) | 0 (0.0%) |
| 2 Unit Apartments | 0 (0.0%) | 0 (0.0%) |
| 3 or 4 Unit Apartments | 0 (0.0%) | 0 (0.0%) |
| 5 to 9 Unit Apartments | 0 (0.0%) | 0 (0.0%) |
| 10 or more Apartments | 0 (0.0%) | 0 (0.0%) |
| Mobile Home / Other | 26 (100.0%) | 0 (0.0%) |
| Total | 94 (100.0%) | 0 (0.0%) |
Housing Structures by Number of Rooms in El Moro
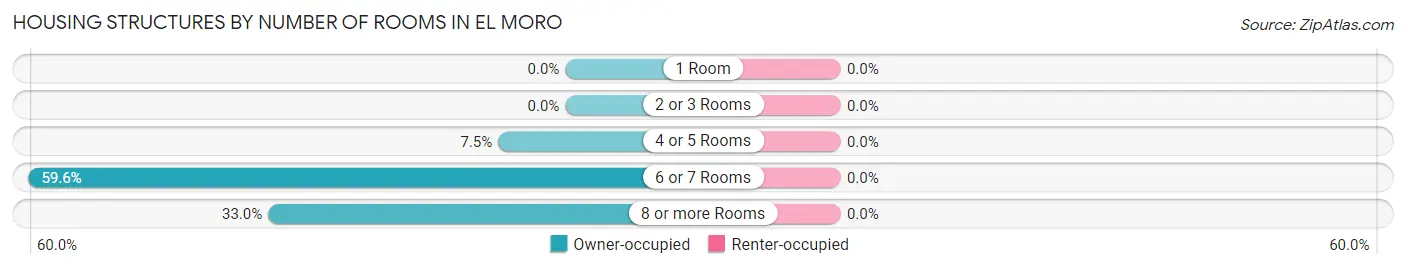
| Number of Rooms | Owner-occupied | Renter-occupied |
| 1 Room | 0 (0.0%) | 0 (0.0%) |
| 2 or 3 Rooms | 0 (0.0%) | 0 (0.0%) |
| 4 or 5 Rooms | 7 (7.4%) | 0 (0.0%) |
| 6 or 7 Rooms | 56 (59.6%) | 0 (0.0%) |
| 8 or more Rooms | 31 (33.0%) | 0 (0.0%) |
| Total | 94 (100.0%) | 0 (0.0%) |
Housing Structure by Heating Type in El Moro
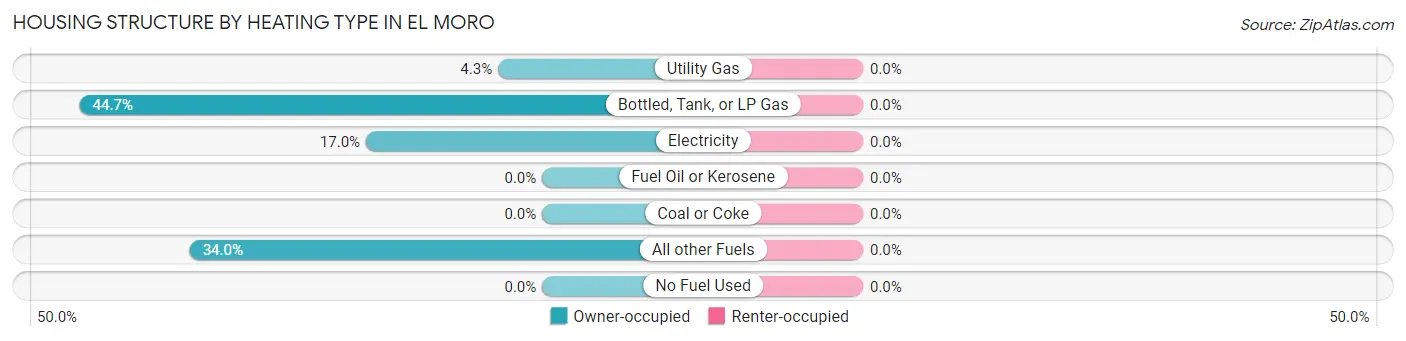
| Heating Type | Owner-occupied | Renter-occupied |
| Utility Gas | 4 (4.3%) | 0 (0.0%) |
| Bottled, Tank, or LP Gas | 42 (44.7%) | 0 (0.0%) |
| Electricity | 16 (17.0%) | 0 (0.0%) |
| Fuel Oil or Kerosene | 0 (0.0%) | 0 (0.0%) |
| Coal or Coke | 0 (0.0%) | 0 (0.0%) |
| All other Fuels | 32 (34.0%) | 0 (0.0%) |
| No Fuel Used | 0 (0.0%) | 0 (0.0%) |
| Total | 94 (100.0%) | 0 (0.0%) |
Household Vehicle Usage in El Moro
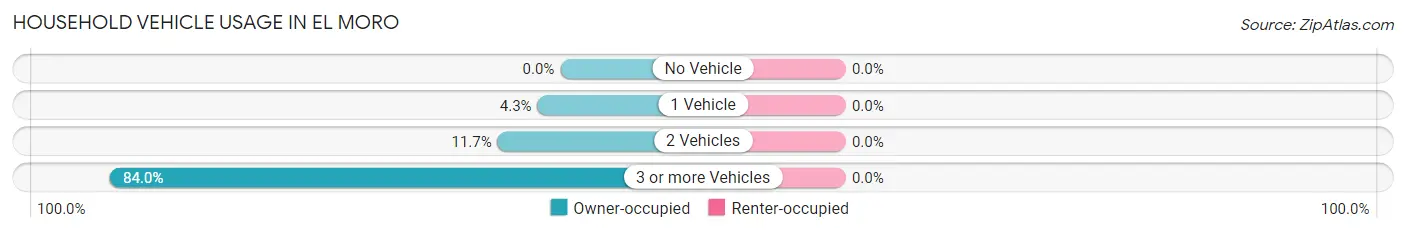
| Vehicles per Household | Owner-occupied | Renter-occupied |
| No Vehicle | 0 (0.0%) | 0 (0.0%) |
| 1 Vehicle | 4 (4.3%) | 0 (0.0%) |
| 2 Vehicles | 11 (11.7%) | 0 (0.0%) |
| 3 or more Vehicles | 79 (84.0%) | 0 (0.0%) |
| Total | 94 (100.0%) | 0 (0.0%) |
Real Estate & Mortgages in El Moro
Real Estate and Mortgage Overview in El Moro
| Characteristic | Without Mortgage | With Mortgage |
| Housing Units | 49 | 45 |
| Median Property Value | $222,900 | $259,600 |
| Median Household Income | $90,938 | $7 |
| Monthly Housing Costs | $642 | $0 |
| Real Estate Taxes | $825 | $0 |
Property Value by Mortgage Status in El Moro
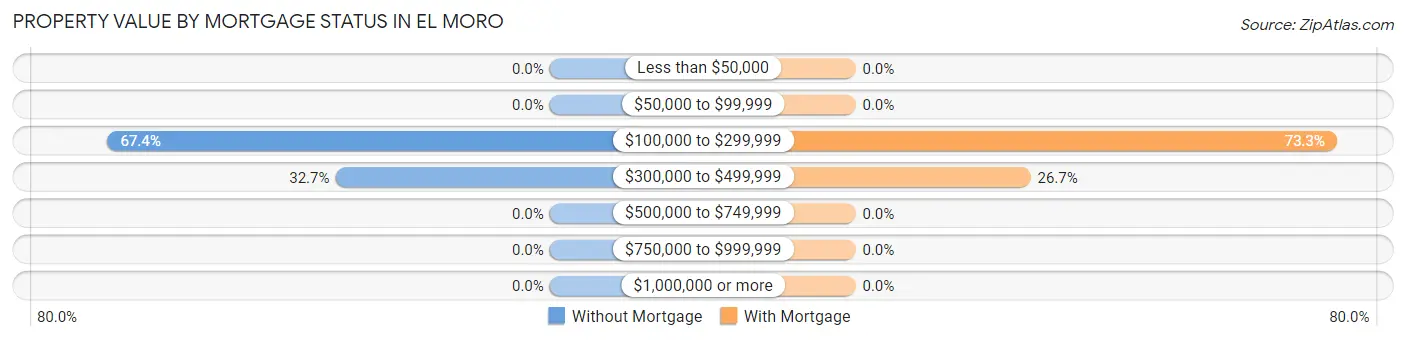
| Property Value | Without Mortgage | With Mortgage |
| Less than $50,000 | 0 (0.0%) | 0 (0.0%) |
| $50,000 to $99,999 | 0 (0.0%) | 0 (0.0%) |
| $100,000 to $299,999 | 33 (67.3%) | 33 (73.3%) |
| $300,000 to $499,999 | 16 (32.7%) | 12 (26.7%) |
| $500,000 to $749,999 | 0 (0.0%) | 0 (0.0%) |
| $750,000 to $999,999 | 0 (0.0%) | 0 (0.0%) |
| $1,000,000 or more | 0 (0.0%) | 0 (0.0%) |
| Total | 49 (100.0%) | 45 (100.0%) |
Household Income by Mortgage Status in El Moro
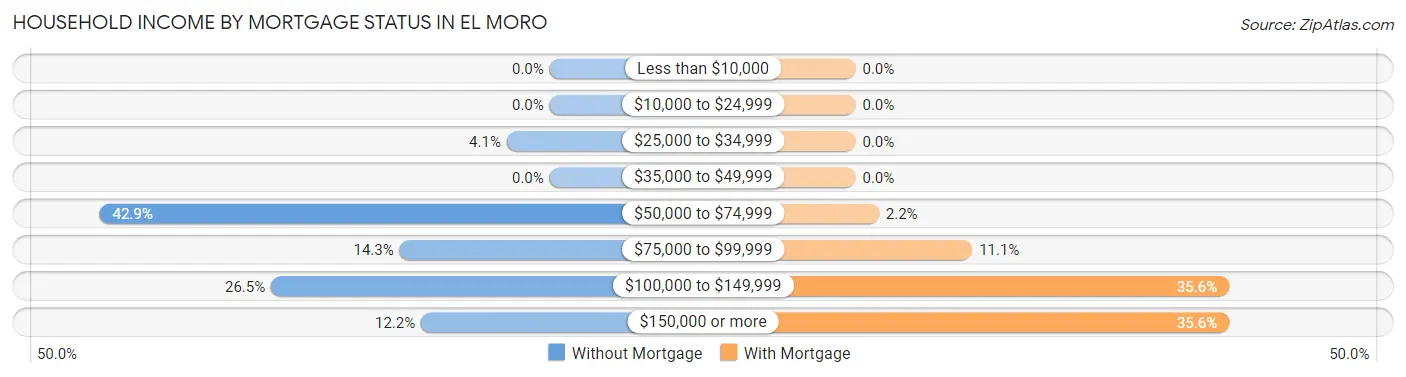
| Household Income | Without Mortgage | With Mortgage |
| Less than $10,000 | 0 (0.0%) | 0 (0.0%) |
| $10,000 to $24,999 | 0 (0.0%) | 0 (0.0%) |
| $25,000 to $34,999 | 2 (4.1%) | 0 (0.0%) |
| $35,000 to $49,999 | 0 (0.0%) | 0 (0.0%) |
| $50,000 to $74,999 | 21 (42.9%) | 1 (2.2%) |
| $75,000 to $99,999 | 7 (14.3%) | 5 (11.1%) |
| $100,000 to $149,999 | 13 (26.5%) | 16 (35.6%) |
| $150,000 or more | 6 (12.2%) | 16 (35.6%) |
| Total | 49 (100.0%) | 45 (100.0%) |
Property Value to Household Income Ratio in El Moro
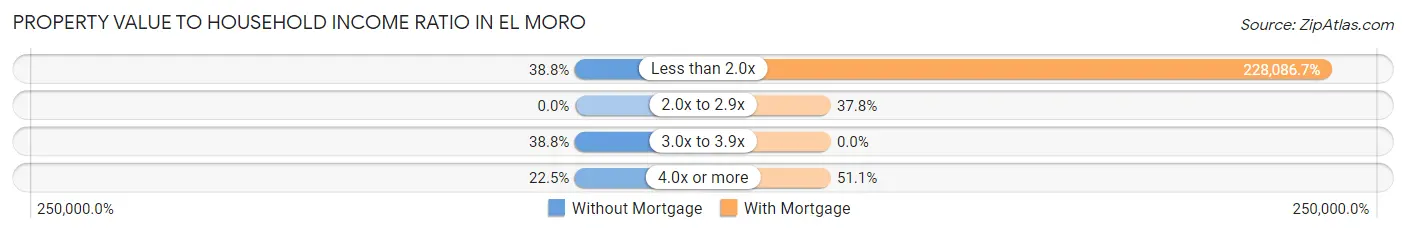
| Value-to-Income Ratio | Without Mortgage | With Mortgage |
| Less than 2.0x | 19 (38.8%) | 102,639 (228,086.7%) |
| 2.0x to 2.9x | 0 (0.0%) | 17 (37.8%) |
| 3.0x to 3.9x | 19 (38.8%) | 0 (0.0%) |
| 4.0x or more | 11 (22.5%) | 23 (51.1%) |
| Total | 49 (100.0%) | 45 (100.0%) |
Real Estate Taxes by Mortgage Status in El Moro
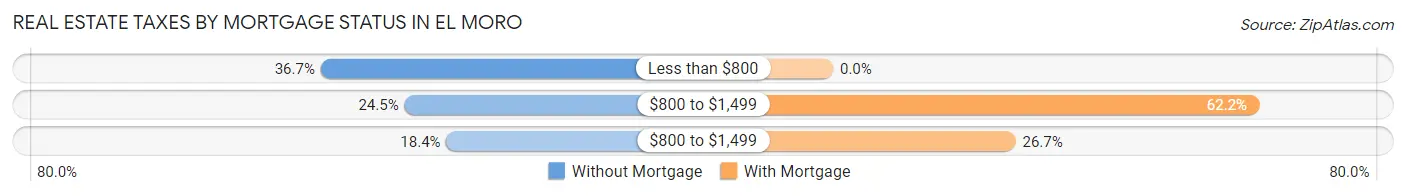
| Property Taxes | Without Mortgage | With Mortgage |
| Less than $800 | 18 (36.7%) | 0 (0.0%) |
| $800 to $1,499 | 12 (24.5%) | 28 (62.2%) |
| $800 to $1,499 | 9 (18.4%) | 12 (26.7%) |
| Total | 49 (100.0%) | 45 (100.0%) |
Health & Disability in El Moro
Health Insurance Coverage by Age in El Moro
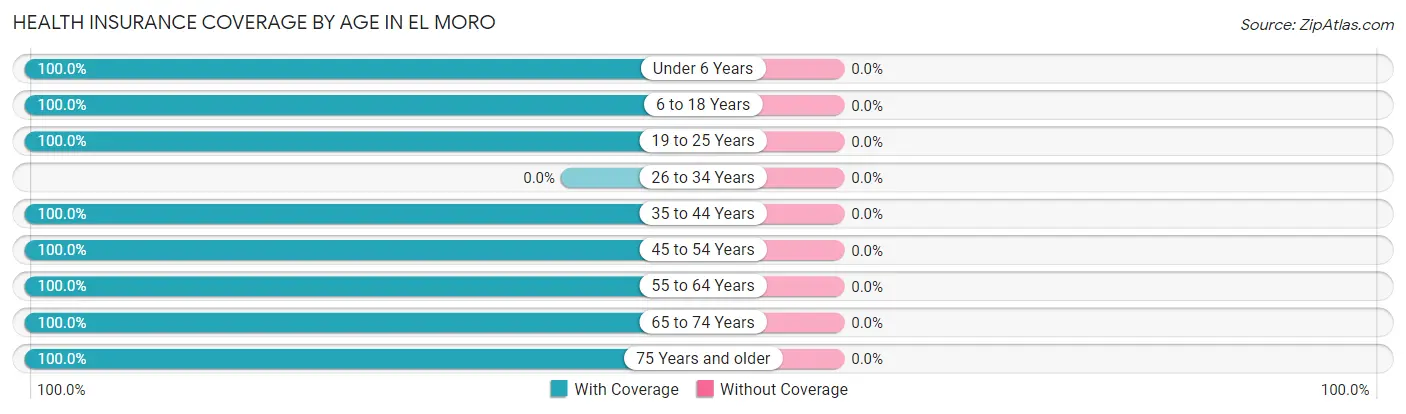
| Age Bracket | With Coverage | Without Coverage |
| Under 6 Years | 16 (100.0%) | 0 (0.0%) |
| 6 to 18 Years | 22 (100.0%) | 0 (0.0%) |
| 19 to 25 Years | 7 (100.0%) | 0 (0.0%) |
| 26 to 34 Years | 0 (0.0%) | 0 (0.0%) |
| 35 to 44 Years | 34 (100.0%) | 0 (0.0%) |
| 45 to 54 Years | 34 (100.0%) | 0 (0.0%) |
| 55 to 64 Years | 54 (100.0%) | 0 (0.0%) |
| 65 to 74 Years | 25 (100.0%) | 0 (0.0%) |
| 75 Years and older | 28 (100.0%) | 0 (0.0%) |
| Total | 220 (100.0%) | 0 (0.0%) |
Health Insurance Coverage by Citizenship Status in El Moro
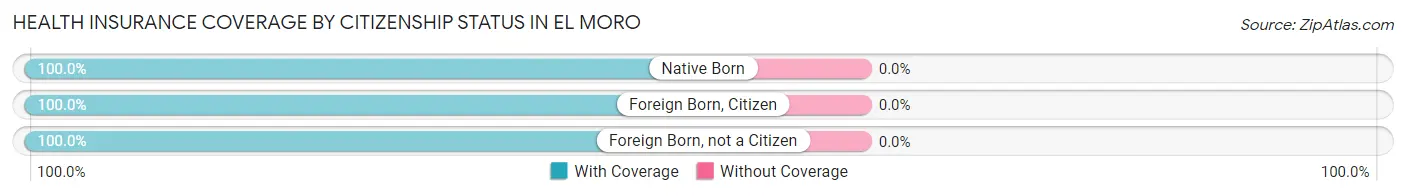
| Citizenship Status | With Coverage | Without Coverage |
| Native Born | 16 (100.0%) | 0 (0.0%) |
| Foreign Born, Citizen | 22 (100.0%) | 0 (0.0%) |
| Foreign Born, not a Citizen | 7 (100.0%) | 0 (0.0%) |
Health Insurance Coverage by Household Income in El Moro
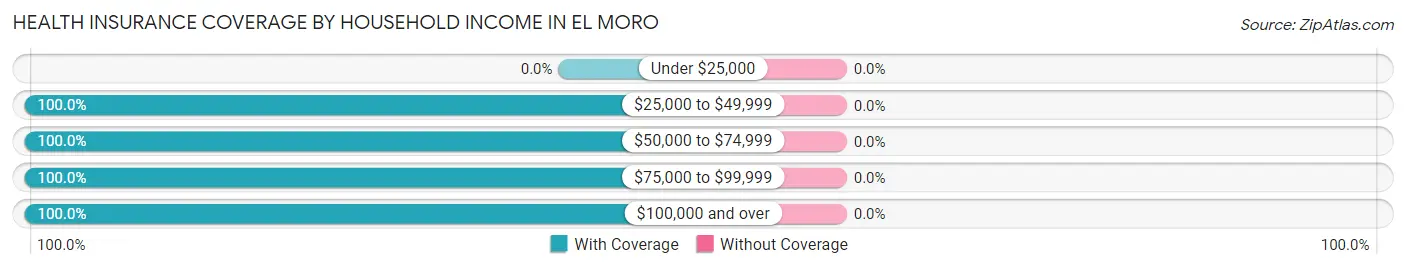
| Household Income | With Coverage | Without Coverage |
| Under $25,000 | 0 (0.0%) | 0 (0.0%) |
| $25,000 to $49,999 | 5 (100.0%) | 0 (0.0%) |
| $50,000 to $74,999 | 48 (100.0%) | 0 (0.0%) |
| $75,000 to $99,999 | 60 (100.0%) | 0 (0.0%) |
| $100,000 and over | 107 (100.0%) | 0 (0.0%) |
Public vs Private Health Insurance Coverage by Age in El Moro
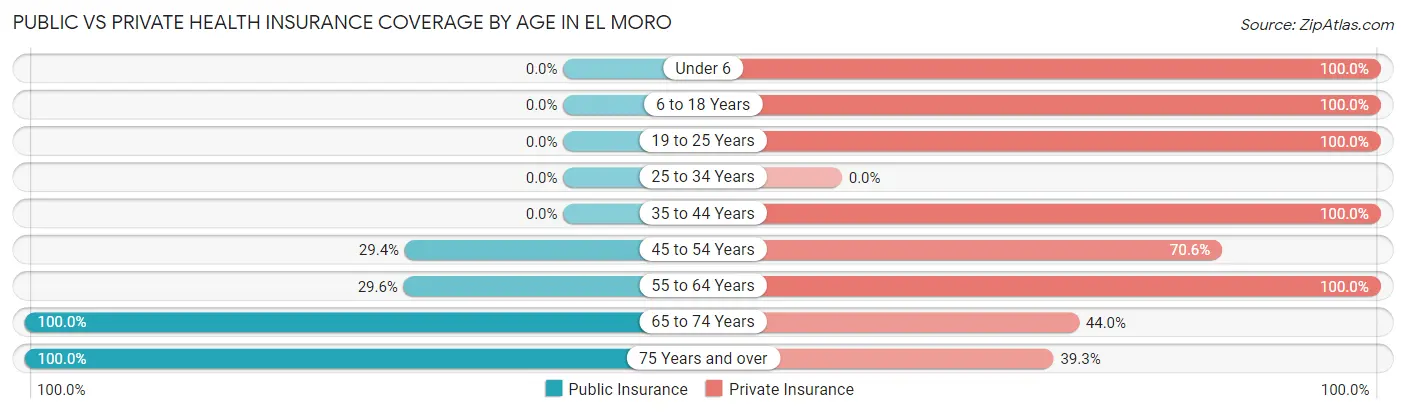
| Age Bracket | Public Insurance | Private Insurance |
| Under 6 | 0 (0.0%) | 16 (100.0%) |
| 6 to 18 Years | 0 (0.0%) | 22 (100.0%) |
| 19 to 25 Years | 0 (0.0%) | 7 (100.0%) |
| 25 to 34 Years | 0 (0.0%) | 0 (0.0%) |
| 35 to 44 Years | 0 (0.0%) | 34 (100.0%) |
| 45 to 54 Years | 10 (29.4%) | 24 (70.6%) |
| 55 to 64 Years | 16 (29.6%) | 54 (100.0%) |
| 65 to 74 Years | 25 (100.0%) | 11 (44.0%) |
| 75 Years and over | 28 (100.0%) | 11 (39.3%) |
| Total | 79 (35.9%) | 179 (81.4%) |
Disability Status by Sex by Age in El Moro
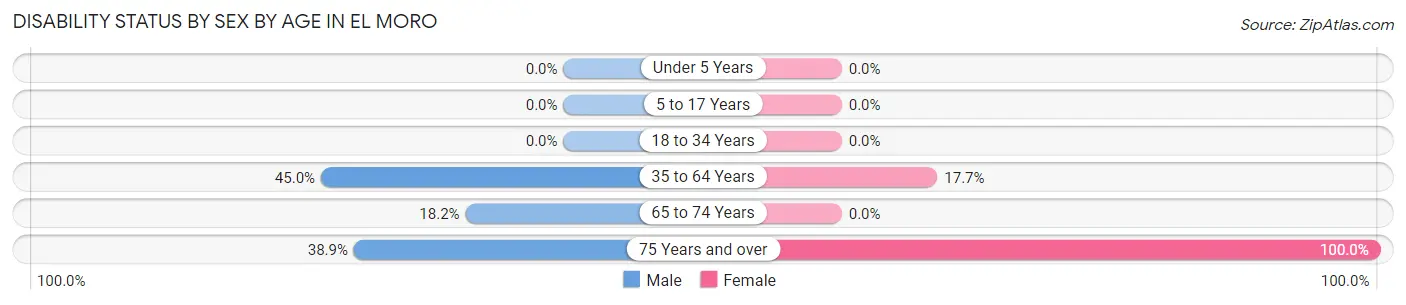
| Age Bracket | Male | Female |
| Under 5 Years | 0 (0.0%) | 0 (0.0%) |
| 5 to 17 Years | 0 (0.0%) | 0 (0.0%) |
| 18 to 34 Years | 0 (0.0%) | 0 (0.0%) |
| 35 to 64 Years | 27 (45.0%) | 11 (17.7%) |
| 65 to 74 Years | 2 (18.2%) | 0 (0.0%) |
| 75 Years and over | 7 (38.9%) | 10 (100.0%) |
Disability Class by Sex by Age in El Moro
Disability Class: Hearing Difficulty
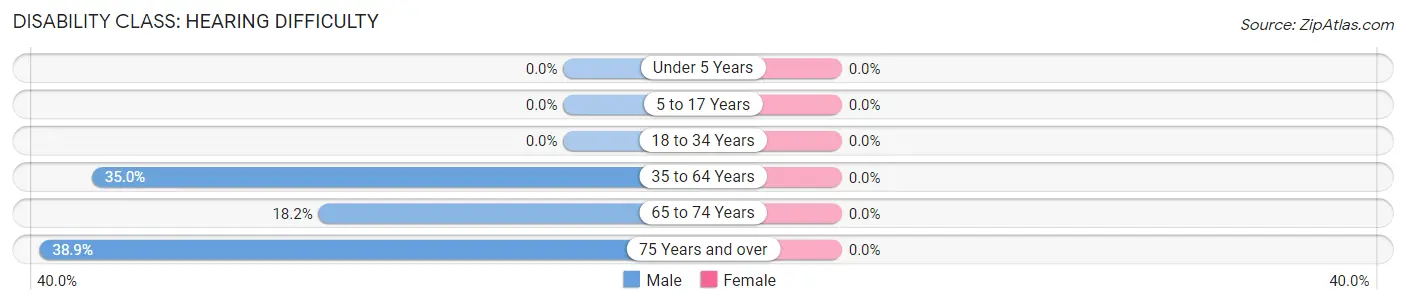
| Age Bracket | Male | Female |
| Under 5 Years | 0 (0.0%) | 0 (0.0%) |
| 5 to 17 Years | 0 (0.0%) | 0 (0.0%) |
| 18 to 34 Years | 0 (0.0%) | 0 (0.0%) |
| 35 to 64 Years | 21 (35.0%) | 0 (0.0%) |
| 65 to 74 Years | 2 (18.2%) | 0 (0.0%) |
| 75 Years and over | 7 (38.9%) | 0 (0.0%) |
Disability Class: Vision Difficulty
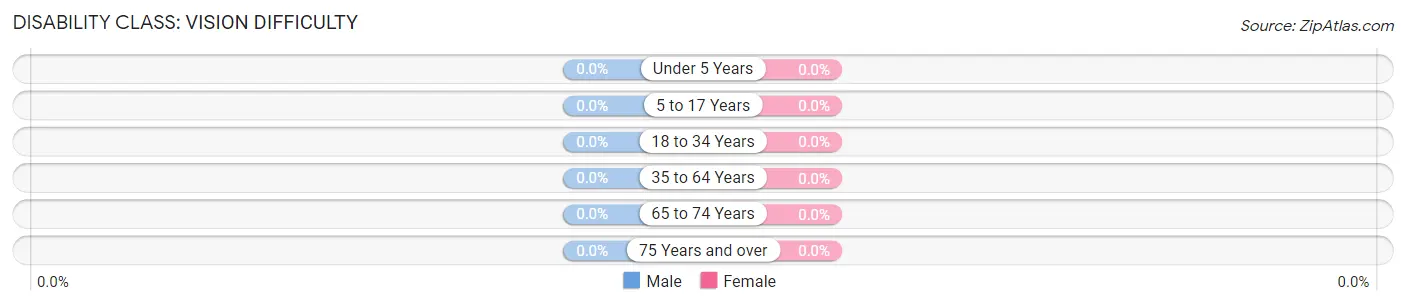
| Age Bracket | Male | Female |
| Under 5 Years | 0 (0.0%) | 0 (0.0%) |
| 5 to 17 Years | 0 (0.0%) | 0 (0.0%) |
| 18 to 34 Years | 0 (0.0%) | 0 (0.0%) |
| 35 to 64 Years | 0 (0.0%) | 0 (0.0%) |
| 65 to 74 Years | 0 (0.0%) | 0 (0.0%) |
| 75 Years and over | 0 (0.0%) | 0 (0.0%) |
Disability Class: Cognitive Difficulty
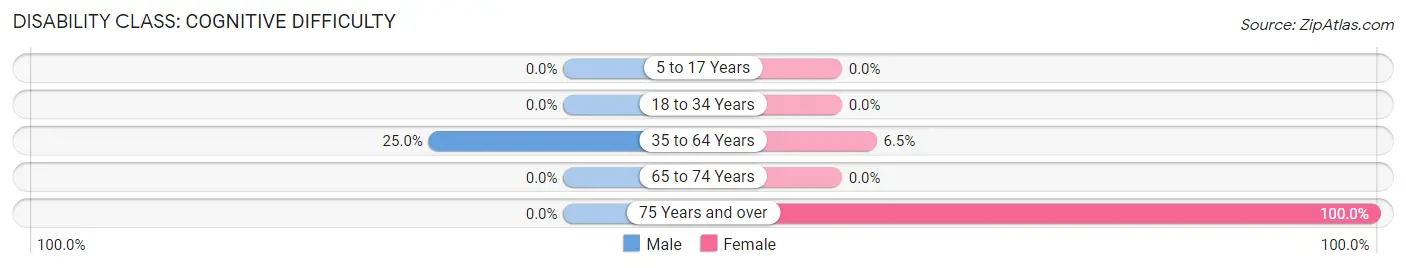
| Age Bracket | Male | Female |
| 5 to 17 Years | 0 (0.0%) | 0 (0.0%) |
| 18 to 34 Years | 0 (0.0%) | 0 (0.0%) |
| 35 to 64 Years | 15 (25.0%) | 4 (6.5%) |
| 65 to 74 Years | 0 (0.0%) | 0 (0.0%) |
| 75 Years and over | 0 (0.0%) | 10 (100.0%) |
Disability Class: Ambulatory Difficulty
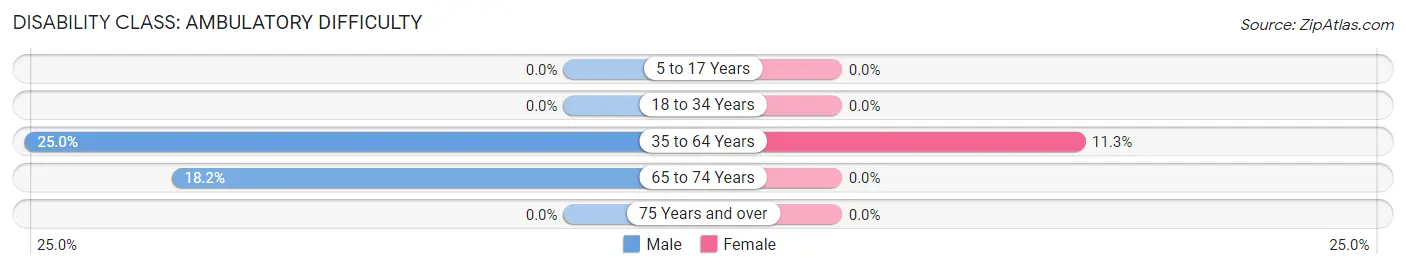
| Age Bracket | Male | Female |
| 5 to 17 Years | 0 (0.0%) | 0 (0.0%) |
| 18 to 34 Years | 0 (0.0%) | 0 (0.0%) |
| 35 to 64 Years | 15 (25.0%) | 7 (11.3%) |
| 65 to 74 Years | 2 (18.2%) | 0 (0.0%) |
| 75 Years and over | 0 (0.0%) | 0 (0.0%) |
Disability Class: Self-Care Difficulty
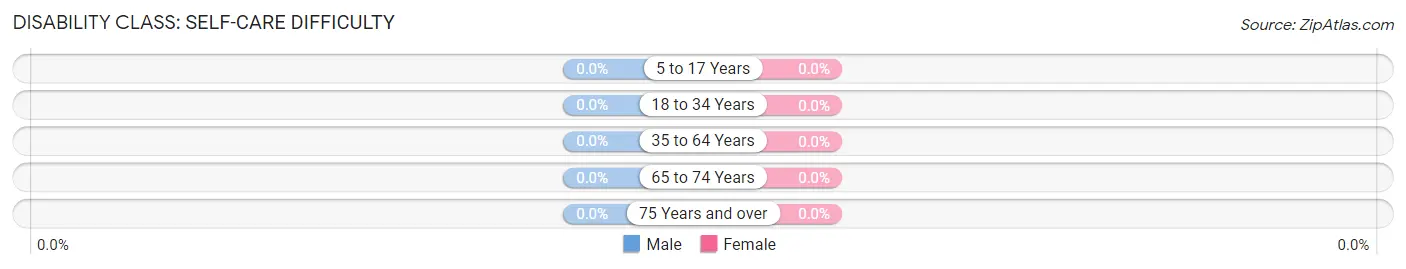
| Age Bracket | Male | Female |
| 5 to 17 Years | 0 (0.0%) | 0 (0.0%) |
| 18 to 34 Years | 0 (0.0%) | 0 (0.0%) |
| 35 to 64 Years | 0 (0.0%) | 0 (0.0%) |
| 65 to 74 Years | 0 (0.0%) | 0 (0.0%) |
| 75 Years and over | 0 (0.0%) | 0 (0.0%) |
Technology Access in El Moro
Computing Device Access in El Moro
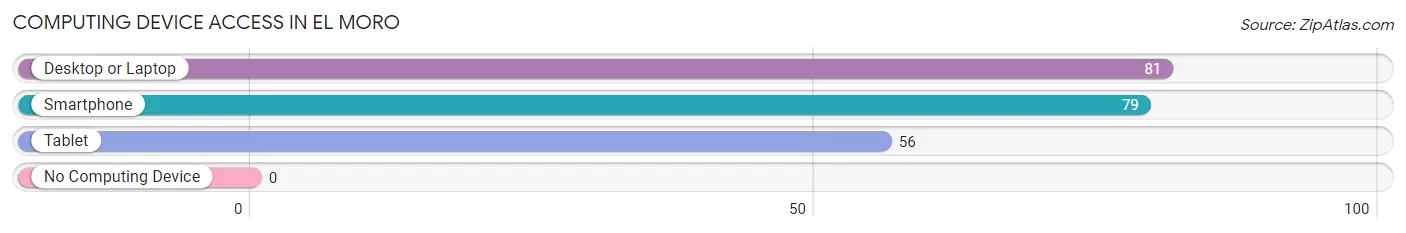
| Device Type | # Households | % Households |
| Desktop or Laptop | 81 | 86.2% |
| Smartphone | 79 | 84.0% |
| Tablet | 56 | 59.6% |
| No Computing Device | 0 | 0.0% |
| Total | 94 | 100.0% |
Internet Access in El Moro
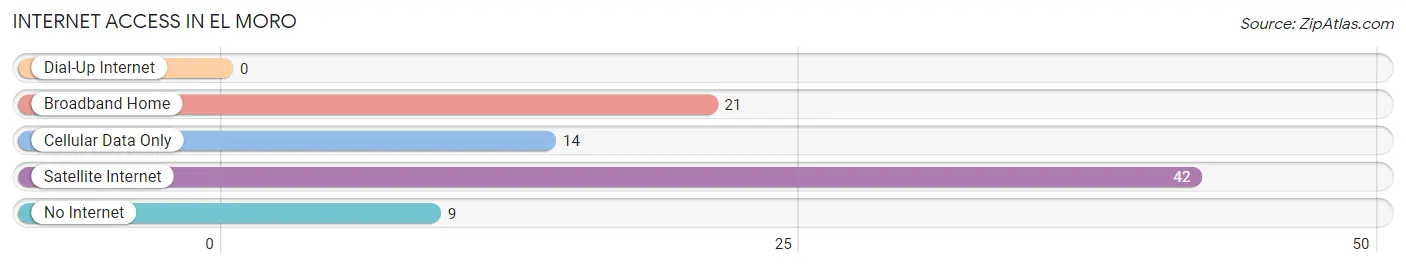
| Internet Type | # Households | % Households |
| Dial-Up Internet | 0 | 0.0% |
| Broadband Home | 21 | 22.3% |
| Cellular Data Only | 14 | 14.9% |
| Satellite Internet | 42 | 44.7% |
| No Internet | 9 | 9.6% |
| Total | 94 | 100.0% |
El Moro Summary
Moro, Colorado is a small town located in the San Luis Valley in the south-central part of the state. It is situated at an elevation of 7,845 feet and is part of the Alamosa County. The town was founded in 1881 and was named after the nearby Moro Creek. The population of Moro, Colorado was estimated to be around 200 people in 2000.
Geography
Moro, Colorado is located in the San Luis Valley, which is a large intermountain basin located in the south-central part of the state. The valley is surrounded by the Sangre de Cristo Mountains to the east and the San Juan Mountains to the west. The valley is known for its high elevation, with the town of Moro being situated at an elevation of 7,845 feet. The climate in the area is semi-arid, with hot summers and cold winters. The average annual precipitation is around 12 inches, with most of it falling in the form of snow.
Economy
The economy of Moro, Colorado is largely based on agriculture and tourism. The town is home to several farms and ranches, which produce a variety of crops and livestock. The town is also a popular tourist destination, with visitors coming to enjoy the scenic views of the surrounding mountains and valleys. The town is also home to several small businesses, including restaurants, shops, and lodging.
Demographics
The population of Moro, Colorado was estimated to be around 200 people in 2000. The majority of the population is of Hispanic or Latino origin, with the majority of the population being of Mexican descent. The median household income in the town was estimated to be around $25,000 in 2000. The town is served by the Alamosa County School District, which provides education to the children of the town.
Conclusion
Moro, Colorado is a small town located in the San Luis Valley in the south-central part of the state. It is situated at an elevation of 7,845 feet and is part of the Alamosa County. The town was founded in 1881 and was named after the nearby Moro Creek. The population of Moro, Colorado was estimated to be around 200 people in 2000. The economy of Moro, Colorado is largely based on agriculture and tourism, with the majority of the population being of Hispanic or Latino origin. The town is served by the Alamosa County School District, which provides education to the children of the town.
Common Questions
What is Per Capita Income in El Moro?
Per Capita income in El Moro is $38,084.
What is the Median Family Income in El Moro?
Median Family Income in El Moro is $104,722.
What is the Median Household income in El Moro?
Median Household Income in El Moro is $91,250.
What is Income or Wage Gap in El Moro?
Income or Wage Gap in El Moro is 16.2%.
Women in El Moro earn 83.8 cents for every dollar earned by a man.
What is Inequality or Gini Index in El Moro?
Inequality or Gini Index in El Moro is 0.18.
What is the Total Population of El Moro?
Total Population of El Moro is 220.
What is the Total Male Population of El Moro?
Total Male Population of El Moro is 121.
What is the Total Female Population of El Moro?
Total Female Population of El Moro is 99.
What is the Ratio of Males per 100 Females in El Moro?
There are 122.22 Males per 100 Females in El Moro.
What is the Ratio of Females per 100 Males in El Moro?
There are 81.82 Females per 100 Males in El Moro.
What is the Median Population Age in El Moro?
Median Population Age in El Moro is 51.4 Years.
What is the Average Family Size in El Moro
Average Family Size in El Moro is 2.7 People.
What is the Average Household Size in El Moro
Average Household Size in El Moro is 2.3 People.
How Large is the Labor Force in El Moro?
There are 173 People in the Labor Forcein in El Moro.
What is the Percentage of People in the Labor Force in El Moro?
87.4% of People are in the Labor Force in El Moro.
What is the Unemployment Rate in El Moro?
Unemployment Rate in El Moro is 5.8%.