Zip Codes with the Highest Percentage of Population Employed in Firefighting & Prevention in Denver, CO

RELATED REPORTS & OPTIONS

Firefighting & Prevention
Population
Families and Households
Female Fertility
Female Fertility (Unmarried)
Race (Community Size)
Race (Percentage)
Ancestry (Community Size)
AfghanAfricanAlaska NativeAlbanianAlsatianAmericanApacheArabArapahoArgentineanArmenianAssyrian / Chaldean / SyriacAustralianAustrianBahamianBangladeshiBarbadianBasqueBelgianBhutaneseBlackfeetBolivianBrazilianBritishBritish West IndianBulgarianBurmeseCajunCambodianCanadianCape VerdeanCelticCentral AmericanCentral American IndianCherokeeCheyenneChickasawChileanChippewaChoctawColombianComancheCosta RicanCreeCreekCroatianCrowCubanCzechCzechoslovakianDanishDelawareDominicanDutchEastern EuropeanEcuadorianEgyptianEnglishEstonianEthiopianEuropeanFijianFilipinoFinnishFrenchFrench American IndianFrench CanadianGermanGerman RussianGhanaianGreekGuamanian / ChamorroGuatemalanGuyaneseHaitianHonduranHopiHungarianIcelanderIndian (Asian)IndonesianInupiatIranianIraqiIrishIroquoisIsraeliItalianJamaicanJapaneseJordanianKenyanKiowaKoreanLaotianLatvianLebaneseLiberianLithuanianLuxembourgerMacedonianMalaysianMalteseMarshalleseMenomineeMexicanMexican American IndianMongolianMoroccanNative HawaiianNavajoNew ZealanderNicaraguanNigerianNorthern EuropeanNorwegianOkinawanOsagePakistaniPalestinianPanamanianParaguayanPennsylvania GermanPeruvianPimaPolishPortuguesePotawatomiPuebloPuerto RicanRomanianRussianSalvadoranSamoanScandinavianScotch-IrishScottishSeminoleSenegaleseSerbianShoshoneSierra LeoneanSiouxSlavicSlovakSloveneSomaliSouth AfricanSouth AmericanSouth American IndianSpaniardSpanishSpanish AmericanSpanish American IndianSri LankanSubsaharan AfricanSudaneseSwedishSwissSyrianThaiTrinidadian and TobagonianTurkishU.S. Virgin IslanderUgandanUkrainianUruguayanUteVenezuelanVietnameseWelshWest IndianYaquiYugoslavian
Ancestry (Percentage)
AfghanAfricanAlaska NativeAlbanianAlsatianAmericanApacheArabArapahoArgentineanArmenianAssyrian / Chaldean / SyriacAustralianAustrianBahamianBangladeshiBarbadianBasqueBelgianBhutaneseBlackfeetBolivianBrazilianBritishBritish West IndianBulgarianBurmeseCajunCambodianCanadianCape VerdeanCelticCentral AmericanCentral American IndianCherokeeCheyenneChickasawChileanChippewaChoctawColombianComancheCosta RicanCreeCreekCroatianCrowCubanCzechCzechoslovakianDanishDelawareDominicanDutchEastern EuropeanEcuadorianEgyptianEnglishEstonianEthiopianEuropeanFijianFilipinoFinnishFrenchFrench American IndianFrench CanadianGermanGerman RussianGhanaianGreekGuamanian / ChamorroGuatemalanGuyaneseHaitianHonduranHopiHungarianIcelanderIndian (Asian)IndonesianInupiatIranianIraqiIrishIroquoisIsraeliItalianJamaicanJapaneseJordanianKenyanKiowaKoreanLaotianLatvianLebaneseLiberianLithuanianLuxembourgerMacedonianMalaysianMalteseMarshalleseMenomineeMexicanMexican American IndianMongolianMoroccanNative HawaiianNavajoNew ZealanderNicaraguanNigerianNorthern EuropeanNorwegianOkinawanOsagePakistaniPalestinianPanamanianParaguayanPennsylvania GermanPeruvianPimaPolishPortuguesePotawatomiPuebloPuerto RicanRomanianRussianSalvadoranSamoanScandinavianScotch-IrishScottishSeminoleSenegaleseSerbianShoshoneSierra LeoneanSiouxSlavicSlovakSloveneSomaliSouth AfricanSouth AmericanSouth American IndianSpaniardSpanishSpanish AmericanSpanish American IndianSri LankanSubsaharan AfricanSudaneseSwedishSwissSyrianThaiTrinidadian and TobagonianTurkishU.S. Virgin IslanderUgandanUkrainianUruguayanUteVenezuelanVietnameseWelshWest IndianYaquiYugoslavian
Immigrant Origin (Total)
AfghanistanAfricaAlbaniaArgentinaArmeniaAsiaAustraliaAustriaBangladeshBarbadosBelarusBelgiumBoliviaBosnia and HerzegovinaBrazilBulgariaBurma / MyanmarCambodiaCameroonCanadaCaribbeanCentral AmericaChileChinaColombiaCongoCosta RicaCroatiaCubaCzechoslovakiaDenmarkDominican RepublicEastern AfricaEastern AsiaEastern EuropeEcuadorEgyptEl SalvadorEnglandEritreaEthiopiaEuropeFranceGermanyGhanaGreeceGuatemalaHaitiHondurasHong KongHungaryIndiaIndonesiaIranIraqIrelandIsraelItalyJamaicaJapanJordanKazakhstanKenyaKoreaLaosLatin AmericaLatviaLebanonLiberiaLithuaniaMalaysiaMexicoMicronesiaMiddle AfricaMoldovaMoroccoNepalNetherlandsNicaraguaNigeriaNorthern AfricaNorthern EuropeNorwayOceaniaPakistanPanamaPeruPhilippinesPolandPortugalRomaniaRussiaSaudi ArabiaScotlandSenegalSerbiaSingaporeSomaliaSouth AfricaSouth AmericaSouth Central AsiaSouth Eastern AsiaSouthern EuropeSpainSudanSwedenSwitzerlandSyriaTaiwanThailandTrinidad and TobagoTurkeyUgandaUkraineUzbekistanVenezuelaVietnamWestern AfricaWestern AsiaWestern EuropeZaire
Immigrant Origin (Percentage)
AfghanistanAfricaAlbaniaArgentinaArmeniaAsiaAustraliaAustriaBangladeshBarbadosBelarusBelgiumBoliviaBosnia and HerzegovinaBrazilBulgariaBurma / MyanmarCambodiaCameroonCanadaCaribbeanCentral AmericaChileChinaColombiaCongoCosta RicaCroatiaCubaCzechoslovakiaDenmarkDominican RepublicEastern AfricaEastern AsiaEastern EuropeEcuadorEgyptEl SalvadorEnglandEritreaEthiopiaEuropeFranceGermanyGhanaGreeceGuatemalaHaitiHondurasHong KongHungaryIndiaIndonesiaIranIraqIrelandIsraelItalyJamaicaJapanJordanKazakhstanKenyaKoreaLaosLatin AmericaLatviaLebanonLiberiaLithuaniaMalaysiaMexicoMicronesiaMiddle AfricaMoldovaMoroccoNepalNetherlandsNicaraguaNigeriaNorthern AfricaNorthern EuropeNorwayOceaniaPakistanPanamaPeruPhilippinesPolandPortugalRomaniaRussiaSaudi ArabiaScotlandSenegalSerbiaSingaporeSomaliaSouth AfricaSouth AmericaSouth Central AsiaSouth Eastern AsiaSouthern EuropeSpainSudanSwedenSwitzerlandSyriaTaiwanThailandTrinidad and TobagoTurkeyUgandaUkraineUzbekistanVenezuelaVietnamWestern AfricaWestern AsiaWestern EuropeZaire
Income
Income (Families)
Income (Households)
Poverty
Poverty (Families)
Unemployment
Employment Occupations
Employment Industries
Employer Class
Commute Time
Commute Means
School Enrollment
Education by Degree Field
Occupancy
Finances
Physical Characteristics
Denver
Compare Zip Codes
Comparison Subject

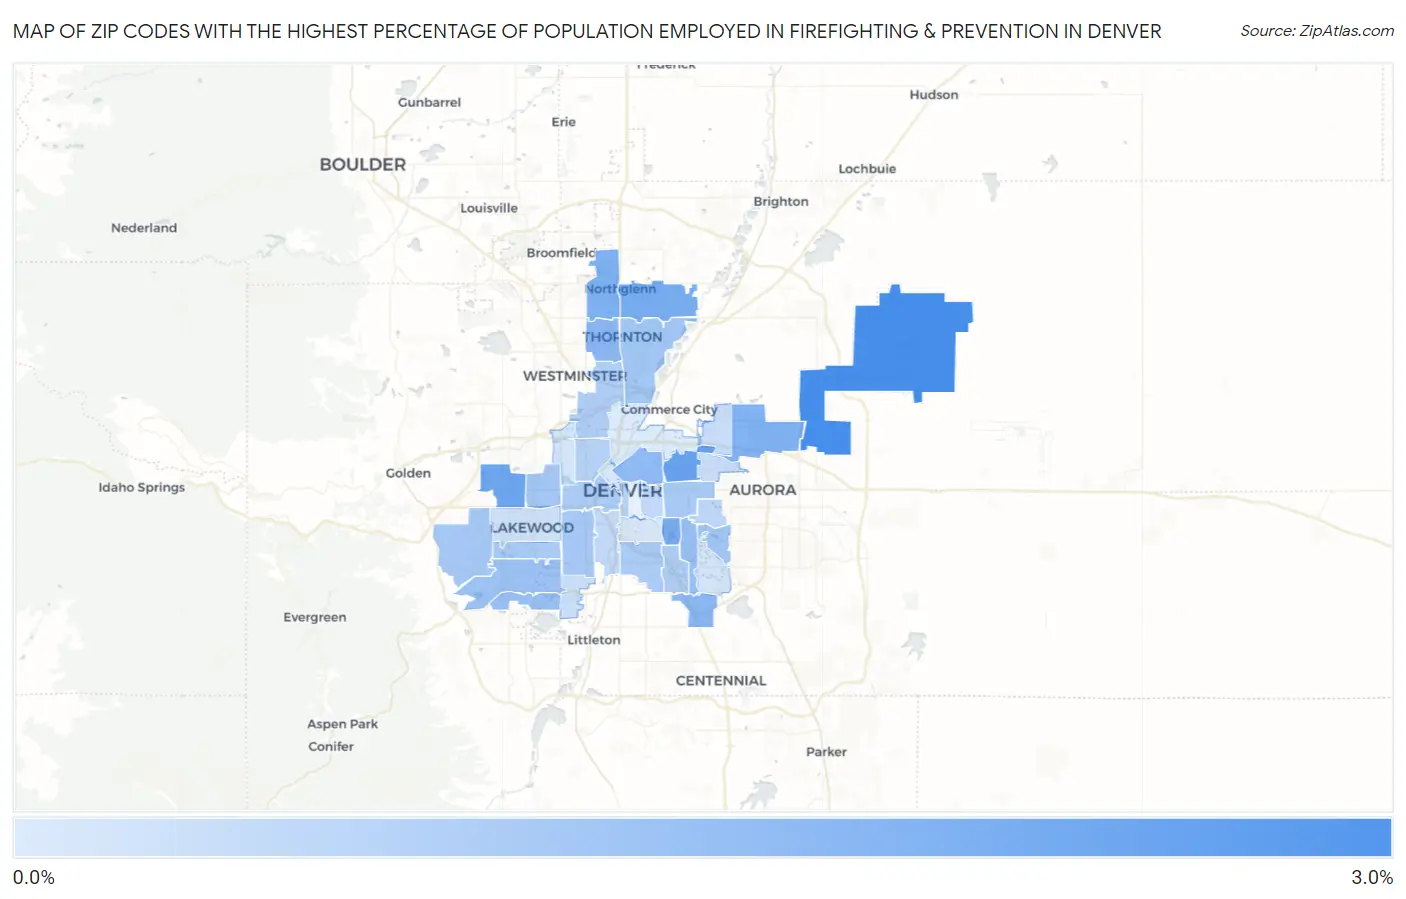
Map of Zip Codes with the Highest Percentage of Population Employed in Firefighting & Prevention in Denver

0.0%
3.0%
Zip Codes with the Highest Percentage of Population Employed in Firefighting & Prevention in Denver Map

Zip Codes with the Highest Percentage of Population Employed in Firefighting & Prevention in Denver, CO

Zip Code % Employed vs State vs National
1.802492.6%1.2%(+1.39)#481.2%(+1.39)#2,940
2.802072.1%1.2%(+0.864)#701.2%(+0.868)#4,316
3.802151.9%1.2%(+0.751)#781.2%(+0.755)#4,743
4.802331.8%1.2%(+0.630)#911.2%(+0.634)#5,260
5.802461.8%1.2%(+0.618)#931.2%(+0.622)#5,317
6.802341.7%1.2%(+0.494)#1031.2%(+0.498)#5,922
7.802391.7%1.2%(+0.461)#1051.2%(+0.465)#6,093
8.802601.5%1.2%(+0.327)#1191.2%(+0.331)#6,861
9.802371.5%1.2%(+0.303)#1231.2%(+0.308)#7,016
10.802051.4%1.2%(+0.257)#1321.2%(+0.261)#7,331
11.802241.3%1.2%(+0.105)#1501.2%(+0.109)#8,378
12.802351.3%1.2%(+0.102)#1511.2%(+0.107)#8,400
13.802271.2%1.2%(+0.055)#1571.2%(+0.059)#8,777
14.802471.1%1.2%(-0.071)#1771.2%(-0.067)#9,927
15.802291.1%1.2%(-0.072)#1781.2%(-0.068)#9,939
16.802141.1%1.2%(-0.080)#1811.2%(-0.075)#10,011
17.802191.1%1.2%(-0.111)#1881.2%(-0.107)#10,290
18.802281.1%1.2%(-0.114)#1901.2%(-0.110)#10,321
19.802201.0%1.2%(-0.173)#2021.2%(-0.169)#10,897
20.802100.99%1.2%(-0.197)#2071.2%(-0.192)#11,157
21.802320.99%1.2%(-0.197)#2081.2%(-0.193)#11,164
22.802040.97%1.2%(-0.218)#2141.2%(-0.214)#11,405
23.802220.94%1.2%(-0.253)#2161.2%(-0.249)#11,768
24.802210.93%1.2%(-0.263)#2171.2%(-0.259)#11,884
25.802110.81%1.2%(-0.379)#2341.2%(-0.374)#13,071
26.802030.78%1.2%(-0.408)#2441.2%(-0.404)#13,418
27.802300.71%1.2%(-0.481)#2581.2%(-0.477)#14,229
28.802230.62%1.2%(-0.571)#2771.2%(-0.567)#15,211
29.802060.62%1.2%(-0.572)#2781.2%(-0.568)#15,223
30.802380.53%1.2%(-0.657)#2861.2%(-0.653)#16,158
31.802360.45%1.2%(-0.743)#2941.2%(-0.739)#17,134
32.802260.42%1.2%(-0.770)#2981.2%(-0.766)#17,412
33.802120.35%1.2%(-0.839)#3091.2%(-0.835)#18,216
34.802310.33%1.2%(-0.857)#3141.2%(-0.853)#18,431
35.802020.31%1.2%(-0.884)#3181.2%(-0.880)#18,705
36.802090.23%1.2%(-0.955)#3231.2%(-0.951)#19,380
37.802160.19%1.2%(-0.998)#3281.2%(-0.994)#19,738

Common Questions

What are the Top 10 Zip Codes with the Highest Percentage of Population Employed in Firefighting & Prevention in Denver, CO?
Top 10 Zip Codes with the Highest Percentage of Population Employed in Firefighting & Prevention in Denver, CO are:
#1
2.6%
#2
2.1%
#3
1.9%
#4
1.8%
#5
1.8%
#6
1.7%
#7
1.7%
#8
1.5%
#9
1.5%
#10
1.4%
What zip code has the Highest Percentage of Population Employed in Firefighting & Prevention in Denver, CO?
80249 has the Highest Percentage of Population Employed in Firefighting & Prevention in Denver, CO with 2.6%.
What is the Percentage of Population Employed in Firefighting & Prevention in Denver, CO?
Percentage of Population Employed in Firefighting & Prevention in Denver is 0.99%.
What is the Percentage of Population Employed in Firefighting & Prevention in Colorado?
Percentage of Population Employed in Firefighting & Prevention in Colorado is 1.2%.
What is the Percentage of Population Employed in Firefighting & Prevention in the United States?
Percentage of Population Employed in Firefighting & Prevention in the United States is 1.2%.