Chickasaw Disability Age Under 5

COMPARE

Chickasaw
Race
Ancestry
AfghanAfricanAlaska NativeAlaskan AthabascanAlbanianAleutAlsatianAmericanApacheArabArapahoArgentineanArmenianAssyrian/Chaldean/SyriacAustralianAustrianBahamianBangladeshiBarbadianBasqueBelgianBelizeanBermudanBhutaneseBlackfeetBolivianBrazilianBritishBritish West IndianBulgarianBurmeseCajunCambodianCanadianCape VerdeanCarpatho RusynCelticCentral AmericanCentral American IndianCherokeeCheyenneChickasawChileanChineseChippewaChoctawColombianColvilleComancheCosta RicanCreeCreekCroatianCrowCubanCypriotCzechCzechoslovakianDanishDelawareDominicanDutchDutch West IndianEastern EuropeanEcuadorianEgyptianEnglishEstonianEthiopianEuropeanFijianFilipinoFinnishFrenchFrench American IndianFrench CanadianGermanGerman RussianGhanaianGreekGuamanian/ChamorroGuatemalanGuyaneseHaitianHmongHonduranHopiHoumaHungarianIcelanderIndian (Asian)IndonesianInupiatIranianIraqiIrishIroquoisIsraeliItalianJamaicanJapaneseJordanianKenyanKiowaKoreanLaotianLatvianLebaneseLiberianLithuanianLumbeeLuxembourgerMacedonianMalaysianMalteseMarshalleseMenomineeMexicanMexican American IndianMongolianMoroccanNative HawaiianNavajoNepaleseNew ZealanderNicaraguanNigerianNorthern EuropeanNorwegianOkinawanOsageOttawaPaiutePakistaniPalestinianPanamanianParaguayanPennsylvania GermanPeruvianPimaPolishPortuguesePotawatomiPuebloPuerto RicanPuget Sound SalishRomanianRussianSalvadoranSamoanScandinavianScotch-IrishScottishSeminoleSenegaleseSerbianShoshoneSierra LeoneanSiouxSlavicSlovakSloveneSomaliSouth AfricanSouth AmericanSouth American IndianSoviet UnionSpaniardSpanishSpanish AmericanSpanish American IndianSri LankanSubsaharan AfricanSudaneseSwedishSwissSyrianTaiwaneseThaiTlingit-HaidaTohono O'OdhamTonganTrinidadian and TobagonianTsimshianTurkishU.S. Virgin IslanderUgandanUkrainianUruguayanUteVenezuelanVietnameseWelshWest IndianYakamaYaquiYugoslavianYumanYup'ikZimbabwean
Immigration
NonimmigrantsImmigrantsAfghanistanAfricaAlbaniaArgentinaArmeniaAsiaAustraliaAustriaBahamasBangladeshBarbadosBelarusBelgiumBelizeBoliviaBosnia and HerzegovinaBrazilBulgariaBurma/MyanmarCabo VerdeCambodiaCameroonCanadaCaribbeanCentral AmericaChileChinaColombiaCongoCosta RicaCroatiaCubaCzechoslovakiaDenmarkDominicaDominican RepublicEastern AfricaEastern AsiaEastern EuropeEcuadorEgyptEl SalvadorEnglandEritreaEthiopiaEuropeFijiFranceGermanyGhanaGreeceGrenadaGuatemalaGuyanaHaitiHondurasHong KongHungaryIndiaIndonesiaIranIraqIrelandIsraelItalyJamaicaJapanJordanKazakhstanKenyaKoreaKuwaitLaosLatin AmericaLatviaLebanonLiberiaLithuaniaMalaysiaMexicoMicronesiaMiddle AfricaMoldovaMoroccoNepalNetherlandsNicaraguaNigeriaNorth AmericaNorth MacedoniaNorthern AfricaNorthern EuropeNorwayOceaniaPakistanPanamaPeruPhilippinesPolandPortugalRomaniaRussiaSaudi ArabiaScotlandSenegalSerbiaSierra LeoneSingaporeSomaliaSouth AfricaSouth AmericaSouth Central AsiaSouth Eastern AsiaSouthern EuropeSpainSri LankaSt. Vincent and the GrenadinesSudanSwedenSwitzerlandSyriaTaiwanThailandTrinidad and TobagoTurkeyUgandaUkraineUruguayUzbekistanVenezuelaVietnamWest IndiesWestern AfricaWestern AsiaWestern EuropeYemenZaireZimbabweAzores
Select to Compare
Race
Ancestry
AfghanAfricanAlaska NativeAlaskan AthabascanAlbanianAleutAlsatianAmericanApacheArabArapahoArgentineanArmenianAssyrian/Chaldean/SyriacAustralianAustrianBahamianBangladeshiBarbadianBasqueBelgianBelizeanBermudanBhutaneseBlackfeetBolivianBrazilianBritishBritish West IndianBulgarianBurmeseCajunCambodianCanadianCape VerdeanCarpatho RusynCelticCentral AmericanCentral American IndianCherokeeCheyenneChileanChineseChippewaChoctawColombianColvilleComancheCosta RicanCreeCreekCroatianCrowCubanCypriotCzechCzechoslovakianDanishDelawareDominicanDutchDutch West IndianEastern EuropeanEcuadorianEgyptianEnglishEstonianEthiopianEuropeanFijianFilipinoFinnishFrenchFrench American IndianFrench CanadianGermanGerman RussianGhanaianGreekGuamanian/ChamorroGuatemalanGuyaneseHaitianHmongHonduranHopiHoumaHungarianIcelanderIndian (Asian)IndonesianInupiatIranianIraqiIrishIroquoisIsraeliItalianJamaicanJapaneseJordanianKenyanKiowaKoreanLaotianLatvianLebaneseLiberianLithuanianLumbeeLuxembourgerMacedonianMalaysianMalteseMarshalleseMenomineeMexicanMexican American IndianMongolianMoroccanNative HawaiianNavajoNepaleseNew ZealanderNicaraguanNigerianNorthern EuropeanNorwegianOkinawanOsageOttawaPaiutePakistaniPalestinianPanamanianParaguayanPennsylvania GermanPeruvianPimaPolishPortuguesePotawatomiPuebloPuerto RicanPuget Sound SalishRomanianRussianSalvadoranSamoanScandinavianScotch-IrishScottishSeminoleSenegaleseSerbianShoshoneSierra LeoneanSiouxSlavicSlovakSloveneSomaliSouth AfricanSouth AmericanSouth American IndianSoviet UnionSpaniardSpanishSpanish AmericanSpanish American IndianSri LankanSubsaharan AfricanSudaneseSwedishSwissSyrianTaiwaneseThaiTlingit-HaidaTohono O'OdhamTonganTrinidadian and TobagonianTsimshianTurkishU.S. Virgin IslanderUgandanUkrainianUruguayanUteVenezuelanVietnameseWelshWest IndianYakamaYaquiYugoslavianYumanYup'ikZimbabwean
Immigration
NonimmigrantsImmigrantsAfghanistanAfricaAlbaniaArgentinaArmeniaAsiaAustraliaAustriaBahamasBangladeshBarbadosBelarusBelgiumBelizeBoliviaBosnia and HerzegovinaBrazilBulgariaBurma/MyanmarCabo VerdeCambodiaCameroonCanadaCaribbeanCentral AmericaChileChinaColombiaCongoCosta RicaCroatiaCubaCzechoslovakiaDenmarkDominicaDominican RepublicEastern AfricaEastern AsiaEastern EuropeEcuadorEgyptEl SalvadorEnglandEritreaEthiopiaEuropeFijiFranceGermanyGhanaGreeceGrenadaGuatemalaGuyanaHaitiHondurasHong KongHungaryIndiaIndonesiaIranIraqIrelandIsraelItalyJamaicaJapanJordanKazakhstanKenyaKoreaKuwaitLaosLatin AmericaLatviaLebanonLiberiaLithuaniaMalaysiaMexicoMicronesiaMiddle AfricaMoldovaMoroccoNepalNetherlandsNicaraguaNigeriaNorth AmericaNorth MacedoniaNorthern AfricaNorthern EuropeNorwayOceaniaPakistanPanamaPeruPhilippinesPolandPortugalRomaniaRussiaSaudi ArabiaScotlandSenegalSerbiaSierra LeoneSingaporeSomaliaSouth AfricaSouth AmericaSouth Central AsiaSouth Eastern AsiaSouthern EuropeSpainSri LankaSt. Vincent and the GrenadinesSudanSwedenSwitzerlandSyriaTaiwanThailandTrinidad and TobagoTurkeyUgandaUkraineUruguayUzbekistanVenezuelaVietnamWest IndiesWestern AfricaWestern AsiaWestern EuropeYemenZaireZimbabweAzores
Disability Age Under 5
Income
Poverty
Unemployment
Labor Participation
Family Structure
Vehicle Availability
Education Level
Disability

Chickasaw Disability Age Under 5
Tragic

1.7%
DISABILITY | AGE UNDER 5
0.0/ 100
METRIC RATING
323rd/ 347
METRIC RANK

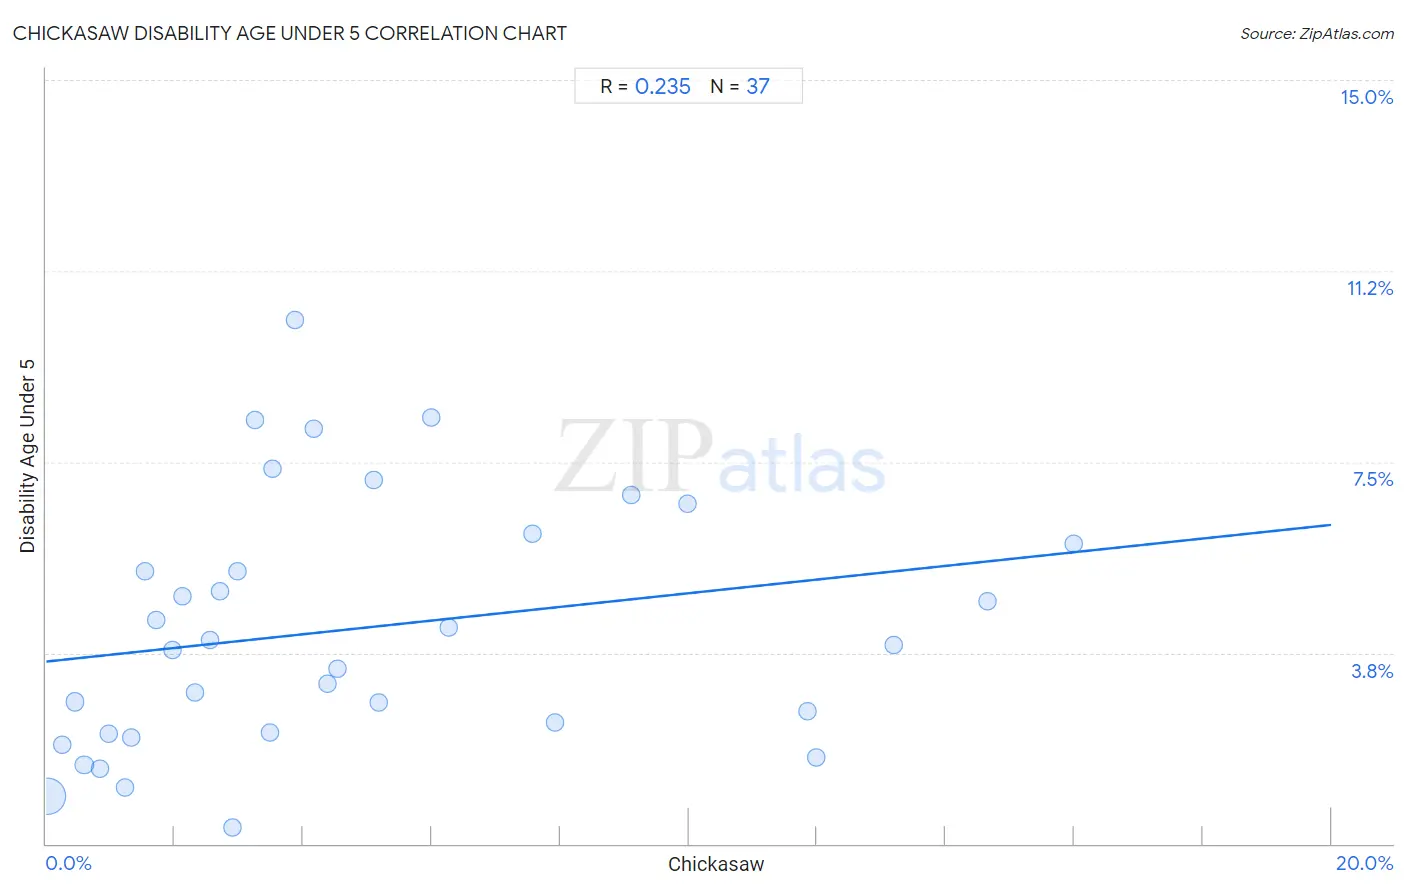
Chickasaw Disability Age Under 5 Correlation Chart

The statistical analysis conducted on geographies consisting of 108,085,172 people shows a weak positive correlation between the proportion of Chickasaw and percentage of population with a disability under the age of 5 in the United States with a correlation coefficient (R) of 0.235 and weighted average of 1.7%. On average, for every 1% (one percent) increase in Chickasaw within a typical geography, there is an increase of 0.13% in percentage of population with a disability under the age of 5.
Chickasaw Disability Age Under 5
It is essential to understand that the correlation between the percentage of Chickasaw and percentage of population with a disability under the age of 5 does not imply a direct cause-and-effect relationship. It remains uncertain whether the presence of Chickasaw influences an upward or downward trend in the level of percentage of population with a disability under the age of 5 within an area, or if Chickasaw simply ended up residing in those areas with higher or lower levels of percentage of population with a disability under the age of 5 due to other factors.

Demographics Similar to Chickasaw by Disability Age Under 5

In terms of disability age under 5, the demographic groups most similar to Chickasaw are German (1.7%, a difference of 1.1%), Ottawa (1.7%, a difference of 1.7%), Scotch-Irish (1.7%, a difference of 1.8%), Cherokee (1.8%, a difference of 1.8%), and Slovak (1.7%, a difference of 2.3%).
DemographicsRating | RankDisability Age Under 5
Immigrants from Cabo Verde
0.0
/100
|
#316
Tragic
1.7%
French
0.0
/100
|
#317
Tragic
1.7%
Irish
0.0
/100
|
#318
Tragic
1.7%
Slovaks
0.0
/100
|
#319
Tragic
1.7%
Scotch-Irish
0.0
/100
|
#320
Tragic
1.7%
Ottawa
0.0
/100
|
#321
Tragic
1.7%
Germans
0.0
/100
|
#322
Tragic
1.7%
Chickasaw
0.0
/100
|
#323
Tragic
1.7%
Cherokee
0.0
/100
|
#324
Tragic
1.8%
Immigrants from Portugal
0.0
/100
|
#325
Tragic
1.8%
Sioux
0.0
/100
|
#326
Tragic
1.8%
Osage
0.0
/100
|
#327
Tragic
1.8%
Americans
0.0
/100
|
#328
Tragic
1.9%
Houma
0.0
/100
|
#329
Tragic
1.9%
Choctaw
0.0
/100
|
#330
Tragic
1.9%

Chickasaw Disability Age Under 5 Correlation Summary

MeasurementChickasaw DataDisability Age Under 5 Data
Minimum0.025%0.31%
Maximum16.0%10.3%
Range16.0%10.0%
Mean4.8%4.2%
Median3.5%3.9%
Interquartile 25% (IQ1)1.6%2.2%
Interquartile 75% (IQ3)6.9%6.0%
Interquartile Range (IQR)5.3%3.8%
Standard Deviation (Sample)4.3%2.5%
Standard Deviation (Population)4.2%2.4%

Correlation Details

Chickasaw PercentileSample SizeDisability Age Under 5
[
0.0%
-
0.5%
]
0.025%
102,460,9710.94%
[
0.0%
-
0.5%
]
0.25%
2,738,7801.9%
[
0.0%
-
0.5%
]
0.46%
517,3772.8%
[
0.5%
-
1.0%
]
0.59%
1,079,2321.5%
[
0.5%
-
1.0%
]
0.84%
434,9981.5%
[
0.5%
-
1.0%
]
0.97%
325,8532.2%
[
1.0%
-
1.5%
]
1.22%
116,1481.1%
[
1.0%
-
1.5%
]
1.32%
102,0142.1%
[
1.5%
-
2.0%
]
1.54%
33,5695.4%
[
1.5%
-
2.0%
]
1.72%
7,4384.4%
[
1.5%
-
2.0%
]
1.97%
18,6663.8%
[
2.0%
-
2.5%
]
2.12%
9,5944.9%
[
2.0%
-
2.5%
]
2.31%
12,3643.0%
[
2.5%
-
3.0%
]
2.54%
6,1834.0%
[
2.5%
-
3.0%
]
2.70%
4,1875.0%
[
2.5%
-
3.0%
]
2.90%
44,9170.31%
[
2.5%
-
3.0%
]
2.97%
6,7065.3%
[
3.0%
-
3.5%
]
3.25%
11,3558.3%
[
3.0%
-
3.5%
]
3.48%
7,1332.2%
[
3.5%
-
4.0%
]
3.53%
2,8637.4%
[
3.5%
-
4.0%
]
3.87%
85310.3%
[
4.0%
-
4.5%
]
4.17%
1,6308.1%
[
4.0%
-
4.5%
]
4.38%
15,3583.2%
[
4.5%
-
5.0%
]
4.54%
24,7843.4%
[
5.0%
-
5.5%
]
5.09%
6877.1%
[
5.0%
-
5.5%
]
5.18%
40,2532.8%
[
5.5%
-
6.0%
]
6.00%
2,3688.4%
[
6.0%
-
6.5%
]
6.26%
1,8864.3%
[
7.5%
-
8.0%
]
7.57%
1,1236.1%
[
7.5%
-
8.0%
]
7.91%
2,0612.4%
[
9.0%
-
9.5%
]
9.11%
9666.8%
[
9.5%
-
10.0%
]
9.99%
8116.7%
[
11.5%
-
12.0%
]
11.85%
16,5372.6%
[
11.5%
-
12.0%
]
11.98%
31,3681.7%
[
13.0%
-
13.5%
]
13.20%
3,0913.9%
[
14.5%
-
15.0%
]
14.64%
5604.8%
[
15.5%
-
16.0%
]
15.98%
4885.9%