Immigrants from Israel Disability Age Under 5

COMPARE

Immigrants from Israel
Race
Ancestry
AfghanAfricanAlaska NativeAlaskan AthabascanAlbanianAleutAlsatianAmericanApacheArabArapahoArgentineanArmenianAssyrian/Chaldean/SyriacAustralianAustrianBahamianBangladeshiBarbadianBasqueBelgianBelizeanBermudanBhutaneseBlackfeetBolivianBrazilianBritishBritish West IndianBulgarianBurmeseCajunCambodianCanadianCape VerdeanCarpatho RusynCelticCentral AmericanCentral American IndianCherokeeCheyenneChickasawChileanChineseChippewaChoctawColombianColvilleComancheCosta RicanCreeCreekCroatianCrowCubanCypriotCzechCzechoslovakianDanishDelawareDominicanDutchDutch West IndianEastern EuropeanEcuadorianEgyptianEnglishEstonianEthiopianEuropeanFijianFilipinoFinnishFrenchFrench American IndianFrench CanadianGermanGerman RussianGhanaianGreekGuamanian/ChamorroGuatemalanGuyaneseHaitianHmongHonduranHopiHoumaHungarianIcelanderIndian (Asian)IndonesianInupiatIranianIraqiIrishIroquoisIsraeliItalianJamaicanJapaneseJordanianKenyanKiowaKoreanLaotianLatvianLebaneseLiberianLithuanianLumbeeLuxembourgerMacedonianMalaysianMalteseMarshalleseMenomineeMexicanMexican American IndianMongolianMoroccanNative HawaiianNavajoNepaleseNew ZealanderNicaraguanNigerianNorthern EuropeanNorwegianOkinawanOsageOttawaPaiutePakistaniPalestinianPanamanianParaguayanPennsylvania GermanPeruvianPimaPolishPortuguesePotawatomiPuebloPuerto RicanPuget Sound SalishRomanianRussianSalvadoranSamoanScandinavianScotch-IrishScottishSeminoleSenegaleseSerbianShoshoneSierra LeoneanSiouxSlavicSlovakSloveneSomaliSouth AfricanSouth AmericanSouth American IndianSoviet UnionSpaniardSpanishSpanish AmericanSpanish American IndianSri LankanSubsaharan AfricanSudaneseSwedishSwissSyrianTaiwaneseThaiTlingit-HaidaTohono O'OdhamTonganTrinidadian and TobagonianTsimshianTurkishU.S. Virgin IslanderUgandanUkrainianUruguayanUteVenezuelanVietnameseWelshWest IndianYakamaYaquiYugoslavianYumanYup'ikZimbabwean
Immigration
NonimmigrantsImmigrantsAfghanistanAfricaAlbaniaArgentinaArmeniaAsiaAustraliaAustriaBahamasBangladeshBarbadosBelarusBelgiumBelizeBoliviaBosnia and HerzegovinaBrazilBulgariaBurma/MyanmarCabo VerdeCambodiaCameroonCanadaCaribbeanCentral AmericaChileChinaColombiaCongoCosta RicaCroatiaCubaCzechoslovakiaDenmarkDominicaDominican RepublicEastern AfricaEastern AsiaEastern EuropeEcuadorEgyptEl SalvadorEnglandEritreaEthiopiaEuropeFijiFranceGermanyGhanaGreeceGrenadaGuatemalaGuyanaHaitiHondurasHong KongHungaryIndiaIndonesiaIranIraqIrelandIsraelItalyJamaicaJapanJordanKazakhstanKenyaKoreaKuwaitLaosLatin AmericaLatviaLebanonLiberiaLithuaniaMalaysiaMexicoMicronesiaMiddle AfricaMoldovaMoroccoNepalNetherlandsNicaraguaNigeriaNorth AmericaNorth MacedoniaNorthern AfricaNorthern EuropeNorwayOceaniaPakistanPanamaPeruPhilippinesPolandPortugalRomaniaRussiaSaudi ArabiaScotlandSenegalSerbiaSierra LeoneSingaporeSomaliaSouth AfricaSouth AmericaSouth Central AsiaSouth Eastern AsiaSouthern EuropeSpainSri LankaSt. Vincent and the GrenadinesSudanSwedenSwitzerlandSyriaTaiwanThailandTrinidad and TobagoTurkeyUgandaUkraineUruguayUzbekistanVenezuelaVietnamWest IndiesWestern AfricaWestern AsiaWestern EuropeYemenZaireZimbabweAzores
Select to Compare
Race
Ancestry
AfghanAfricanAlaska NativeAlaskan AthabascanAlbanianAleutAlsatianAmericanApacheArabArapahoArgentineanArmenianAssyrian/Chaldean/SyriacAustralianAustrianBahamianBangladeshiBarbadianBasqueBelgianBelizeanBermudanBhutaneseBlackfeetBolivianBrazilianBritishBritish West IndianBulgarianBurmeseCajunCambodianCanadianCape VerdeanCarpatho RusynCelticCentral AmericanCentral American IndianCherokeeCheyenneChickasawChileanChineseChippewaChoctawColombianColvilleComancheCosta RicanCreeCreekCroatianCrowCubanCypriotCzechCzechoslovakianDanishDelawareDominicanDutchDutch West IndianEastern EuropeanEcuadorianEgyptianEnglishEstonianEthiopianEuropeanFijianFilipinoFinnishFrenchFrench American IndianFrench CanadianGermanGerman RussianGhanaianGreekGuamanian/ChamorroGuatemalanGuyaneseHaitianHmongHonduranHopiHoumaHungarianIcelanderIndian (Asian)IndonesianInupiatIranianIraqiIrishIroquoisIsraeliItalianJamaicanJapaneseJordanianKenyanKiowaKoreanLaotianLatvianLebaneseLiberianLithuanianLumbeeLuxembourgerMacedonianMalaysianMalteseMarshalleseMenomineeMexicanMexican American IndianMongolianMoroccanNative HawaiianNavajoNepaleseNew ZealanderNicaraguanNigerianNorthern EuropeanNorwegianOkinawanOsageOttawaPaiutePakistaniPalestinianPanamanianParaguayanPennsylvania GermanPeruvianPimaPolishPortuguesePotawatomiPuebloPuerto RicanPuget Sound SalishRomanianRussianSalvadoranSamoanScandinavianScotch-IrishScottishSeminoleSenegaleseSerbianShoshoneSierra LeoneanSiouxSlavicSlovakSloveneSomaliSouth AfricanSouth AmericanSouth American IndianSoviet UnionSpaniardSpanishSpanish AmericanSpanish American IndianSri LankanSubsaharan AfricanSudaneseSwedishSwissSyrianTaiwaneseThaiTlingit-HaidaTohono O'OdhamTonganTrinidadian and TobagonianTsimshianTurkishU.S. Virgin IslanderUgandanUkrainianUruguayanUteVenezuelanVietnameseWelshWest IndianYakamaYaquiYugoslavianYumanYup'ikZimbabwean
Immigration
NonimmigrantsImmigrantsAfghanistanAfricaAlbaniaArgentinaArmeniaAsiaAustraliaAustriaBahamasBangladeshBarbadosBelarusBelgiumBelizeBoliviaBosnia and HerzegovinaBrazilBulgariaBurma/MyanmarCabo VerdeCambodiaCameroonCanadaCaribbeanCentral AmericaChileChinaColombiaCongoCosta RicaCroatiaCubaCzechoslovakiaDenmarkDominicaDominican RepublicEastern AfricaEastern AsiaEastern EuropeEcuadorEgyptEl SalvadorEnglandEritreaEthiopiaEuropeFijiFranceGermanyGhanaGreeceGrenadaGuatemalaGuyanaHaitiHondurasHong KongHungaryIndiaIndonesiaIranIraqIrelandItalyJamaicaJapanJordanKazakhstanKenyaKoreaKuwaitLaosLatin AmericaLatviaLebanonLiberiaLithuaniaMalaysiaMexicoMicronesiaMiddle AfricaMoldovaMoroccoNepalNetherlandsNicaraguaNigeriaNorth AmericaNorth MacedoniaNorthern AfricaNorthern EuropeNorwayOceaniaPakistanPanamaPeruPhilippinesPolandPortugalRomaniaRussiaSaudi ArabiaScotlandSenegalSerbiaSierra LeoneSingaporeSomaliaSouth AfricaSouth AmericaSouth Central AsiaSouth Eastern AsiaSouthern EuropeSpainSri LankaSt. Vincent and the GrenadinesSudanSwedenSwitzerlandSyriaTaiwanThailandTrinidad and TobagoTurkeyUgandaUkraineUruguayUzbekistanVenezuelaVietnamWest IndiesWestern AfricaWestern AsiaWestern EuropeYemenZaireZimbabweAzores
Disability Age Under 5
Income
Poverty
Unemployment
Labor Participation
Family Structure
Vehicle Availability
Education Level
Disability

Immigrants from Israel Disability Age Under 5
Exceptional

0.96%
DISABILITY | AGE UNDER 5
100.0/ 100
METRIC RATING
16th/ 347
METRIC RANK

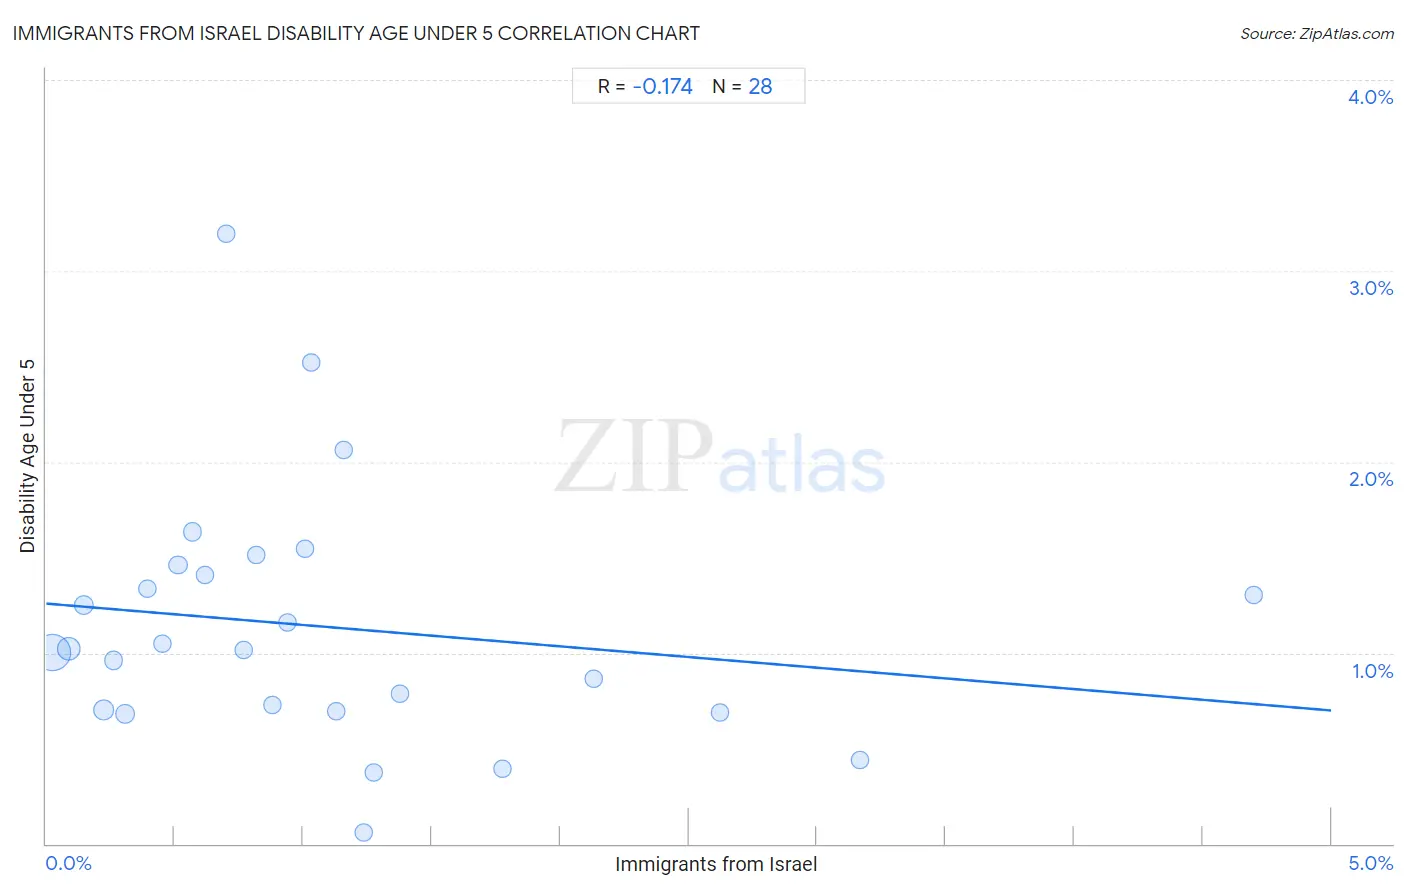
Immigrants from Israel Disability Age Under 5 Correlation Chart

The statistical analysis conducted on geographies consisting of 133,347,398 people shows a poor negative correlation between the proportion of Immigrants from Israel and percentage of population with a disability under the age of 5 in the United States with a correlation coefficient (R) of -0.174 and weighted average of 0.96%. On average, for every 1% (one percent) increase in Immigrants from Israel within a typical geography, there is a decrease of 0.11% in percentage of population with a disability under the age of 5.
Immigrants from Israel Disability Age Under 5
It is essential to understand that the correlation between the percentage of Immigrants from Israel and percentage of population with a disability under the age of 5 does not imply a direct cause-and-effect relationship. It remains uncertain whether the presence of Immigrants from Israel influences an upward or downward trend in the level of percentage of population with a disability under the age of 5 within an area, or if Immigrants from Israel simply ended up residing in those areas with higher or lower levels of percentage of population with a disability under the age of 5 due to other factors.

Demographics Similar to Immigrants from Israel by Disability Age Under 5

In terms of disability age under 5, the demographic groups most similar to Immigrants from Israel are Immigrants from China (0.96%, a difference of 0.41%), Immigrants from Barbados (0.97%, a difference of 1.0%), Immigrants from Hong Kong (0.95%, a difference of 1.3%), Yuman (0.95%, a difference of 1.3%), and Puget Sound Salish (0.97%, a difference of 1.4%).
DemographicsRating | RankDisability Age Under 5
Immigrants from Fiji
100.0
/100
|
#9
Exceptional
0.92%
Marshallese
100.0
/100
|
#10
Exceptional
0.94%
Afghans
100.0
/100
|
#11
Exceptional
0.94%
Immigrants from Grenada
100.0
/100
|
#12
Exceptional
0.94%
Soviet Union
100.0
/100
|
#13
Exceptional
0.95%
Yuman
100.0
/100
|
#14
Exceptional
0.95%
Immigrants from Hong Kong
100.0
/100
|
#15
Exceptional
0.95%
Immigrants from Israel
100.0
/100
|
#16
Exceptional
0.96%
Immigrants from China
100.0
/100
|
#17
Exceptional
0.96%
Immigrants from Barbados
100.0
/100
|
#18
Exceptional
0.97%
Puget Sound Salish
100.0
/100
|
#19
Exceptional
0.97%
Nepalese
100.0
/100
|
#20
Exceptional
0.97%
British West Indians
100.0
/100
|
#21
Exceptional
0.99%
Immigrants from Iran
100.0
/100
|
#22
Exceptional
1.00%
Yakama
100.0
/100
|
#23
Exceptional
1.00%

Immigrants from Israel Disability Age Under 5 Correlation Summary

MeasurementImmigrants from Israel DataDisability Age Under 5 Data
Minimum0.025%0.058%
Maximum4.7%3.2%
Range4.7%3.1%
Mean1.1%1.1%
Median0.85%1.0%
Interquartile 25% (IQ1)0.42%0.70%
Interquartile 75% (IQ3)1.3%1.4%
Interquartile Range (IQR)0.83%0.74%
Standard Deviation (Sample)1.0%0.66%
Standard Deviation (Population)1.0%0.65%

Correlation Details

Immigrants from Israel PercentileSample SizeDisability Age Under 5
[
0.0%
-
0.5%
]
0.025%
83,464,3651.0%
[
0.0%
-
0.5%
]
0.088%
21,935,8101.0%
[
0.0%
-
0.5%
]
0.14%
5,135,4701.2%
[
0.0%
-
0.5%
]
0.23%
11,511,7390.70%
[
0.0%
-
0.5%
]
0.26%
1,886,8250.96%
[
0.0%
-
0.5%
]
0.31%
4,782,4670.68%
[
0.0%
-
0.5%
]
0.39%
796,8061.3%
[
0.0%
-
0.5%
]
0.45%
632,4591.0%
[
0.5%
-
1.0%
]
0.51%
555,5231.5%
[
0.5%
-
1.0%
]
0.57%
275,8741.6%
[
0.5%
-
1.0%
]
0.62%
243,2601.4%
[
0.5%
-
1.0%
]
0.70%
154,0473.2%
[
0.5%
-
1.0%
]
0.77%
262,7011.0%
[
0.5%
-
1.0%
]
0.82%
177,1281.5%
[
0.5%
-
1.0%
]
0.88%
409,2910.72%
[
0.5%
-
1.0%
]
0.94%
312,0611.2%
[
1.0%
-
1.5%
]
1.01%
74,4261.5%
[
1.0%
-
1.5%
]
1.03%
25,2182.5%
[
1.0%
-
1.5%
]
1.13%
178,4950.69%
[
1.0%
-
1.5%
]
1.16%
104,9202.1%
[
1.0%
-
1.5%
]
1.24%
92,2830.058%
[
1.0%
-
1.5%
]
1.27%
74,7550.37%
[
1.0%
-
1.5%
]
1.37%
43,2860.79%
[
1.5%
-
2.0%
]
1.77%
63,0110.39%
[
2.0%
-
2.5%
]
2.13%
26,5950.86%
[
2.5%
-
3.0%
]
2.62%
62,6980.69%
[
3.0%
-
3.5%
]
3.17%
34,3680.44%
[
4.5%
-
5.0%
]
4.70%
31,5171.3%