States with the Lowest Percentage of Births to Unmarried Women over the Age of 35
RELATED REPORTS & OPTIONS
Lowest Illegitimacy | Women 35+
United States
Compare States
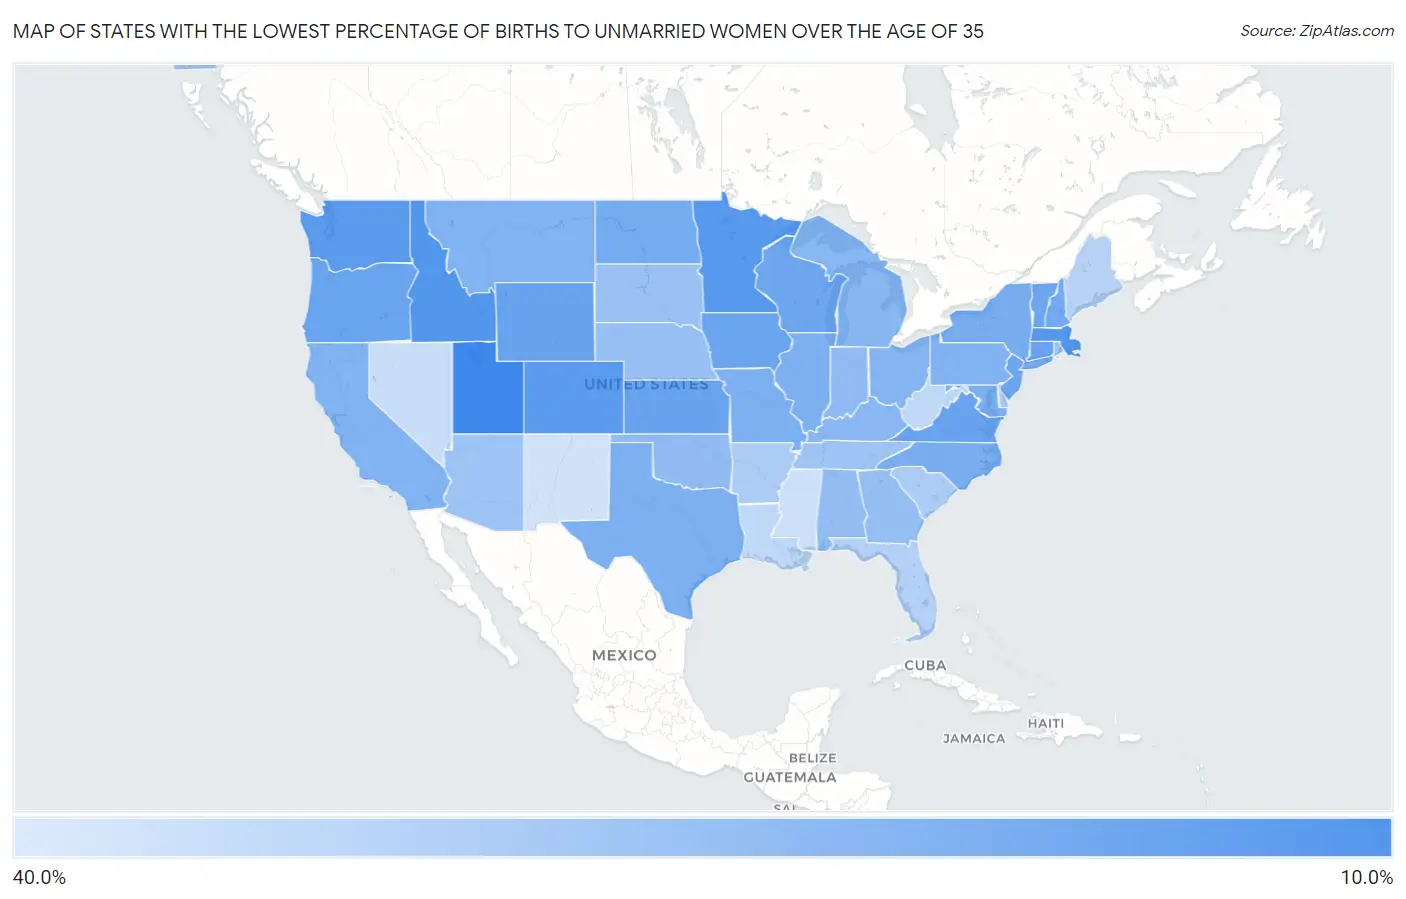
Map of States with the Lowest Percentage of Births to Unmarried Women over the Age of 35
40.0%
10.0%
States with the Lowest Percentage of Births to Unmarried Women over the Age of 35 in the United States
| State | % Unmarried | vs State Median | vs National | |
| 1. | Utah | 11.4% | 19.9% (-8.45) | 20.1%(-8.70) |
| 2. | Idaho | 14.3% | 19.9% (-5.55) | 20.1%(-5.80) |
| 3. | Massachusetts | 14.4% | 19.9% (-5.45) | 20.1%(-5.70) |
| 4. | Minnesota | 14.8% | 19.9% (-5.05) | 20.1%(-5.30) |
| 5. | Colorado | 15.3% | 19.9% (-4.55) | 20.1%(-4.80) |
| 6. | Washington | 15.4% | 19.9% (-4.45) | 20.1%(-4.70) |
| 7. | Wyoming | 16.6% | 19.9% (-3.25) | 20.1%(-3.50) |
| 8. | Virginia | 16.7% | 19.9% (-3.15) | 20.1%(-3.40) |
| 9. | Connecticut | 16.7% | 19.9% (-3.15) | 20.1%(-3.40) |
| 10. | Kansas | 16.8% | 19.9% (-3.05) | 20.1%(-3.30) |
| 11. | Oregon | 16.9% | 19.9% (-2.95) | 20.1%(-3.20) |
| 12. | Iowa | 17.2% | 19.9% (-2.65) | 20.1%(-2.90) |
| 13. | New Jersey | 17.5% | 19.9% (-2.35) | 20.1%(-2.60) |
| 14. | Vermont | 17.6% | 19.9% (-2.25) | 20.1%(-2.50) |
| 15. | Wisconsin | 17.7% | 19.9% (-2.15) | 20.1%(-2.40) |
| 16. | New Hampshire | 18.1% | 19.9% (-1.75) | 20.1%(-2.00) |
| 17. | Hawaii | 18.3% | 19.9% (-1.55) | 20.1%(-1.80) |
| 18. | North Dakota | 18.6% | 19.9% (-1.25) | 20.1%(-1.50) |
| 19. | New York | 18.7% | 19.9% (-1.15) | 20.1%(-1.40) |
| 20. | North Carolina | 19.1% | 19.9% (-0.750) | 20.1%(-1.00) |
| 21. | Illinois | 19.2% | 19.9% (-0.650) | 20.1%(-0.900) |
| 22. | Missouri | 19.2% | 19.9% (-0.650) | 20.1%(-0.900) |
| 23. | Texas | 19.4% | 19.9% (-0.450) | 20.1%(-0.700) |
| 24. | Maryland | 19.5% | 19.9% (-0.350) | 20.1%(-0.600) |
| 25. | California | 19.8% | 19.9% (-0.050) | 20.1%(-0.300) |
| 26. | Pennsylvania | 19.9% | 19.9% (+0.050) | 20.1%(-0.200) |
| 27. | Montana | 19.9% | 19.9% (+0.050) | 20.1%(-0.200) |
| 28. | Ohio | 20.4% | 19.9% (+0.550) | 20.1%(+0.300) |
| 29. | Michigan | 20.9% | 19.9% (+1.05) | 20.1%(+0.800) |
| 30. | Kentucky | 21.0% | 19.9% (+1.15) | 20.1%(+0.900) |
| 31. | Oklahoma | 22.0% | 19.9% (+2.15) | 20.1%(+1.90) |
| 32. | Indiana | 22.1% | 19.9% (+2.25) | 20.1%(+2.00) |
| 33. | Alabama | 22.4% | 19.9% (+2.55) | 20.1%(+2.30) |
| 34. | Georgia | 22.7% | 19.9% (+2.85) | 20.1%(+2.60) |
| 35. | Nebraska | 22.8% | 19.9% (+2.95) | 20.1%(+2.70) |
| 36. | South Dakota | 23.3% | 19.9% (+3.45) | 20.1%(+3.20) |
| 37. | Tennessee | 23.8% | 19.9% (+3.95) | 20.1%(+3.70) |
| 38. | Arizona | 23.9% | 19.9% (+4.05) | 20.1%(+3.80) |
| 39. | Rhode Island | 24.2% | 19.9% (+4.35) | 20.1%(+4.10) |
| 40. | Alaska | 24.9% | 19.9% (+5.05) | 20.1%(+4.80) |
| 41. | Delaware | 25.0% | 19.9% (+5.15) | 20.1%(+4.90) |
| 42. | South Carolina | 25.7% | 19.9% (+5.85) | 20.1%(+5.60) |
| 43. | Arkansas | 25.7% | 19.9% (+5.85) | 20.1%(+5.60) |
| 44. | Florida | 26.5% | 19.9% (+6.65) | 20.1%(+6.40) |
| 45. | Maine | 27.1% | 19.9% (+7.25) | 20.1%(+7.00) |
| 46. | West Virginia | 28.5% | 19.9% (+8.65) | 20.1%(+8.40) |
| 47. | Louisiana | 28.6% | 19.9% (+8.75) | 20.1%(+8.50) |
| 48. | Nevada | 29.3% | 19.9% (+9.45) | 20.1%(+9.20) |
| 49. | Mississippi | 29.9% | 19.9% (+10.0) | 20.1%(+9.80) |
| 50. | New Mexico | 30.7% | 19.9% (+10.8) | 20.1%(+10.6) |
1
Common Questions
What are the Top 10 States with the Lowest Percentage of Births to Unmarried Women over the Age of 35 in the United States?
Top 10 States with the Lowest Percentage of Births to Unmarried Women over the Age of 35 in the United States are:
#1
11.4%
#2
14.3%
#3
14.4%
#4
14.8%
#5
15.3%
#6
15.4%
#7
16.6%
#8
16.7%
#9
16.7%
#10
16.8%
What state has the Lowest Percentage of Births to Unmarried Women over the Age of 35 in the United States?
Utah has the Lowest Percentage of Births to Unmarried Women over the Age of 35 in the United States with 11.4%.
What is the Percentage of Births to Unmarried Women over the Age of 35 in the United States?
Percentage of Births to Unmarried Women over the Age of 35 in the United States is 20.1%.