Immigrants from Denmark Disability Age Under 5
COMPARE
Immigrants from Denmark
Select to Compare
Disability Age Under 5
Immigrants from Denmark Disability Age Under 5
1.1%
DISABILITY | AGE UNDER 5
98.1/ 100
METRIC RATING
77th/ 347
METRIC RANK
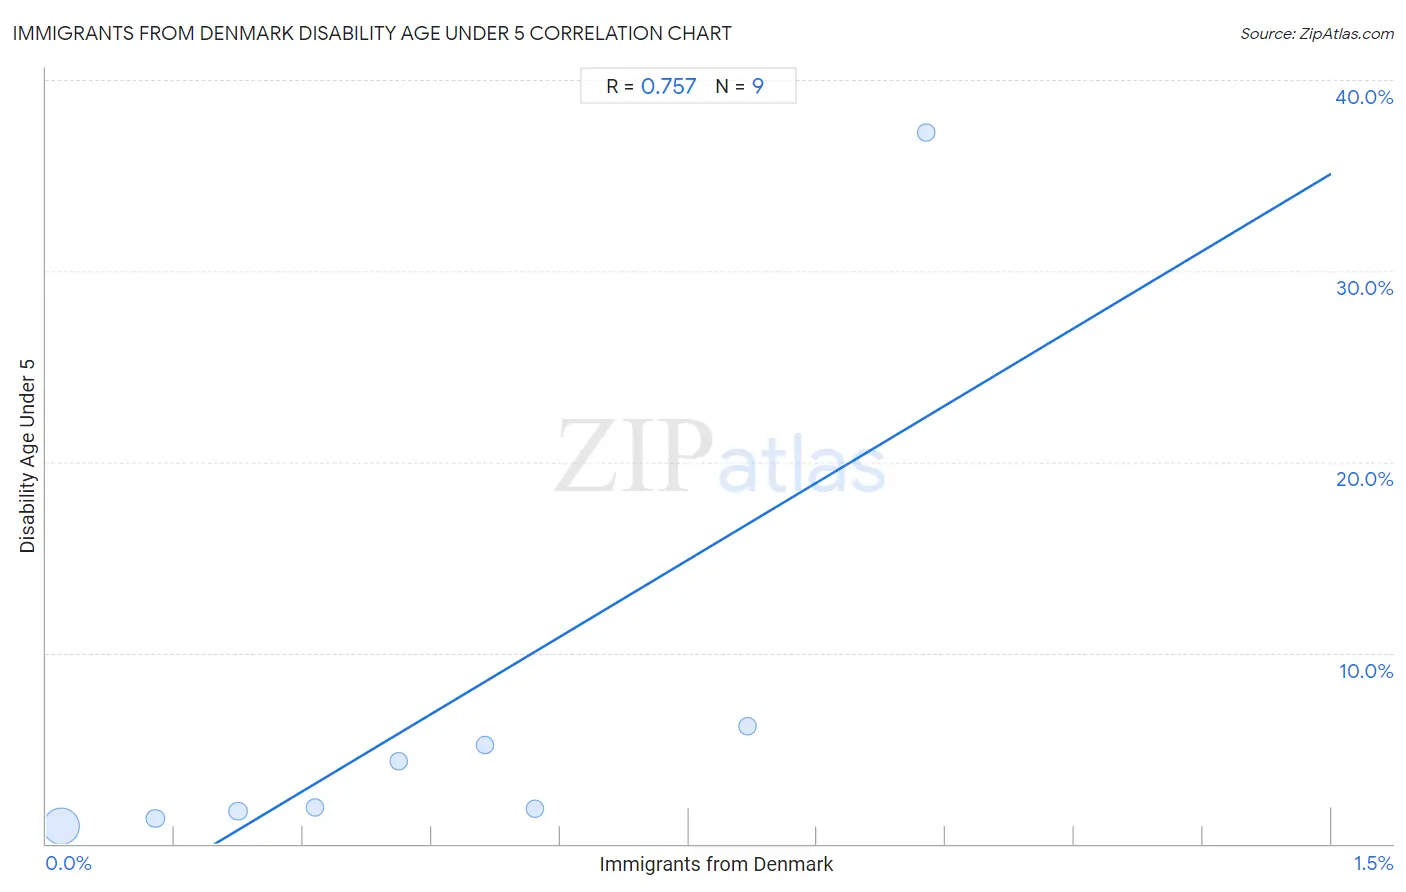
Immigrants from Denmark Disability Age Under 5 Correlation Chart
The statistical analysis conducted on geographies consisting of 97,246,779 people shows a strong positive correlation between the proportion of Immigrants from Denmark and percentage of population with a disability under the age of 5 in the United States with a correlation coefficient (R) of 0.757 and weighted average of 1.1%. On average, for every 1% (one percent) increase in Immigrants from Denmark within a typical geography, there is an increase of 26.9% in percentage of population with a disability under the age of 5.
It is essential to understand that the correlation between the percentage of Immigrants from Denmark and percentage of population with a disability under the age of 5 does not imply a direct cause-and-effect relationship. It remains uncertain whether the presence of Immigrants from Denmark influences an upward or downward trend in the level of percentage of population with a disability under the age of 5 within an area, or if Immigrants from Denmark simply ended up residing in those areas with higher or lower levels of percentage of population with a disability under the age of 5 due to other factors.
Demographics Similar to Immigrants from Denmark by Disability Age Under 5
In terms of disability age under 5, the demographic groups most similar to Immigrants from Denmark are West Indian (1.1%, a difference of 0.12%), Immigrants from Burma/Myanmar (1.1%, a difference of 0.14%), Hmong (1.1%, a difference of 0.14%), Immigrants from Trinidad and Tobago (1.1%, a difference of 0.16%), and Turkish (1.1%, a difference of 0.18%).
| Demographics | Rating | Rank | Disability Age Under 5 |
| Immigrants from Ecuador | 98.6 /100 | #70 | Exceptional 1.1% |
| Trinidadians and Tobagonians | 98.6 /100 | #71 | Exceptional 1.1% |
| Burmese | 98.5 /100 | #72 | Exceptional 1.1% |
| Immigrants from Sri Lanka | 98.5 /100 | #73 | Exceptional 1.1% |
| Jordanians | 98.5 /100 | #74 | Exceptional 1.1% |
| Immigrants from Pakistan | 98.4 /100 | #75 | Exceptional 1.1% |
| Immigrants from Burma/Myanmar | 98.2 /100 | #76 | Exceptional 1.1% |
| Immigrants from Denmark | 98.1 /100 | #77 | Exceptional 1.1% |
| West Indians | 98.0 /100 | #78 | Exceptional 1.1% |
| Hmong | 98.0 /100 | #79 | Exceptional 1.1% |
| Immigrants from Trinidad and Tobago | 98.0 /100 | #80 | Exceptional 1.1% |
| Turks | 98.0 /100 | #81 | Exceptional 1.1% |
| Immigrants from Jordan | 97.9 /100 | #82 | Exceptional 1.1% |
| Immigrants from Syria | 97.9 /100 | #83 | Exceptional 1.1% |
| Immigrants from Zaire | 97.8 /100 | #84 | Exceptional 1.1% |
Immigrants from Denmark Disability Age Under 5 Correlation Summary
| Measurement | Immigrants from Denmark Data | Disability Age Under 5 Data |
| Minimum | 0.018% | 0.89% |
| Maximum | 1.0% | 37.3% |
| Range | 1.0% | 36.4% |
| Mean | 0.45% | 6.7% |
| Median | 0.41% | 1.9% |
| Interquartile 25% (IQ1) | 0.18% | 1.5% |
| Interquartile 75% (IQ3) | 0.69% | 5.7% |
| Interquartile Range (IQR) | 0.52% | 4.1% |
| Standard Deviation (Sample) | 0.33% | 11.6% |
| Standard Deviation (Population) | 0.31% | 10.9% |
Correlation Details
| Immigrants from Denmark Percentile | Sample Size | Disability Age Under 5 |
[ 0.0% - 0.5% ] 0.018% | 93,734,465 | 0.89% |
[ 0.0% - 0.5% ] 0.13% | 2,582,187 | 1.3% |
[ 0.0% - 0.5% ] 0.22% | 591,166 | 1.7% |
[ 0.0% - 0.5% ] 0.31% | 197,699 | 1.9% |
[ 0.0% - 0.5% ] 0.41% | 80,816 | 4.3% |
[ 0.5% - 1.0% ] 0.51% | 21,473 | 5.1% |
[ 0.5% - 1.0% ] 0.57% | 36,462 | 1.8% |
[ 0.5% - 1.0% ] 0.82% | 1,343 | 6.2% |
[ 1.0% - 1.5% ] 1.03% | 1,168 | 37.3% |