Immigrants from Burma/Myanmar Disability Age Under 5
COMPARE
Immigrants from Burma/Myanmar
Select to Compare
Disability Age Under 5
Immigrants from Burma/Myanmar Disability Age Under 5
1.1%
DISABILITY | AGE UNDER 5
98.2/ 100
METRIC RATING
76th/ 347
METRIC RANK
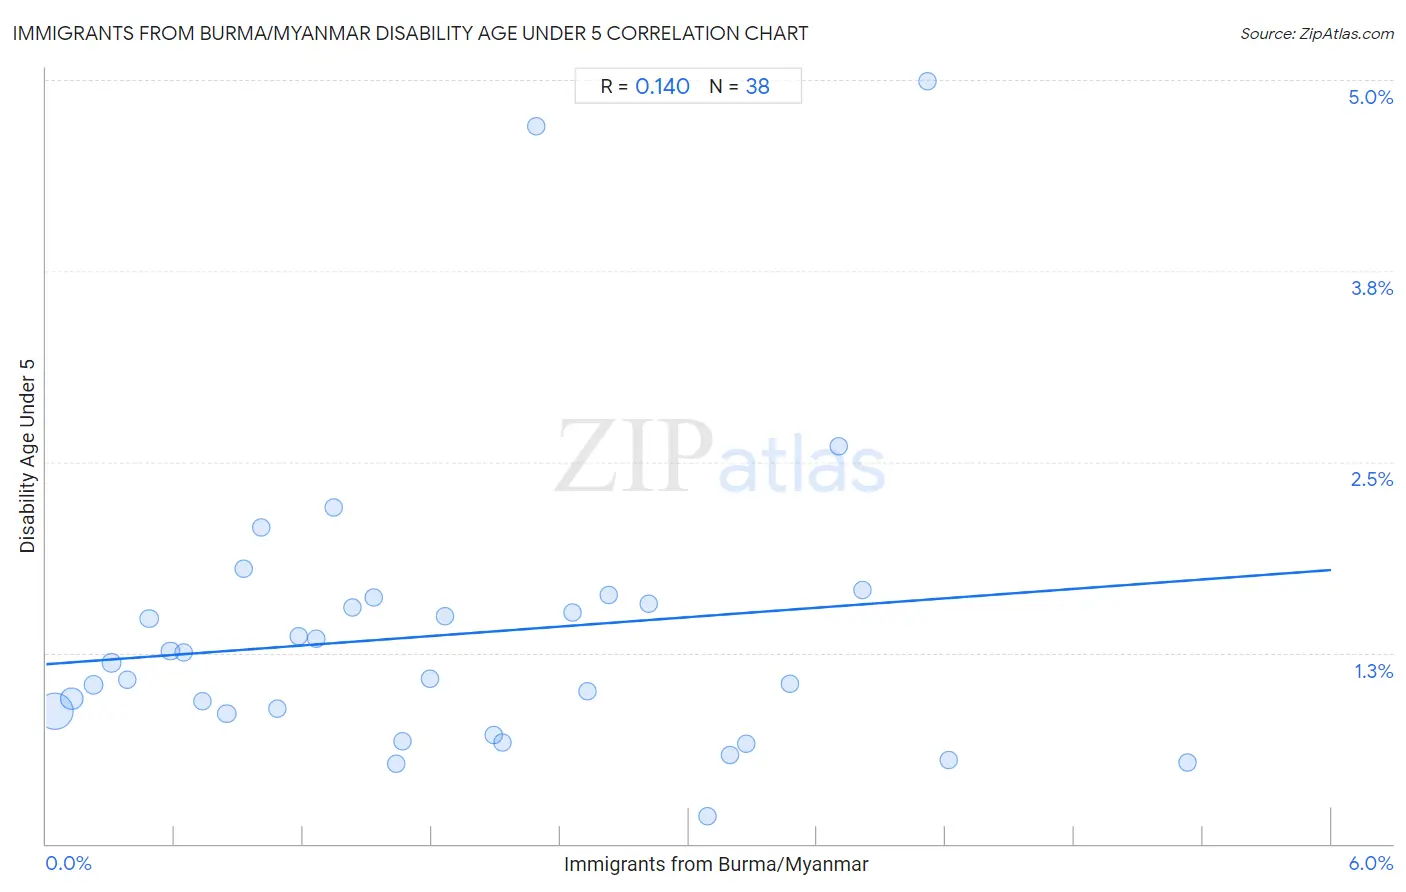
Immigrants from Burma/Myanmar Disability Age Under 5 Correlation Chart
The statistical analysis conducted on geographies consisting of 121,763,943 people shows a poor positive correlation between the proportion of Immigrants from Burma/Myanmar and percentage of population with a disability under the age of 5 in the United States with a correlation coefficient (R) of 0.140 and weighted average of 1.1%. On average, for every 1% (one percent) increase in Immigrants from Burma/Myanmar within a typical geography, there is an increase of 0.10% in percentage of population with a disability under the age of 5.
It is essential to understand that the correlation between the percentage of Immigrants from Burma/Myanmar and percentage of population with a disability under the age of 5 does not imply a direct cause-and-effect relationship. It remains uncertain whether the presence of Immigrants from Burma/Myanmar influences an upward or downward trend in the level of percentage of population with a disability under the age of 5 within an area, or if Immigrants from Burma/Myanmar simply ended up residing in those areas with higher or lower levels of percentage of population with a disability under the age of 5 due to other factors.
Demographics Similar to Immigrants from Burma/Myanmar by Disability Age Under 5
In terms of disability age under 5, the demographic groups most similar to Immigrants from Burma/Myanmar are Immigrants from Denmark (1.1%, a difference of 0.14%), Immigrants from Pakistan (1.1%, a difference of 0.26%), West Indian (1.1%, a difference of 0.26%), Hmong (1.1%, a difference of 0.28%), and Immigrants from Trinidad and Tobago (1.1%, a difference of 0.31%).
| Demographics | Rating | Rank | Disability Age Under 5 |
| Israelis | 98.7 /100 | #69 | Exceptional 1.1% |
| Immigrants from Ecuador | 98.6 /100 | #70 | Exceptional 1.1% |
| Trinidadians and Tobagonians | 98.6 /100 | #71 | Exceptional 1.1% |
| Burmese | 98.5 /100 | #72 | Exceptional 1.1% |
| Immigrants from Sri Lanka | 98.5 /100 | #73 | Exceptional 1.1% |
| Jordanians | 98.5 /100 | #74 | Exceptional 1.1% |
| Immigrants from Pakistan | 98.4 /100 | #75 | Exceptional 1.1% |
| Immigrants from Burma/Myanmar | 98.2 /100 | #76 | Exceptional 1.1% |
| Immigrants from Denmark | 98.1 /100 | #77 | Exceptional 1.1% |
| West Indians | 98.0 /100 | #78 | Exceptional 1.1% |
| Hmong | 98.0 /100 | #79 | Exceptional 1.1% |
| Immigrants from Trinidad and Tobago | 98.0 /100 | #80 | Exceptional 1.1% |
| Turks | 98.0 /100 | #81 | Exceptional 1.1% |
| Immigrants from Jordan | 97.9 /100 | #82 | Exceptional 1.1% |
| Immigrants from Syria | 97.9 /100 | #83 | Exceptional 1.1% |
Immigrants from Burma/Myanmar Disability Age Under 5 Correlation Summary
| Measurement | Immigrants from Burma/Myanmar Data | Disability Age Under 5 Data |
| Minimum | 0.039% | 0.18% |
| Maximum | 5.3% | 5.0% |
| Range | 5.3% | 4.8% |
| Mean | 1.9% | 1.4% |
| Median | 1.6% | 1.1% |
| Interquartile 25% (IQ1) | 0.84% | 0.85% |
| Interquartile 75% (IQ3) | 2.8% | 1.6% |
| Interquartile Range (IQR) | 2.0% | 0.72% |
| Standard Deviation (Sample) | 1.3% | 0.98% |
| Standard Deviation (Population) | 1.3% | 0.96% |
Correlation Details
| Immigrants from Burma/Myanmar Percentile | Sample Size | Disability Age Under 5 |
[ 0.0% - 0.5% ] 0.039% | 82,675,889 | 0.87% |
[ 0.0% - 0.5% ] 0.12% | 17,211,117 | 0.95% |
[ 0.0% - 0.5% ] 0.22% | 7,190,252 | 1.0% |
[ 0.0% - 0.5% ] 0.31% | 2,960,433 | 1.2% |
[ 0.0% - 0.5% ] 0.38% | 2,019,211 | 1.1% |
[ 0.0% - 0.5% ] 0.48% | 1,508,987 | 1.5% |
[ 0.5% - 1.0% ] 0.58% | 1,766,417 | 1.3% |
[ 0.5% - 1.0% ] 0.64% | 700,897 | 1.3% |
[ 0.5% - 1.0% ] 0.73% | 588,743 | 0.93% |
[ 0.5% - 1.0% ] 0.84% | 901,253 | 0.85% |
[ 0.5% - 1.0% ] 0.92% | 359,487 | 1.8% |
[ 1.0% - 1.5% ] 1.01% | 292,139 | 2.1% |
[ 1.0% - 1.5% ] 1.08% | 1,044,591 | 0.88% |
[ 1.0% - 1.5% ] 1.18% | 207,092 | 1.4% |
[ 1.0% - 1.5% ] 1.26% | 295,692 | 1.3% |
[ 1.0% - 1.5% ] 1.34% | 209,980 | 2.2% |
[ 1.0% - 1.5% ] 1.43% | 286,657 | 1.5% |
[ 1.5% - 2.0% ] 1.53% | 161,254 | 1.6% |
[ 1.5% - 2.0% ] 1.63% | 278,161 | 0.52% |
[ 1.5% - 2.0% ] 1.66% | 59,420 | 0.67% |
[ 1.5% - 2.0% ] 1.79% | 75,677 | 1.1% |
[ 1.5% - 2.0% ] 1.86% | 363,865 | 1.5% |
[ 2.0% - 2.5% ] 2.09% | 37,709 | 0.71% |
[ 2.0% - 2.5% ] 2.13% | 24,028 | 0.66% |
[ 2.0% - 2.5% ] 2.29% | 3,757 | 4.7% |
[ 2.0% - 2.5% ] 2.46% | 64,050 | 1.5% |
[ 2.5% - 3.0% ] 2.53% | 72,385 | 1.0% |
[ 2.5% - 3.0% ] 2.63% | 45,550 | 1.6% |
[ 2.5% - 3.0% ] 2.81% | 14,212 | 1.6% |
[ 3.0% - 3.5% ] 3.09% | 64,728 | 0.18% |
[ 3.0% - 3.5% ] 3.20% | 21,344 | 0.58% |
[ 3.0% - 3.5% ] 3.27% | 31,976 | 0.66% |
[ 3.0% - 3.5% ] 3.47% | 57,936 | 1.0% |
[ 3.5% - 4.0% ] 3.70% | 23,980 | 2.6% |
[ 3.5% - 4.0% ] 3.81% | 57,662 | 1.7% |
[ 4.0% - 4.5% ] 4.12% | 25,699 | 5.0% |
[ 4.0% - 4.5% ] 4.21% | 23,879 | 0.55% |
[ 5.0% - 5.5% ] 5.33% | 37,834 | 0.53% |