Immigrants from Barbados Disability Age Under 5

COMPARE

Immigrants from Barbados
Race
Ancestry
AfghanAfricanAlaska NativeAlaskan AthabascanAlbanianAleutAlsatianAmericanApacheArabArapahoArgentineanArmenianAssyrian/Chaldean/SyriacAustralianAustrianBahamianBangladeshiBarbadianBasqueBelgianBelizeanBermudanBhutaneseBlackfeetBolivianBrazilianBritishBritish West IndianBulgarianBurmeseCajunCambodianCanadianCape VerdeanCarpatho RusynCelticCentral AmericanCentral American IndianCherokeeCheyenneChickasawChileanChineseChippewaChoctawColombianColvilleComancheCosta RicanCreeCreekCroatianCrowCubanCypriotCzechCzechoslovakianDanishDelawareDominicanDutchDutch West IndianEastern EuropeanEcuadorianEgyptianEnglishEstonianEthiopianEuropeanFijianFilipinoFinnishFrenchFrench American IndianFrench CanadianGermanGerman RussianGhanaianGreekGuamanian/ChamorroGuatemalanGuyaneseHaitianHmongHonduranHopiHoumaHungarianIcelanderIndian (Asian)IndonesianInupiatIranianIraqiIrishIroquoisIsraeliItalianJamaicanJapaneseJordanianKenyanKiowaKoreanLaotianLatvianLebaneseLiberianLithuanianLumbeeLuxembourgerMacedonianMalaysianMalteseMarshalleseMenomineeMexicanMexican American IndianMongolianMoroccanNative HawaiianNavajoNepaleseNew ZealanderNicaraguanNigerianNorthern EuropeanNorwegianOkinawanOsageOttawaPaiutePakistaniPalestinianPanamanianParaguayanPennsylvania GermanPeruvianPimaPolishPortuguesePotawatomiPuebloPuerto RicanPuget Sound SalishRomanianRussianSalvadoranSamoanScandinavianScotch-IrishScottishSeminoleSenegaleseSerbianShoshoneSierra LeoneanSiouxSlavicSlovakSloveneSomaliSouth AfricanSouth AmericanSouth American IndianSoviet UnionSpaniardSpanishSpanish AmericanSpanish American IndianSri LankanSubsaharan AfricanSudaneseSwedishSwissSyrianTaiwaneseThaiTlingit-HaidaTohono O'OdhamTonganTrinidadian and TobagonianTsimshianTurkishU.S. Virgin IslanderUgandanUkrainianUruguayanUteVenezuelanVietnameseWelshWest IndianYakamaYaquiYugoslavianYumanYup'ikZimbabwean
Immigration
NonimmigrantsImmigrantsAfghanistanAfricaAlbaniaArgentinaArmeniaAsiaAustraliaAustriaBahamasBangladeshBarbadosBelarusBelgiumBelizeBoliviaBosnia and HerzegovinaBrazilBulgariaBurma/MyanmarCabo VerdeCambodiaCameroonCanadaCaribbeanCentral AmericaChileChinaColombiaCongoCosta RicaCroatiaCubaCzechoslovakiaDenmarkDominicaDominican RepublicEastern AfricaEastern AsiaEastern EuropeEcuadorEgyptEl SalvadorEnglandEritreaEthiopiaEuropeFijiFranceGermanyGhanaGreeceGrenadaGuatemalaGuyanaHaitiHondurasHong KongHungaryIndiaIndonesiaIranIraqIrelandIsraelItalyJamaicaJapanJordanKazakhstanKenyaKoreaKuwaitLaosLatin AmericaLatviaLebanonLiberiaLithuaniaMalaysiaMexicoMicronesiaMiddle AfricaMoldovaMoroccoNepalNetherlandsNicaraguaNigeriaNorth AmericaNorth MacedoniaNorthern AfricaNorthern EuropeNorwayOceaniaPakistanPanamaPeruPhilippinesPolandPortugalRomaniaRussiaSaudi ArabiaScotlandSenegalSerbiaSierra LeoneSingaporeSomaliaSouth AfricaSouth AmericaSouth Central AsiaSouth Eastern AsiaSouthern EuropeSpainSri LankaSt. Vincent and the GrenadinesSudanSwedenSwitzerlandSyriaTaiwanThailandTrinidad and TobagoTurkeyUgandaUkraineUruguayUzbekistanVenezuelaVietnamWest IndiesWestern AfricaWestern AsiaWestern EuropeYemenZaireZimbabweAzores
Select to Compare
Race
Ancestry
AfghanAfricanAlaska NativeAlaskan AthabascanAlbanianAleutAlsatianAmericanApacheArabArapahoArgentineanArmenianAssyrian/Chaldean/SyriacAustralianAustrianBahamianBangladeshiBarbadianBasqueBelgianBelizeanBermudanBhutaneseBlackfeetBolivianBrazilianBritishBritish West IndianBulgarianBurmeseCajunCambodianCanadianCape VerdeanCarpatho RusynCelticCentral AmericanCentral American IndianCherokeeCheyenneChickasawChileanChineseChippewaChoctawColombianColvilleComancheCosta RicanCreeCreekCroatianCrowCubanCypriotCzechCzechoslovakianDanishDelawareDominicanDutchDutch West IndianEastern EuropeanEcuadorianEgyptianEnglishEstonianEthiopianEuropeanFijianFilipinoFinnishFrenchFrench American IndianFrench CanadianGermanGerman RussianGhanaianGreekGuamanian/ChamorroGuatemalanGuyaneseHaitianHmongHonduranHopiHoumaHungarianIcelanderIndian (Asian)IndonesianInupiatIranianIraqiIrishIroquoisIsraeliItalianJamaicanJapaneseJordanianKenyanKiowaKoreanLaotianLatvianLebaneseLiberianLithuanianLumbeeLuxembourgerMacedonianMalaysianMalteseMarshalleseMenomineeMexicanMexican American IndianMongolianMoroccanNative HawaiianNavajoNepaleseNew ZealanderNicaraguanNigerianNorthern EuropeanNorwegianOkinawanOsageOttawaPaiutePakistaniPalestinianPanamanianParaguayanPennsylvania GermanPeruvianPimaPolishPortuguesePotawatomiPuebloPuerto RicanPuget Sound SalishRomanianRussianSalvadoranSamoanScandinavianScotch-IrishScottishSeminoleSenegaleseSerbianShoshoneSierra LeoneanSiouxSlavicSlovakSloveneSomaliSouth AfricanSouth AmericanSouth American IndianSoviet UnionSpaniardSpanishSpanish AmericanSpanish American IndianSri LankanSubsaharan AfricanSudaneseSwedishSwissSyrianTaiwaneseThaiTlingit-HaidaTohono O'OdhamTonganTrinidadian and TobagonianTsimshianTurkishU.S. Virgin IslanderUgandanUkrainianUruguayanUteVenezuelanVietnameseWelshWest IndianYakamaYaquiYugoslavianYumanYup'ikZimbabwean
Immigration
NonimmigrantsImmigrantsAfghanistanAfricaAlbaniaArgentinaArmeniaAsiaAustraliaAustriaBahamasBangladeshBelarusBelgiumBelizeBoliviaBosnia and HerzegovinaBrazilBulgariaBurma/MyanmarCabo VerdeCambodiaCameroonCanadaCaribbeanCentral AmericaChileChinaColombiaCongoCosta RicaCroatiaCubaCzechoslovakiaDenmarkDominicaDominican RepublicEastern AfricaEastern AsiaEastern EuropeEcuadorEgyptEl SalvadorEnglandEritreaEthiopiaEuropeFijiFranceGermanyGhanaGreeceGrenadaGuatemalaGuyanaHaitiHondurasHong KongHungaryIndiaIndonesiaIranIraqIrelandIsraelItalyJamaicaJapanJordanKazakhstanKenyaKoreaKuwaitLaosLatin AmericaLatviaLebanonLiberiaLithuaniaMalaysiaMexicoMicronesiaMiddle AfricaMoldovaMoroccoNepalNetherlandsNicaraguaNigeriaNorth AmericaNorth MacedoniaNorthern AfricaNorthern EuropeNorwayOceaniaPakistanPanamaPeruPhilippinesPolandPortugalRomaniaRussiaSaudi ArabiaScotlandSenegalSerbiaSierra LeoneSingaporeSomaliaSouth AfricaSouth AmericaSouth Central AsiaSouth Eastern AsiaSouthern EuropeSpainSri LankaSt. Vincent and the GrenadinesSudanSwedenSwitzerlandSyriaTaiwanThailandTrinidad and TobagoTurkeyUgandaUkraineUruguayUzbekistanVenezuelaVietnamWest IndiesWestern AfricaWestern AsiaWestern EuropeYemenZaireZimbabweAzores
Disability Age Under 5
Income
Poverty
Unemployment
Labor Participation
Family Structure
Vehicle Availability
Education Level
Disability

Immigrants from Barbados Disability Age Under 5
Exceptional

0.97%
DISABILITY | AGE UNDER 5
100.0/ 100
METRIC RATING
18th/ 347
METRIC RANK

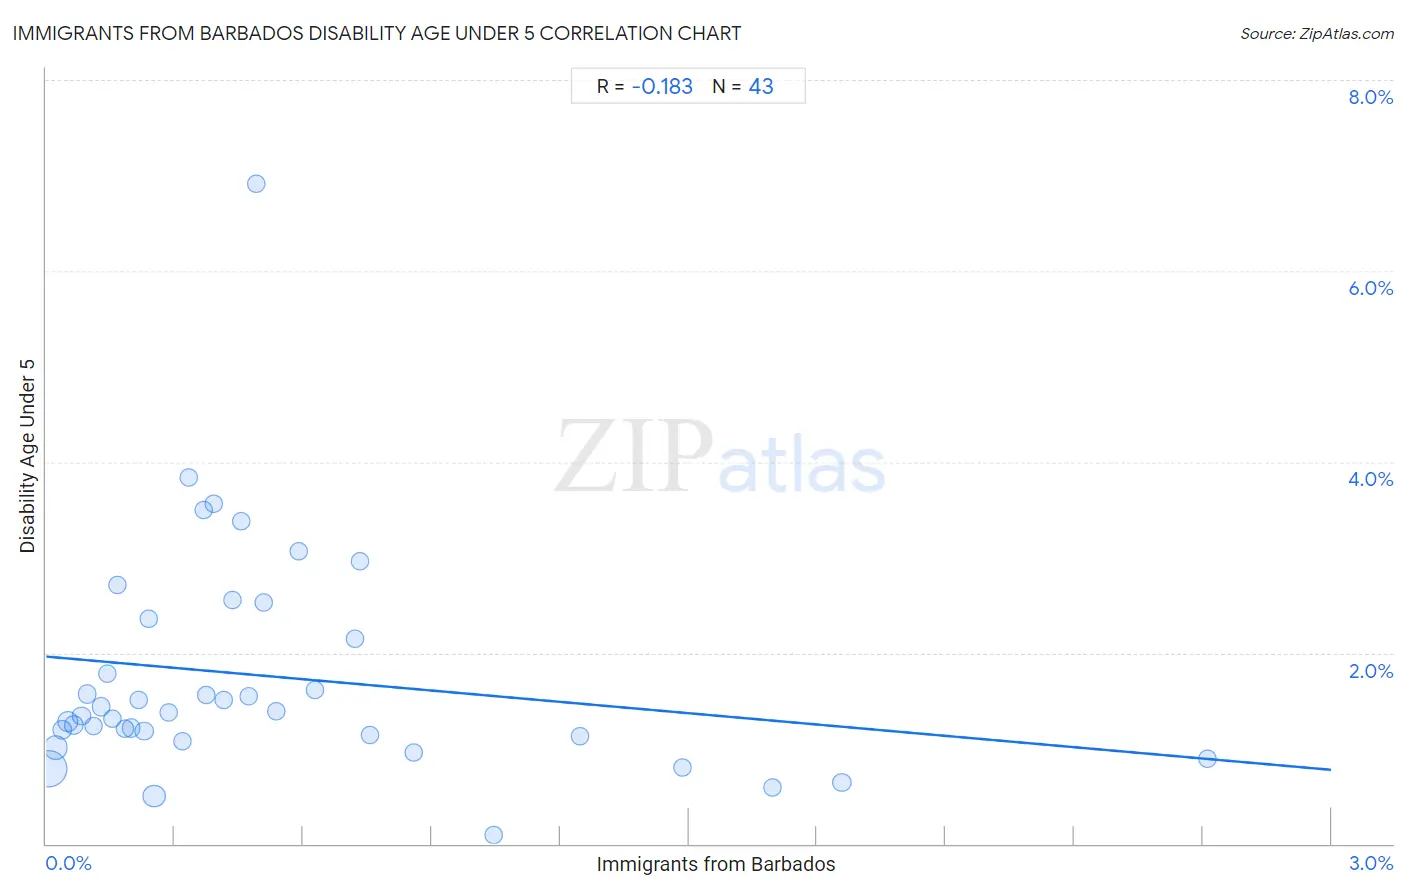
Immigrants from Barbados Disability Age Under 5 Correlation Chart

The statistical analysis conducted on geographies consisting of 80,516,356 people shows a poor negative correlation between the proportion of Immigrants from Barbados and percentage of population with a disability under the age of 5 in the United States with a correlation coefficient (R) of -0.183 and weighted average of 0.97%. On average, for every 1% (one percent) increase in Immigrants from Barbados within a typical geography, there is a decrease of 0.40% in percentage of population with a disability under the age of 5.
Immigrants from Barbados Disability Age Under 5
It is essential to understand that the correlation between the percentage of Immigrants from Barbados and percentage of population with a disability under the age of 5 does not imply a direct cause-and-effect relationship. It remains uncertain whether the presence of Immigrants from Barbados influences an upward or downward trend in the level of percentage of population with a disability under the age of 5 within an area, or if Immigrants from Barbados simply ended up residing in those areas with higher or lower levels of percentage of population with a disability under the age of 5 due to other factors.

Demographics Similar to Immigrants from Barbados by Disability Age Under 5

In terms of disability age under 5, the demographic groups most similar to Immigrants from Barbados are Puget Sound Salish (0.97%, a difference of 0.37%), Nepalese (0.97%, a difference of 0.47%), Immigrants from China (0.96%, a difference of 0.58%), Immigrants from Israel (0.96%, a difference of 1.0%), and Immigrants from Hong Kong (0.95%, a difference of 2.3%).
DemographicsRating | RankDisability Age Under 5
Afghans
100.0
/100
|
#11
Exceptional
0.94%
Immigrants from Grenada
100.0
/100
|
#12
Exceptional
0.94%
Soviet Union
100.0
/100
|
#13
Exceptional
0.95%
Yuman
100.0
/100
|
#14
Exceptional
0.95%
Immigrants from Hong Kong
100.0
/100
|
#15
Exceptional
0.95%
Immigrants from Israel
100.0
/100
|
#16
Exceptional
0.96%
Immigrants from China
100.0
/100
|
#17
Exceptional
0.96%
Immigrants from Barbados
100.0
/100
|
#18
Exceptional
0.97%
Puget Sound Salish
100.0
/100
|
#19
Exceptional
0.97%
Nepalese
100.0
/100
|
#20
Exceptional
0.97%
British West Indians
100.0
/100
|
#21
Exceptional
0.99%
Immigrants from Iran
100.0
/100
|
#22
Exceptional
1.00%
Yakama
100.0
/100
|
#23
Exceptional
1.00%
Indians (Asian)
100.0
/100
|
#24
Exceptional
1.0%
Immigrants from Micronesia
100.0
/100
|
#25
Exceptional
1.0%

Immigrants from Barbados Disability Age Under 5 Correlation Summary

MeasurementImmigrants from Barbados DataDisability Age Under 5 Data
Minimum0.0052%0.086%
Maximum2.7%6.9%
Range2.7%6.8%
Mean0.51%1.8%
Median0.37%1.4%
Interquartile 25% (IQ1)0.15%1.1%
Interquartile 75% (IQ3)0.63%2.4%
Interquartile Range (IQR)0.47%1.2%
Standard Deviation (Sample)0.56%1.2%
Standard Deviation (Population)0.55%1.2%

Correlation Details

Immigrants from Barbados PercentileSample SizeDisability Age Under 5
[
0.0%
-
0.5%
]
0.0052%
39,895,5740.78%
[
0.0%
-
0.5%
]
0.022%
12,760,5051.0%
[
0.0%
-
0.5%
]
0.037%
3,769,3611.2%
[
0.0%
-
0.5%
]
0.050%
4,073,4211.3%
[
0.0%
-
0.5%
]
0.065%
2,563,4571.2%
[
0.0%
-
0.5%
]
0.082%
1,438,4541.3%
[
0.0%
-
0.5%
]
0.095%
1,229,0381.6%
[
0.0%
-
0.5%
]
0.11%
770,4161.2%
[
0.0%
-
0.5%
]
0.13%
555,3901.4%
[
0.0%
-
0.5%
]
0.14%
577,9681.8%
[
0.0%
-
0.5%
]
0.15%
426,5491.3%
[
0.0%
-
0.5%
]
0.17%
315,6032.7%
[
0.0%
-
0.5%
]
0.18%
244,4551.2%
[
0.0%
-
0.5%
]
0.20%
352,8921.2%
[
0.0%
-
0.5%
]
0.21%
300,9061.5%
[
0.0%
-
0.5%
]
0.23%
712,0141.2%
[
0.0%
-
0.5%
]
0.24%
66,6182.4%
[
0.0%
-
0.5%
]
0.25%
8,745,9490.50%
[
0.0%
-
0.5%
]
0.29%
226,5991.4%
[
0.0%
-
0.5%
]
0.32%
90,8211.1%
[
0.0%
-
0.5%
]
0.33%
98,2463.8%
[
0.0%
-
0.5%
]
0.37%
10,6293.5%
[
0.0%
-
0.5%
]
0.37%
70,3651.6%
[
0.0%
-
0.5%
]
0.39%
27,8453.6%
[
0.0%
-
0.5%
]
0.41%
54,0761.5%
[
0.0%
-
0.5%
]
0.44%
39,4982.6%
[
0.0%
-
0.5%
]
0.46%
61,6323.4%
[
0.0%
-
0.5%
]
0.47%
135,0321.5%
[
0.0%
-
0.5%
]
0.49%
6,1326.9%
[
0.5%
-
1.0%
]
0.51%
101,2392.5%
[
0.5%
-
1.0%
]
0.54%
52,0901.4%
[
0.5%
-
1.0%
]
0.59%
1,8663.1%
[
0.5%
-
1.0%
]
0.63%
112,3761.6%
[
0.5%
-
1.0%
]
0.72%
82,3672.2%
[
0.5%
-
1.0%
]
0.73%
72,2733.0%
[
0.5%
-
1.0%
]
0.75%
1,5901.1%
[
0.5%
-
1.0%
]
0.86%
38,8650.95%
[
1.0%
-
1.5%
]
1.04%
89,9760.086%
[
1.0%
-
1.5%
]
1.25%
44,8321.1%
[
1.0%
-
1.5%
]
1.49%
62,3730.80%
[
1.5%
-
2.0%
]
1.69%
58,4760.59%
[
1.5%
-
2.0%
]
1.86%
100,0820.65%
[
2.5%
-
3.0%
]
2.71%
78,5060.89%