Immigrants from Taiwan Disability Age Under 5
COMPARE
Immigrants from Taiwan
Select to Compare
Disability Age Under 5
Immigrants from Taiwan Disability Age Under 5
1.0%
DISABILITY | AGE UNDER 5
100.0/ 100
METRIC RATING
26th/ 347
METRIC RANK
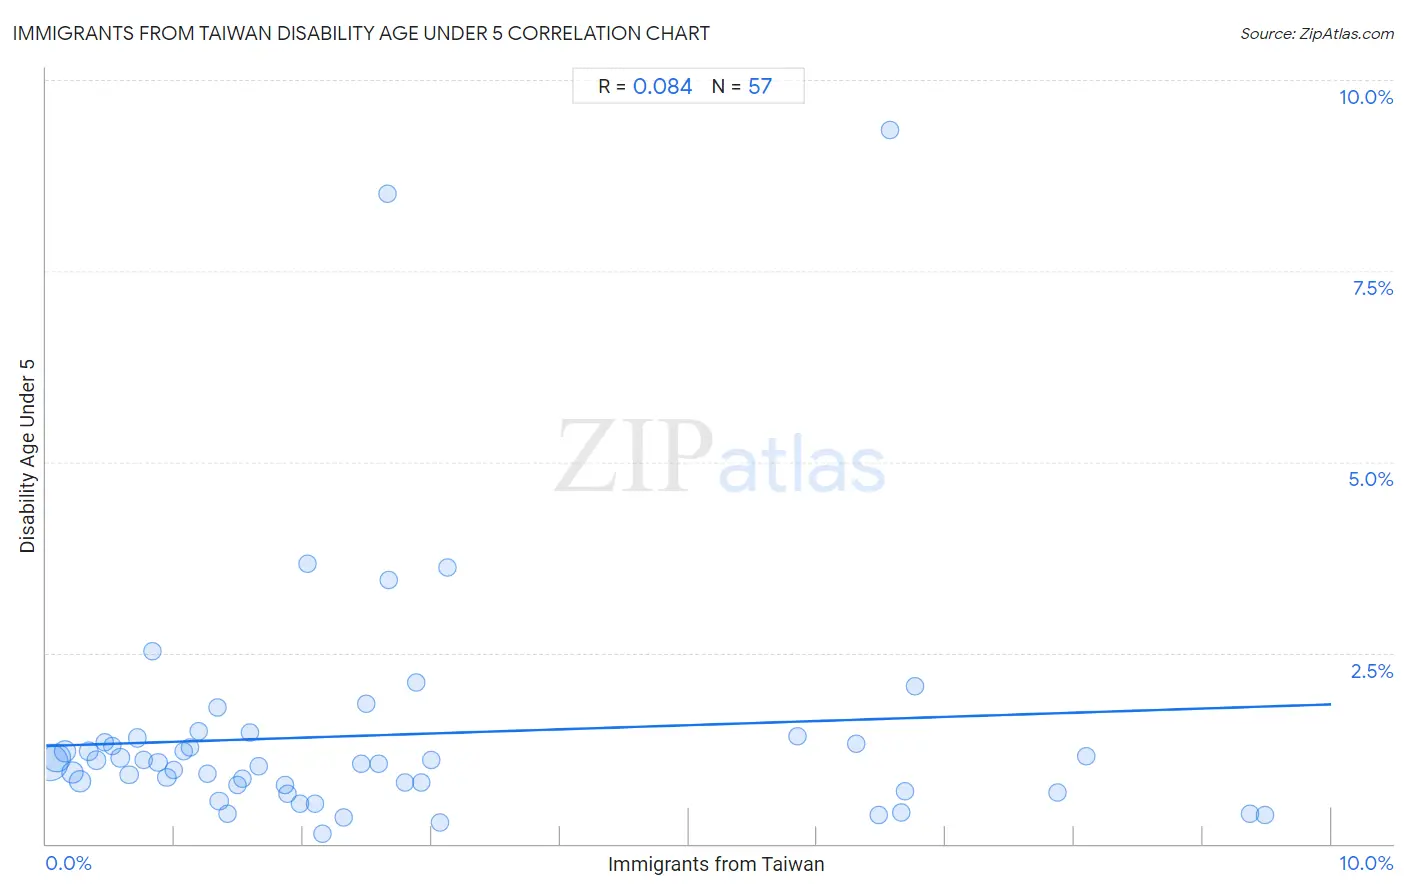
Immigrants from Taiwan Disability Age Under 5 Correlation Chart
The statistical analysis conducted on geographies consisting of 173,979,803 people shows a slight positive correlation between the proportion of Immigrants from Taiwan and percentage of population with a disability under the age of 5 in the United States with a correlation coefficient (R) of 0.084 and weighted average of 1.0%. On average, for every 1% (one percent) increase in Immigrants from Taiwan within a typical geography, there is an increase of 0.055% in percentage of population with a disability under the age of 5.
It is essential to understand that the correlation between the percentage of Immigrants from Taiwan and percentage of population with a disability under the age of 5 does not imply a direct cause-and-effect relationship. It remains uncertain whether the presence of Immigrants from Taiwan influences an upward or downward trend in the level of percentage of population with a disability under the age of 5 within an area, or if Immigrants from Taiwan simply ended up residing in those areas with higher or lower levels of percentage of population with a disability under the age of 5 due to other factors.
Demographics Similar to Immigrants from Taiwan by Disability Age Under 5
In terms of disability age under 5, the demographic groups most similar to Immigrants from Taiwan are Immigrants from Micronesia (1.0%, a difference of 0.12%), Indian (Asian) (1.0%, a difference of 0.43%), Yakama (1.00%, a difference of 0.72%), Immigrants from Iran (1.00%, a difference of 0.79%), and Guyanese (1.0%, a difference of 0.84%).
| Demographics | Rating | Rank | Disability Age Under 5 |
| Puget Sound Salish | 100.0 /100 | #19 | Exceptional 0.97% |
| Nepalese | 100.0 /100 | #20 | Exceptional 0.97% |
| British West Indians | 100.0 /100 | #21 | Exceptional 0.99% |
| Immigrants from Iran | 100.0 /100 | #22 | Exceptional 1.00% |
| Yakama | 100.0 /100 | #23 | Exceptional 1.00% |
| Indians (Asian) | 100.0 /100 | #24 | Exceptional 1.0% |
| Immigrants from Micronesia | 100.0 /100 | #25 | Exceptional 1.0% |
| Immigrants from Taiwan | 100.0 /100 | #26 | Exceptional 1.0% |
| Guyanese | 100.0 /100 | #27 | Exceptional 1.0% |
| Immigrants from Eastern Asia | 100.0 /100 | #28 | Exceptional 1.0% |
| Immigrants from Belarus | 100.0 /100 | #29 | Exceptional 1.0% |
| Immigrants from South Central Asia | 99.9 /100 | #30 | Exceptional 1.0% |
| Armenians | 99.9 /100 | #31 | Exceptional 1.0% |
| Iranians | 99.9 /100 | #32 | Exceptional 1.0% |
| Bolivians | 99.9 /100 | #33 | Exceptional 1.0% |
Immigrants from Taiwan Disability Age Under 5 Correlation Summary
| Measurement | Immigrants from Taiwan Data | Disability Age Under 5 Data |
| Minimum | 0.031% | 0.13% |
| Maximum | 9.5% | 9.4% |
| Range | 9.5% | 9.2% |
| Mean | 2.6% | 1.4% |
| Median | 1.9% | 1.1% |
| Interquartile 25% (IQ1) | 0.85% | 0.73% |
| Interquartile 75% (IQ3) | 3.0% | 1.4% |
| Interquartile Range (IQR) | 2.1% | 0.63% |
| Standard Deviation (Sample) | 2.5% | 1.6% |
| Standard Deviation (Population) | 2.5% | 1.6% |
Correlation Details
| Immigrants from Taiwan Percentile | Sample Size | Disability Age Under 5 |
[ 0.0% - 0.5% ] 0.031% | 71,077,135 | 1.1% |
[ 0.0% - 0.5% ] 0.081% | 34,329,942 | 1.1% |
[ 0.0% - 0.5% ] 0.15% | 13,954,569 | 1.2% |
[ 0.0% - 0.5% ] 0.20% | 14,548,251 | 0.93% |
[ 0.0% - 0.5% ] 0.26% | 14,109,552 | 0.82% |
[ 0.0% - 0.5% ] 0.33% | 4,865,233 | 1.2% |
[ 0.0% - 0.5% ] 0.39% | 3,405,536 | 1.1% |
[ 0.0% - 0.5% ] 0.46% | 1,725,376 | 1.3% |
[ 0.5% - 1.0% ] 0.51% | 1,588,173 | 1.3% |
[ 0.5% - 1.0% ] 0.58% | 2,589,910 | 1.1% |
[ 0.5% - 1.0% ] 0.65% | 1,917,364 | 0.90% |
[ 0.5% - 1.0% ] 0.71% | 1,389,751 | 1.4% |
[ 0.5% - 1.0% ] 0.76% | 680,382 | 1.1% |
[ 0.5% - 1.0% ] 0.82% | 313,377 | 2.5% |
[ 0.5% - 1.0% ] 0.87% | 509,772 | 1.1% |
[ 0.5% - 1.0% ] 0.94% | 442,445 | 0.86% |
[ 0.5% - 1.0% ] 1.00% | 294,756 | 0.96% |
[ 1.0% - 1.5% ] 1.07% | 421,108 | 1.2% |
[ 1.0% - 1.5% ] 1.12% | 252,526 | 1.3% |
[ 1.0% - 1.5% ] 1.18% | 436,562 | 1.5% |
[ 1.0% - 1.5% ] 1.25% | 350,310 | 0.92% |
[ 1.0% - 1.5% ] 1.33% | 10,616 | 1.8% |
[ 1.0% - 1.5% ] 1.35% | 1,257,120 | 0.55% |
[ 1.0% - 1.5% ] 1.41% | 61,539 | 0.39% |
[ 1.0% - 1.5% ] 1.49% | 261,111 | 0.77% |
[ 1.5% - 2.0% ] 1.53% | 343,696 | 0.84% |
[ 1.5% - 2.0% ] 1.59% | 64,180 | 1.5% |
[ 1.5% - 2.0% ] 1.66% | 156,668 | 1.0% |
[ 1.5% - 2.0% ] 1.86% | 176,076 | 0.77% |
[ 1.5% - 2.0% ] 1.88% | 79,393 | 0.65% |
[ 1.5% - 2.0% ] 1.97% | 385,274 | 0.52% |
[ 2.0% - 2.5% ] 2.04% | 28,770 | 3.7% |
[ 2.0% - 2.5% ] 2.09% | 182,703 | 0.53% |
[ 2.0% - 2.5% ] 2.15% | 95,141 | 0.13% |
[ 2.0% - 2.5% ] 2.32% | 390,605 | 0.35% |
[ 2.0% - 2.5% ] 2.45% | 60,499 | 1.0% |
[ 2.0% - 2.5% ] 2.49% | 38,124 | 1.8% |
[ 2.5% - 3.0% ] 2.58% | 82,295 | 1.0% |
[ 2.5% - 3.0% ] 2.66% | 48,431 | 8.5% |
[ 2.5% - 3.0% ] 2.67% | 14,281 | 3.5% |
[ 2.5% - 3.0% ] 2.79% | 139,881 | 0.81% |
[ 2.5% - 3.0% ] 2.88% | 38,003 | 2.1% |
[ 2.5% - 3.0% ] 2.91% | 53,320 | 0.80% |
[ 2.5% - 3.0% ] 2.99% | 33,937 | 1.1% |
[ 3.0% - 3.5% ] 3.07% | 244,703 | 0.28% |
[ 3.0% - 3.5% ] 3.13% | 29,080 | 3.6% |
[ 5.5% - 6.0% ] 5.85% | 35,556 | 1.4% |
[ 6.0% - 6.5% ] 6.31% | 36,165 | 1.3% |
[ 6.0% - 6.5% ] 6.47% | 61,414 | 0.38% |
[ 6.5% - 7.0% ] 6.57% | 4,463 | 9.4% |
[ 6.5% - 7.0% ] 6.65% | 59,763 | 0.40% |
[ 6.5% - 7.0% ] 6.69% | 110,950 | 0.69% |
[ 6.5% - 7.0% ] 6.76% | 33,367 | 2.1% |
[ 7.5% - 8.0% ] 7.87% | 41,377 | 0.67% |
[ 8.0% - 8.5% ] 8.09% | 28,212 | 1.1% |
[ 9.0% - 9.5% ] 9.37% | 43,851 | 0.39% |
[ 9.0% - 9.5% ] 9.48% | 47,209 | 0.37% |