Bulgarian Disability Age Under 5

COMPARE

Bulgarian
Race
Ancestry
AfghanAfricanAlaska NativeAlaskan AthabascanAlbanianAleutAlsatianAmericanApacheArabArapahoArgentineanArmenianAssyrian/Chaldean/SyriacAustralianAustrianBahamianBangladeshiBarbadianBasqueBelgianBelizeanBermudanBhutaneseBlackfeetBolivianBrazilianBritishBritish West IndianBulgarianBurmeseCajunCambodianCanadianCape VerdeanCarpatho RusynCelticCentral AmericanCentral American IndianCherokeeCheyenneChickasawChileanChineseChippewaChoctawColombianColvilleComancheCosta RicanCreeCreekCroatianCrowCubanCypriotCzechCzechoslovakianDanishDelawareDominicanDutchDutch West IndianEastern EuropeanEcuadorianEgyptianEnglishEstonianEthiopianEuropeanFijianFilipinoFinnishFrenchFrench American IndianFrench CanadianGermanGerman RussianGhanaianGreekGuamanian/ChamorroGuatemalanGuyaneseHaitianHmongHonduranHopiHoumaHungarianIcelanderIndian (Asian)IndonesianInupiatIranianIraqiIrishIroquoisIsraeliItalianJamaicanJapaneseJordanianKenyanKiowaKoreanLaotianLatvianLebaneseLiberianLithuanianLumbeeLuxembourgerMacedonianMalaysianMalteseMarshalleseMenomineeMexicanMexican American IndianMongolianMoroccanNative HawaiianNavajoNepaleseNew ZealanderNicaraguanNigerianNorthern EuropeanNorwegianOkinawanOsageOttawaPaiutePakistaniPalestinianPanamanianParaguayanPennsylvania GermanPeruvianPimaPolishPortuguesePotawatomiPuebloPuerto RicanPuget Sound SalishRomanianRussianSalvadoranSamoanScandinavianScotch-IrishScottishSeminoleSenegaleseSerbianShoshoneSierra LeoneanSiouxSlavicSlovakSloveneSomaliSouth AfricanSouth AmericanSouth American IndianSoviet UnionSpaniardSpanishSpanish AmericanSpanish American IndianSri LankanSubsaharan AfricanSudaneseSwedishSwissSyrianTaiwaneseThaiTlingit-HaidaTohono O'OdhamTonganTrinidadian and TobagonianTsimshianTurkishU.S. Virgin IslanderUgandanUkrainianUruguayanUteVenezuelanVietnameseWelshWest IndianYakamaYaquiYugoslavianYumanYup'ikZimbabwean
Immigration
NonimmigrantsImmigrantsAfghanistanAfricaAlbaniaArgentinaArmeniaAsiaAustraliaAustriaBahamasBangladeshBarbadosBelarusBelgiumBelizeBoliviaBosnia and HerzegovinaBrazilBulgariaBurma/MyanmarCabo VerdeCambodiaCameroonCanadaCaribbeanCentral AmericaChileChinaColombiaCongoCosta RicaCroatiaCubaCzechoslovakiaDenmarkDominicaDominican RepublicEastern AfricaEastern AsiaEastern EuropeEcuadorEgyptEl SalvadorEnglandEritreaEthiopiaEuropeFijiFranceGermanyGhanaGreeceGrenadaGuatemalaGuyanaHaitiHondurasHong KongHungaryIndiaIndonesiaIranIraqIrelandIsraelItalyJamaicaJapanJordanKazakhstanKenyaKoreaKuwaitLaosLatin AmericaLatviaLebanonLiberiaLithuaniaMalaysiaMexicoMicronesiaMiddle AfricaMoldovaMoroccoNepalNetherlandsNicaraguaNigeriaNorth AmericaNorth MacedoniaNorthern AfricaNorthern EuropeNorwayOceaniaPakistanPanamaPeruPhilippinesPolandPortugalRomaniaRussiaSaudi ArabiaScotlandSenegalSerbiaSierra LeoneSingaporeSomaliaSouth AfricaSouth AmericaSouth Central AsiaSouth Eastern AsiaSouthern EuropeSpainSri LankaSt. Vincent and the GrenadinesSudanSwedenSwitzerlandSyriaTaiwanThailandTrinidad and TobagoTurkeyUgandaUkraineUruguayUzbekistanVenezuelaVietnamWest IndiesWestern AfricaWestern AsiaWestern EuropeYemenZaireZimbabweAzores
Select to Compare
Race
Ancestry
AfghanAfricanAlaska NativeAlaskan AthabascanAlbanianAleutAlsatianAmericanApacheArabArapahoArgentineanArmenianAssyrian/Chaldean/SyriacAustralianAustrianBahamianBangladeshiBarbadianBasqueBelgianBelizeanBermudanBhutaneseBlackfeetBolivianBrazilianBritishBritish West IndianBurmeseCajunCambodianCanadianCape VerdeanCarpatho RusynCelticCentral AmericanCentral American IndianCherokeeCheyenneChickasawChileanChineseChippewaChoctawColombianColvilleComancheCosta RicanCreeCreekCroatianCrowCubanCypriotCzechCzechoslovakianDanishDelawareDominicanDutchDutch West IndianEastern EuropeanEcuadorianEgyptianEnglishEstonianEthiopianEuropeanFijianFilipinoFinnishFrenchFrench American IndianFrench CanadianGermanGerman RussianGhanaianGreekGuamanian/ChamorroGuatemalanGuyaneseHaitianHmongHonduranHopiHoumaHungarianIcelanderIndian (Asian)IndonesianInupiatIranianIraqiIrishIroquoisIsraeliItalianJamaicanJapaneseJordanianKenyanKiowaKoreanLaotianLatvianLebaneseLiberianLithuanianLumbeeLuxembourgerMacedonianMalaysianMalteseMarshalleseMenomineeMexicanMexican American IndianMongolianMoroccanNative HawaiianNavajoNepaleseNew ZealanderNicaraguanNigerianNorthern EuropeanNorwegianOkinawanOsageOttawaPaiutePakistaniPalestinianPanamanianParaguayanPennsylvania GermanPeruvianPimaPolishPortuguesePotawatomiPuebloPuerto RicanPuget Sound SalishRomanianRussianSalvadoranSamoanScandinavianScotch-IrishScottishSeminoleSenegaleseSerbianShoshoneSierra LeoneanSiouxSlavicSlovakSloveneSomaliSouth AfricanSouth AmericanSouth American IndianSoviet UnionSpaniardSpanishSpanish AmericanSpanish American IndianSri LankanSubsaharan AfricanSudaneseSwedishSwissSyrianTaiwaneseThaiTlingit-HaidaTohono O'OdhamTonganTrinidadian and TobagonianTsimshianTurkishU.S. Virgin IslanderUgandanUkrainianUruguayanUteVenezuelanVietnameseWelshWest IndianYakamaYaquiYugoslavianYumanYup'ikZimbabwean
Immigration
NonimmigrantsImmigrantsAfghanistanAfricaAlbaniaArgentinaArmeniaAsiaAustraliaAustriaBahamasBangladeshBarbadosBelarusBelgiumBelizeBoliviaBosnia and HerzegovinaBrazilBulgariaBurma/MyanmarCabo VerdeCambodiaCameroonCanadaCaribbeanCentral AmericaChileChinaColombiaCongoCosta RicaCroatiaCubaCzechoslovakiaDenmarkDominicaDominican RepublicEastern AfricaEastern AsiaEastern EuropeEcuadorEgyptEl SalvadorEnglandEritreaEthiopiaEuropeFijiFranceGermanyGhanaGreeceGrenadaGuatemalaGuyanaHaitiHondurasHong KongHungaryIndiaIndonesiaIranIraqIrelandIsraelItalyJamaicaJapanJordanKazakhstanKenyaKoreaKuwaitLaosLatin AmericaLatviaLebanonLiberiaLithuaniaMalaysiaMexicoMicronesiaMiddle AfricaMoldovaMoroccoNepalNetherlandsNicaraguaNigeriaNorth AmericaNorth MacedoniaNorthern AfricaNorthern EuropeNorwayOceaniaPakistanPanamaPeruPhilippinesPolandPortugalRomaniaRussiaSaudi ArabiaScotlandSenegalSerbiaSierra LeoneSingaporeSomaliaSouth AfricaSouth AmericaSouth Central AsiaSouth Eastern AsiaSouthern EuropeSpainSri LankaSt. Vincent and the GrenadinesSudanSwedenSwitzerlandSyriaTaiwanThailandTrinidad and TobagoTurkeyUgandaUkraineUruguayUzbekistanVenezuelaVietnamWest IndiesWestern AfricaWestern AsiaWestern EuropeYemenZaireZimbabweAzores
Disability Age Under 5
Income
Poverty
Unemployment
Labor Participation
Family Structure
Vehicle Availability
Education Level
Disability

Bulgarian Disability Age Under 5
Poor

1.3%
DISABILITY | AGE UNDER 5
19.5/ 100
METRIC RATING
209th/ 347
METRIC RANK

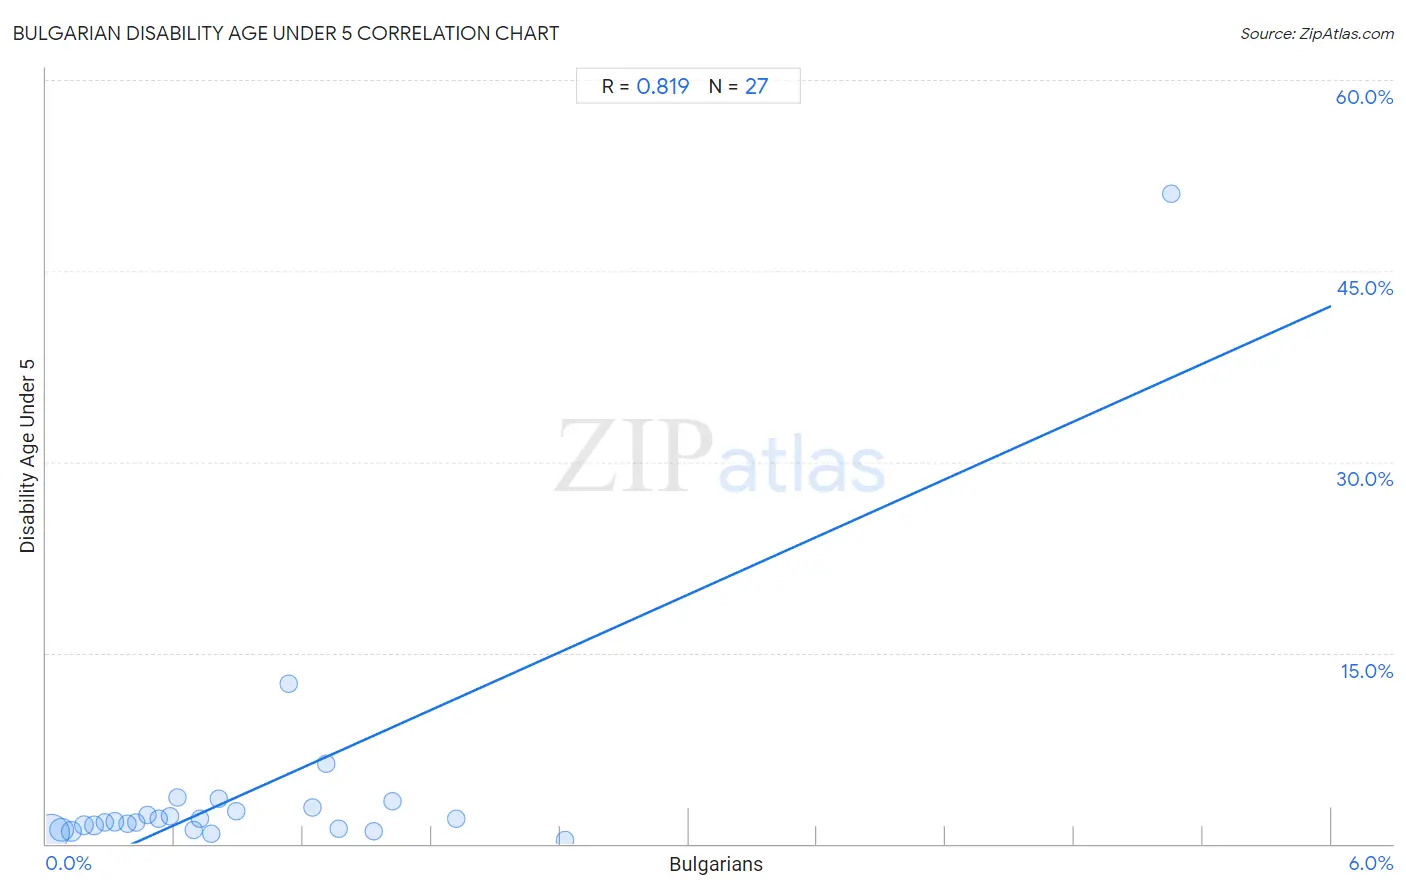
Bulgarian Disability Age Under 5 Correlation Chart

The statistical analysis conducted on geographies consisting of 131,414,932 people shows a very strong positive correlation between the proportion of Bulgarians and percentage of population with a disability under the age of 5 in the United States with a correlation coefficient (R) of 0.819 and weighted average of 1.3%. On average, for every 1% (one percent) increase in Bulgarians within a typical geography, there is an increase of 7.6% in percentage of population with a disability under the age of 5.
Bulgarian Disability Age Under 5
It is essential to understand that the correlation between the percentage of Bulgarians and percentage of population with a disability under the age of 5 does not imply a direct cause-and-effect relationship. It remains uncertain whether the presence of Bulgarians influences an upward or downward trend in the level of percentage of population with a disability under the age of 5 within an area, or if Bulgarians simply ended up residing in those areas with higher or lower levels of percentage of population with a disability under the age of 5 due to other factors.

Demographics Similar to Bulgarians by Disability Age Under 5

In terms of disability age under 5, the demographic groups most similar to Bulgarians are Pakistani (1.3%, a difference of 0.010%), Immigrants from Greece (1.3%, a difference of 0.050%), Chilean (1.3%, a difference of 0.090%), Immigrants from Sudan (1.3%, a difference of 0.11%), and Mexican (1.3%, a difference of 0.18%).
DemographicsRating | RankDisability Age Under 5
Arapaho
24.1
/100
|
#202
Fair
1.3%
Liberians
24.0
/100
|
#203
Fair
1.3%
Immigrants from Europe
23.6
/100
|
#204
Fair
1.3%
Romanians
22.5
/100
|
#205
Fair
1.3%
Immigrants from Poland
22.4
/100
|
#206
Fair
1.3%
Nigerians
21.2
/100
|
#207
Fair
1.3%
Mexicans
20.8
/100
|
#208
Fair
1.3%
Bulgarians
19.5
/100
|
#209
Poor
1.3%
Pakistanis
19.4
/100
|
#210
Poor
1.3%
Immigrants from Greece
19.1
/100
|
#211
Poor
1.3%
Chileans
18.8
/100
|
#212
Poor
1.3%
Immigrants from Sudan
18.7
/100
|
#213
Poor
1.3%
Immigrants from Chile
17.2
/100
|
#214
Poor
1.3%
Syrians
16.1
/100
|
#215
Poor
1.3%
Bangladeshis
15.5
/100
|
#216
Poor
1.3%

Bulgarian Disability Age Under 5 Correlation Summary

MeasurementBulgarian DataDisability Age Under 5 Data
Minimum0.025%0.31%
Maximum5.3%51.1%
Range5.2%50.8%
Mean0.96%4.2%
Median0.69%1.7%
Interquartile 25% (IQ1)0.32%1.1%
Interquartile 75% (IQ3)1.3%2.8%
Interquartile Range (IQR)0.99%1.7%
Standard Deviation (Sample)1.0%9.7%
Standard Deviation (Population)1.0%9.5%

Correlation Details

Bulgarian PercentileSample SizeDisability Age Under 5
[
0.0%
-
0.5%
]
0.025%
85,605,8140.87%
[
0.0%
-
0.5%
]
0.072%
24,712,1291.1%
[
0.0%
-
0.5%
]
0.12%
10,386,3280.94%
[
0.0%
-
0.5%
]
0.17%
3,466,8991.5%
[
0.0%
-
0.5%
]
0.22%
2,573,5801.4%
[
0.0%
-
0.5%
]
0.27%
1,212,1891.7%
[
0.0%
-
0.5%
]
0.32%
1,409,2191.7%
[
0.0%
-
0.5%
]
0.38%
366,6561.5%
[
0.0%
-
0.5%
]
0.42%
407,9571.7%
[
0.0%
-
0.5%
]
0.47%
269,0442.3%
[
0.5%
-
1.0%
]
0.53%
151,1911.9%
[
0.5%
-
1.0%
]
0.58%
179,4262.2%
[
0.5%
-
1.0%
]
0.62%
109,2663.6%
[
0.5%
-
1.0%
]
0.69%
142,3511.1%
[
0.5%
-
1.0%
]
0.72%
116,9522.0%
[
0.5%
-
1.0%
]
0.77%
25,9570.75%
[
0.5%
-
1.0%
]
0.81%
15,9883.5%
[
0.5%
-
1.0%
]
0.89%
109,9072.6%
[
1.0%
-
1.5%
]
1.13%
4,93712.6%
[
1.0%
-
1.5%
]
1.24%
4,3382.8%
[
1.0%
-
1.5%
]
1.31%
6,4906.2%
[
1.0%
-
1.5%
]
1.37%
8,8411.2%
[
1.5%
-
2.0%
]
1.53%
78,3781.0%
[
1.5%
-
2.0%
]
1.62%
10,2693.3%
[
1.5%
-
2.0%
]
1.92%
10,3352.0%
[
2.0%
-
2.5%
]
2.42%
29,2160.31%
[
5.0%
-
5.5%
]
5.25%
1,27551.1%