Immigrants from Dominican Republic Disability Age Under 5
COMPARE
Immigrants from Dominican Republic
Select to Compare
Disability Age Under 5
Immigrants from Dominican Republic Disability Age Under 5
1.1%
DISABILITY | AGE UNDER 5
97.5/ 100
METRIC RATING
88th/ 347
METRIC RANK
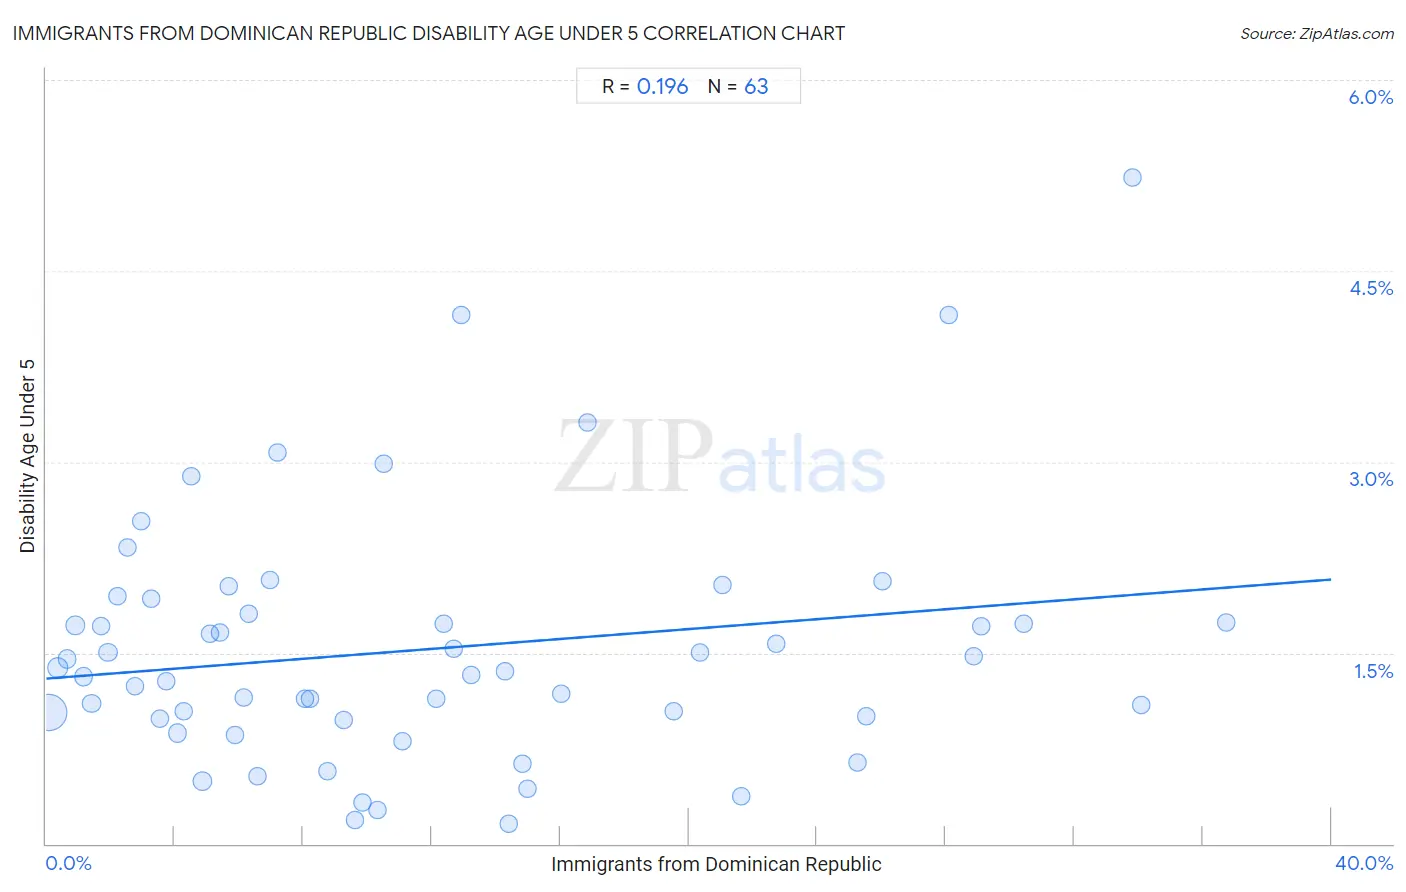
Immigrants from Dominican Republic Disability Age Under 5 Correlation Chart
The statistical analysis conducted on geographies consisting of 160,628,361 people shows a poor positive correlation between the proportion of Immigrants from Dominican Republic and percentage of population with a disability under the age of 5 in the United States with a correlation coefficient (R) of 0.196 and weighted average of 1.1%. On average, for every 1% (one percent) increase in Immigrants from Dominican Republic within a typical geography, there is an increase of 0.019% in percentage of population with a disability under the age of 5.
It is essential to understand that the correlation between the percentage of Immigrants from Dominican Republic and percentage of population with a disability under the age of 5 does not imply a direct cause-and-effect relationship. It remains uncertain whether the presence of Immigrants from Dominican Republic influences an upward or downward trend in the level of percentage of population with a disability under the age of 5 within an area, or if Immigrants from Dominican Republic simply ended up residing in those areas with higher or lower levels of percentage of population with a disability under the age of 5 due to other factors.
Demographics Similar to Immigrants from Dominican Republic by Disability Age Under 5
In terms of disability age under 5, the demographic groups most similar to Immigrants from Dominican Republic are Ugandan (1.1%, a difference of 0.020%), Okinawan (1.1%, a difference of 0.040%), Sudanese (1.1%, a difference of 0.17%), Immigrants from Zaire (1.1%, a difference of 0.25%), and Ethiopian (1.1%, a difference of 0.28%).
| Demographics | Rating | Rank | Disability Age Under 5 |
| Turks | 98.0 /100 | #81 | Exceptional 1.1% |
| Immigrants from Jordan | 97.9 /100 | #82 | Exceptional 1.1% |
| Immigrants from Syria | 97.9 /100 | #83 | Exceptional 1.1% |
| Immigrants from Zaire | 97.8 /100 | #84 | Exceptional 1.1% |
| Sudanese | 97.7 /100 | #85 | Exceptional 1.1% |
| Okinawans | 97.6 /100 | #86 | Exceptional 1.1% |
| Ugandans | 97.5 /100 | #87 | Exceptional 1.1% |
| Immigrants from Dominican Republic | 97.5 /100 | #88 | Exceptional 1.1% |
| Ethiopians | 97.2 /100 | #89 | Exceptional 1.1% |
| Chinese | 97.2 /100 | #90 | Exceptional 1.1% |
| Albanians | 97.2 /100 | #91 | Exceptional 1.1% |
| Immigrants from Cuba | 97.0 /100 | #92 | Exceptional 1.1% |
| Spanish Americans | 96.9 /100 | #93 | Exceptional 1.1% |
| Sri Lankans | 96.8 /100 | #94 | Exceptional 1.1% |
| Immigrants from Moldova | 96.8 /100 | #95 | Exceptional 1.1% |
Immigrants from Dominican Republic Disability Age Under 5 Correlation Summary
| Measurement | Immigrants from Dominican Republic Data | Disability Age Under 5 Data |
| Minimum | 0.065% | 0.15% |
| Maximum | 36.7% | 5.2% |
| Range | 36.7% | 5.1% |
| Mean | 11.8% | 1.5% |
| Median | 9.3% | 1.4% |
| Interquartile 25% (IQ1) | 4.1% | 0.99% |
| Interquartile 75% (IQ3) | 16.9% | 1.8% |
| Interquartile Range (IQR) | 12.8% | 0.82% |
| Standard Deviation (Sample) | 9.8% | 0.97% |
| Standard Deviation (Population) | 9.7% | 0.97% |
Correlation Details
| Immigrants from Dominican Republic Percentile | Sample Size | Disability Age Under 5 |
[ 0.0% - 0.5% ] 0.065% | 113,080,219 | 1.0% |
[ 0.0% - 0.5% ] 0.36% | 12,453,125 | 1.4% |
[ 0.5% - 1.0% ] 0.64% | 4,993,370 | 1.5% |
[ 0.5% - 1.0% ] 0.91% | 3,474,432 | 1.7% |
[ 1.0% - 1.5% ] 1.17% | 2,598,649 | 1.3% |
[ 1.0% - 1.5% ] 1.42% | 3,511,459 | 1.1% |
[ 1.5% - 2.0% ] 1.70% | 1,868,700 | 1.7% |
[ 1.5% - 2.0% ] 1.92% | 1,217,291 | 1.5% |
[ 2.0% - 2.5% ] 2.20% | 666,792 | 1.9% |
[ 2.5% - 3.0% ] 2.52% | 501,942 | 2.3% |
[ 2.5% - 3.0% ] 2.77% | 597,078 | 1.2% |
[ 2.5% - 3.0% ] 2.95% | 409,009 | 2.5% |
[ 3.0% - 3.5% ] 3.27% | 573,189 | 1.9% |
[ 3.5% - 4.0% ] 3.53% | 1,180,178 | 0.99% |
[ 3.5% - 4.0% ] 3.73% | 71,360 | 1.3% |
[ 4.0% - 4.5% ] 4.08% | 527,627 | 0.87% |
[ 4.0% - 4.5% ] 4.29% | 156,925 | 1.0% |
[ 4.5% - 5.0% ] 4.51% | 15,132 | 2.9% |
[ 4.5% - 5.0% ] 4.85% | 8,650,261 | 0.49% |
[ 5.0% - 5.5% ] 5.08% | 113,117 | 1.6% |
[ 5.0% - 5.5% ] 5.41% | 154,324 | 1.7% |
[ 5.5% - 6.0% ] 5.67% | 88,976 | 2.0% |
[ 5.5% - 6.0% ] 5.87% | 86,209 | 0.85% |
[ 6.0% - 6.5% ] 6.17% | 126,482 | 1.1% |
[ 6.0% - 6.5% ] 6.30% | 91,516 | 1.8% |
[ 6.5% - 7.0% ] 6.59% | 92,467 | 0.53% |
[ 6.5% - 7.0% ] 6.96% | 101,142 | 2.1% |
[ 7.0% - 7.5% ] 7.20% | 47,277 | 3.1% |
[ 8.0% - 8.5% ] 8.06% | 56,870 | 1.1% |
[ 8.0% - 8.5% ] 8.22% | 55,718 | 1.1% |
[ 8.5% - 9.0% ] 8.77% | 462,678 | 0.57% |
[ 9.0% - 9.5% ] 9.27% | 41,907 | 0.97% |
[ 9.5% - 10.0% ] 9.62% | 94,601 | 0.19% |
[ 9.5% - 10.0% ] 9.83% | 151,614 | 0.33% |
[ 10.0% - 10.5% ] 10.31% | 100,653 | 0.26% |
[ 10.5% - 11.0% ] 10.52% | 10,923 | 3.0% |
[ 11.0% - 11.5% ] 11.07% | 218,026 | 0.80% |
[ 12.0% - 12.5% ] 12.13% | 63,076 | 1.1% |
[ 12.0% - 12.5% ] 12.39% | 19,625 | 1.7% |
[ 12.5% - 13.0% ] 12.67% | 10,396 | 1.5% |
[ 12.5% - 13.0% ] 12.90% | 97,787 | 4.2% |
[ 13.0% - 13.5% ] 13.23% | 318,248 | 1.3% |
[ 14.0% - 14.5% ] 14.27% | 88,575 | 1.4% |
[ 14.0% - 14.5% ] 14.40% | 51,640 | 0.15% |
[ 14.5% - 15.0% ] 14.83% | 61,238 | 0.63% |
[ 14.5% - 15.0% ] 14.97% | 51,964 | 0.43% |
[ 16.0% - 16.5% ] 16.03% | 140,096 | 1.2% |
[ 16.5% - 17.0% ] 16.86% | 59,852 | 3.3% |
[ 19.5% - 20.0% ] 19.53% | 237,681 | 1.0% |
[ 20.0% - 20.5% ] 20.35% | 25,674 | 1.5% |
[ 21.0% - 21.5% ] 21.07% | 78,624 | 2.0% |
[ 21.5% - 22.0% ] 21.62% | 82,678 | 0.38% |
[ 22.5% - 23.0% ] 22.73% | 13,781 | 1.6% |
[ 25.0% - 25.5% ] 25.27% | 35,492 | 0.64% |
[ 25.5% - 26.0% ] 25.54% | 80,385 | 1.0% |
[ 26.0% - 26.5% ] 26.03% | 41,570 | 2.1% |
[ 28.0% - 28.5% ] 28.11% | 60,480 | 4.2% |
[ 28.5% - 29.0% ] 28.85% | 81,397 | 1.5% |
[ 29.0% - 29.5% ] 29.09% | 58,136 | 1.7% |
[ 30.0% - 30.5% ] 30.42% | 55,226 | 1.7% |
[ 33.5% - 34.0% ] 33.83% | 32,697 | 5.2% |
[ 34.0% - 34.5% ] 34.08% | 88,067 | 1.1% |
[ 36.5% - 37.0% ] 36.74% | 52,738 | 1.7% |