Sudanese Disability Age Under 5

COMPARE

Sudanese
Race
Ancestry
AfghanAfricanAlaska NativeAlaskan AthabascanAlbanianAleutAlsatianAmericanApacheArabArapahoArgentineanArmenianAssyrian/Chaldean/SyriacAustralianAustrianBahamianBangladeshiBarbadianBasqueBelgianBelizeanBermudanBhutaneseBlackfeetBolivianBrazilianBritishBritish West IndianBulgarianBurmeseCajunCambodianCanadianCape VerdeanCarpatho RusynCelticCentral AmericanCentral American IndianCherokeeCheyenneChickasawChileanChineseChippewaChoctawColombianColvilleComancheCosta RicanCreeCreekCroatianCrowCubanCypriotCzechCzechoslovakianDanishDelawareDominicanDutchDutch West IndianEastern EuropeanEcuadorianEgyptianEnglishEstonianEthiopianEuropeanFijianFilipinoFinnishFrenchFrench American IndianFrench CanadianGermanGerman RussianGhanaianGreekGuamanian/ChamorroGuatemalanGuyaneseHaitianHmongHonduranHopiHoumaHungarianIcelanderIndian (Asian)IndonesianInupiatIranianIraqiIrishIroquoisIsraeliItalianJamaicanJapaneseJordanianKenyanKiowaKoreanLaotianLatvianLebaneseLiberianLithuanianLumbeeLuxembourgerMacedonianMalaysianMalteseMarshalleseMenomineeMexicanMexican American IndianMongolianMoroccanNative HawaiianNavajoNepaleseNew ZealanderNicaraguanNigerianNorthern EuropeanNorwegianOkinawanOsageOttawaPaiutePakistaniPalestinianPanamanianParaguayanPennsylvania GermanPeruvianPimaPolishPortuguesePotawatomiPuebloPuerto RicanPuget Sound SalishRomanianRussianSalvadoranSamoanScandinavianScotch-IrishScottishSeminoleSenegaleseSerbianShoshoneSierra LeoneanSiouxSlavicSlovakSloveneSomaliSouth AfricanSouth AmericanSouth American IndianSoviet UnionSpaniardSpanishSpanish AmericanSpanish American IndianSri LankanSubsaharan AfricanSudaneseSwedishSwissSyrianTaiwaneseThaiTlingit-HaidaTohono O'OdhamTonganTrinidadian and TobagonianTsimshianTurkishU.S. Virgin IslanderUgandanUkrainianUruguayanUteVenezuelanVietnameseWelshWest IndianYakamaYaquiYugoslavianYumanYup'ikZimbabwean
Immigration
NonimmigrantsImmigrantsAfghanistanAfricaAlbaniaArgentinaArmeniaAsiaAustraliaAustriaBahamasBangladeshBarbadosBelarusBelgiumBelizeBoliviaBosnia and HerzegovinaBrazilBulgariaBurma/MyanmarCabo VerdeCambodiaCameroonCanadaCaribbeanCentral AmericaChileChinaColombiaCongoCosta RicaCroatiaCubaCzechoslovakiaDenmarkDominicaDominican RepublicEastern AfricaEastern AsiaEastern EuropeEcuadorEgyptEl SalvadorEnglandEritreaEthiopiaEuropeFijiFranceGermanyGhanaGreeceGrenadaGuatemalaGuyanaHaitiHondurasHong KongHungaryIndiaIndonesiaIranIraqIrelandIsraelItalyJamaicaJapanJordanKazakhstanKenyaKoreaKuwaitLaosLatin AmericaLatviaLebanonLiberiaLithuaniaMalaysiaMexicoMicronesiaMiddle AfricaMoldovaMoroccoNepalNetherlandsNicaraguaNigeriaNorth AmericaNorth MacedoniaNorthern AfricaNorthern EuropeNorwayOceaniaPakistanPanamaPeruPhilippinesPolandPortugalRomaniaRussiaSaudi ArabiaScotlandSenegalSerbiaSierra LeoneSingaporeSomaliaSouth AfricaSouth AmericaSouth Central AsiaSouth Eastern AsiaSouthern EuropeSpainSri LankaSt. Vincent and the GrenadinesSudanSwedenSwitzerlandSyriaTaiwanThailandTrinidad and TobagoTurkeyUgandaUkraineUruguayUzbekistanVenezuelaVietnamWest IndiesWestern AfricaWestern AsiaWestern EuropeYemenZaireZimbabweAzores
Select to Compare
Race
Ancestry
AfghanAfricanAlaska NativeAlaskan AthabascanAlbanianAleutAlsatianAmericanApacheArabArapahoArgentineanArmenianAssyrian/Chaldean/SyriacAustralianAustrianBahamianBangladeshiBarbadianBasqueBelgianBelizeanBermudanBhutaneseBlackfeetBolivianBrazilianBritishBritish West IndianBulgarianBurmeseCajunCambodianCanadianCape VerdeanCarpatho RusynCelticCentral AmericanCentral American IndianCherokeeCheyenneChickasawChileanChineseChippewaChoctawColombianColvilleComancheCosta RicanCreeCreekCroatianCrowCubanCypriotCzechCzechoslovakianDanishDelawareDominicanDutchDutch West IndianEastern EuropeanEcuadorianEgyptianEnglishEstonianEthiopianEuropeanFijianFilipinoFinnishFrenchFrench American IndianFrench CanadianGermanGerman RussianGhanaianGreekGuamanian/ChamorroGuatemalanGuyaneseHaitianHmongHonduranHopiHoumaHungarianIcelanderIndian (Asian)IndonesianInupiatIranianIraqiIrishIroquoisIsraeliItalianJamaicanJapaneseJordanianKenyanKiowaKoreanLaotianLatvianLebaneseLiberianLithuanianLumbeeLuxembourgerMacedonianMalaysianMalteseMarshalleseMenomineeMexicanMexican American IndianMongolianMoroccanNative HawaiianNavajoNepaleseNew ZealanderNicaraguanNigerianNorthern EuropeanNorwegianOkinawanOsageOttawaPaiutePakistaniPalestinianPanamanianParaguayanPennsylvania GermanPeruvianPimaPolishPortuguesePotawatomiPuebloPuerto RicanPuget Sound SalishRomanianRussianSalvadoranSamoanScandinavianScotch-IrishScottishSeminoleSenegaleseSerbianShoshoneSierra LeoneanSiouxSlavicSlovakSloveneSomaliSouth AfricanSouth AmericanSouth American IndianSoviet UnionSpaniardSpanishSpanish AmericanSpanish American IndianSri LankanSubsaharan AfricanSwedishSwissSyrianTaiwaneseThaiTlingit-HaidaTohono O'OdhamTonganTrinidadian and TobagonianTsimshianTurkishU.S. Virgin IslanderUgandanUkrainianUruguayanUteVenezuelanVietnameseWelshWest IndianYakamaYaquiYugoslavianYumanYup'ikZimbabwean
Immigration
NonimmigrantsImmigrantsAfghanistanAfricaAlbaniaArgentinaArmeniaAsiaAustraliaAustriaBahamasBangladeshBarbadosBelarusBelgiumBelizeBoliviaBosnia and HerzegovinaBrazilBulgariaBurma/MyanmarCabo VerdeCambodiaCameroonCanadaCaribbeanCentral AmericaChileChinaColombiaCongoCosta RicaCroatiaCubaCzechoslovakiaDenmarkDominicaDominican RepublicEastern AfricaEastern AsiaEastern EuropeEcuadorEgyptEl SalvadorEnglandEritreaEthiopiaEuropeFijiFranceGermanyGhanaGreeceGrenadaGuatemalaGuyanaHaitiHondurasHong KongHungaryIndiaIndonesiaIranIraqIrelandIsraelItalyJamaicaJapanJordanKazakhstanKenyaKoreaKuwaitLaosLatin AmericaLatviaLebanonLiberiaLithuaniaMalaysiaMexicoMicronesiaMiddle AfricaMoldovaMoroccoNepalNetherlandsNicaraguaNigeriaNorth AmericaNorth MacedoniaNorthern AfricaNorthern EuropeNorwayOceaniaPakistanPanamaPeruPhilippinesPolandPortugalRomaniaRussiaSaudi ArabiaScotlandSenegalSerbiaSierra LeoneSingaporeSomaliaSouth AfricaSouth AmericaSouth Central AsiaSouth Eastern AsiaSouthern EuropeSpainSri LankaSt. Vincent and the GrenadinesSudanSwedenSwitzerlandSyriaTaiwanThailandTrinidad and TobagoTurkeyUgandaUkraineUruguayUzbekistanVenezuelaVietnamWest IndiesWestern AfricaWestern AsiaWestern EuropeYemenZaireZimbabweAzores
Disability Age Under 5
Income
Poverty
Unemployment
Labor Participation
Family Structure
Vehicle Availability
Education Level
Disability

Sudanese Disability Age Under 5
Exceptional

1.1%
DISABILITY | AGE UNDER 5
97.7/ 100
METRIC RATING
85th/ 347
METRIC RANK

Sudanese Disability Age Under 5 Correlation Chart

The statistical analysis conducted on geographies consisting of 86,195,620 people shows a substantial positive correlation between the proportion of Sudanese and percentage of population with a disability under the age of 5 in the United States with a correlation coefficient (R) of 0.572 and weighted average of 1.1%. On average, for every 1% (one percent) increase in Sudanese within a typical geography, there is an increase of 0.58% in percentage of population with a disability under the age of 5.
Sudanese Disability Age Under 5
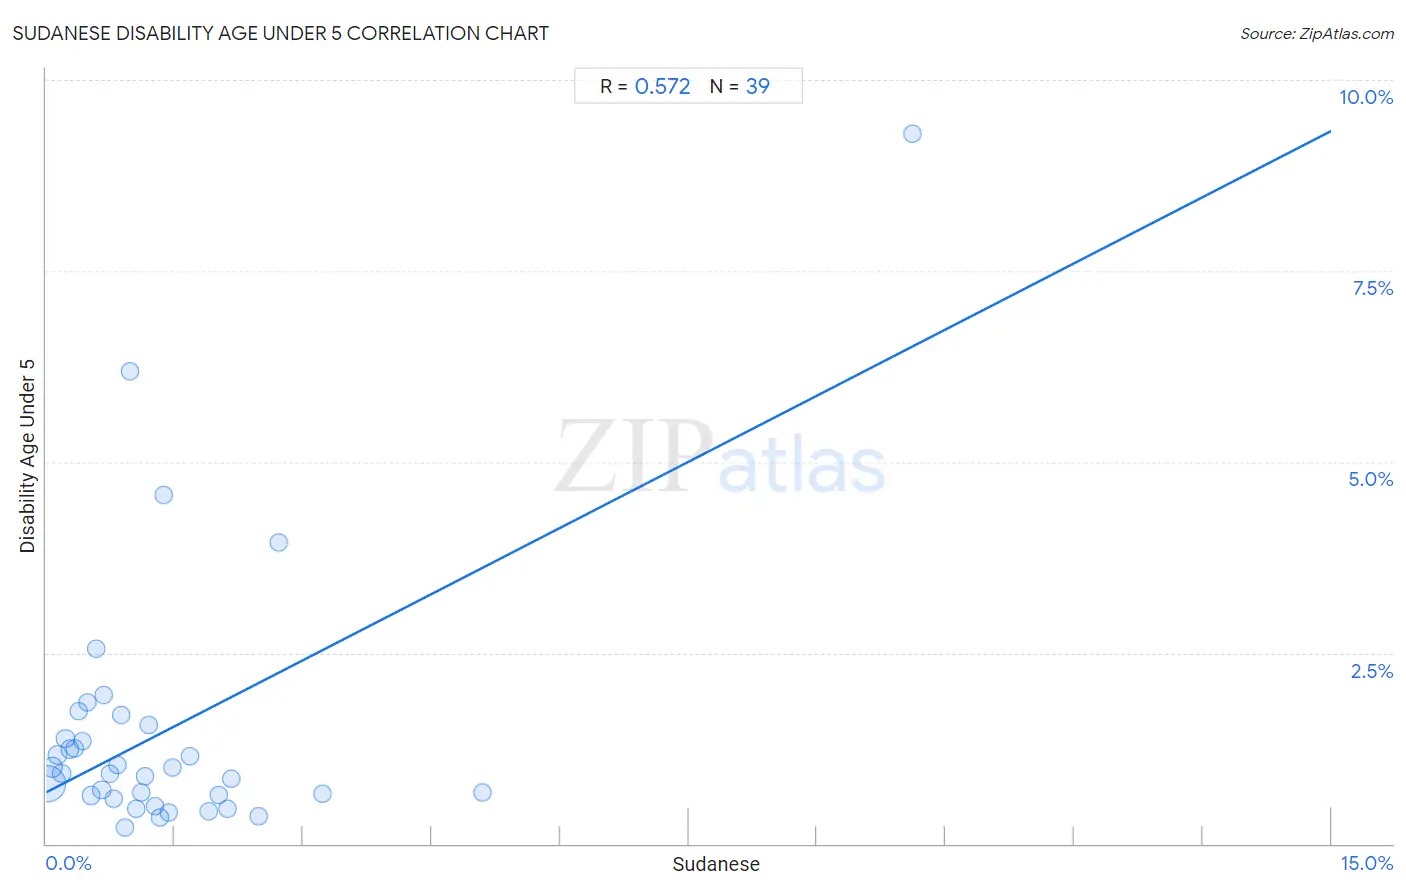
It is essential to understand that the correlation between the percentage of Sudanese and percentage of population with a disability under the age of 5 does not imply a direct cause-and-effect relationship. It remains uncertain whether the presence of Sudanese influences an upward or downward trend in the level of percentage of population with a disability under the age of 5 within an area, or if Sudanese simply ended up residing in those areas with higher or lower levels of percentage of population with a disability under the age of 5 due to other factors.

Demographics Similar to Sudanese by Disability Age Under 5

In terms of disability age under 5, the demographic groups most similar to Sudanese are Immigrants from Zaire (1.1%, a difference of 0.080%), Okinawan (1.1%, a difference of 0.13%), Ugandan (1.1%, a difference of 0.14%), Immigrants from Dominican Republic (1.1%, a difference of 0.17%), and Immigrants from Jordan (1.1%, a difference of 0.23%).
DemographicsRating | RankDisability Age Under 5
West Indians
98.0
/100
|
#78
Exceptional
1.1%
Hmong
98.0
/100
|
#79
Exceptional
1.1%
Immigrants from Trinidad and Tobago
98.0
/100
|
#80
Exceptional
1.1%
Turks
98.0
/100
|
#81
Exceptional
1.1%
Immigrants from Jordan
97.9
/100
|
#82
Exceptional
1.1%
Immigrants from Syria
97.9
/100
|
#83
Exceptional
1.1%
Immigrants from Zaire
97.8
/100
|
#84
Exceptional
1.1%
Sudanese
97.7
/100
|
#85
Exceptional
1.1%
Okinawans
97.6
/100
|
#86
Exceptional
1.1%
Ugandans
97.5
/100
|
#87
Exceptional
1.1%
Immigrants from Dominican Republic
97.5
/100
|
#88
Exceptional
1.1%
Ethiopians
97.2
/100
|
#89
Exceptional
1.1%
Chinese
97.2
/100
|
#90
Exceptional
1.1%
Albanians
97.2
/100
|
#91
Exceptional
1.1%
Immigrants from Cuba
97.0
/100
|
#92
Exceptional
1.1%

Sudanese Disability Age Under 5 Correlation Summary

MeasurementSudanese DataDisability Age Under 5 Data
Minimum0.020%0.21%
Maximum10.1%9.3%
Range10.1%9.1%
Mean1.4%1.5%
Median0.98%0.92%
Interquartile 25% (IQ1)0.48%0.63%
Interquartile 75% (IQ3)1.7%1.6%
Interquartile Range (IQR)1.2%0.93%
Standard Deviation (Sample)1.7%1.8%
Standard Deviation (Population)1.7%1.7%

Correlation Details

Sudanese PercentileSample SizeDisability Age Under 5
[
0.0%
-
0.5%
]
0.020%
60,770,1760.78%
[
0.0%
-
0.5%
]
0.074%
9,161,6000.99%
[
0.0%
-
0.5%
]
0.13%
4,363,0961.2%
[
0.0%
-
0.5%
]
0.17%
2,121,5480.92%
[
0.0%
-
0.5%
]
0.22%
1,282,5501.4%
[
0.0%
-
0.5%
]
0.27%
1,320,6291.2%
[
0.0%
-
0.5%
]
0.33%
2,084,8911.2%
[
0.0%
-
0.5%
]
0.38%
513,4921.7%
[
0.0%
-
0.5%
]
0.43%
650,1331.3%
[
0.0%
-
0.5%
]
0.48%
539,6441.8%
[
0.5%
-
1.0%
]
0.52%
751,5370.63%
[
0.5%
-
1.0%
]
0.58%
189,6032.5%
[
0.5%
-
1.0%
]
0.65%
661,9940.70%
[
0.5%
-
1.0%
]
0.68%
156,0112.0%
[
0.5%
-
1.0%
]
0.74%
227,0450.92%
[
0.5%
-
1.0%
]
0.78%
65,1960.58%
[
0.5%
-
1.0%
]
0.83%
117,8071.0%
[
0.5%
-
1.0%
]
0.88%
71,5481.7%
[
0.5%
-
1.0%
]
0.92%
72,6880.21%
[
0.5%
-
1.0%
]
0.98%
41,2036.2%
[
1.0%
-
1.5%
]
1.05%
173,6650.46%
[
1.0%
-
1.5%
]
1.11%
117,9610.67%
[
1.0%
-
1.5%
]
1.16%
64,6490.88%
[
1.0%
-
1.5%
]
1.20%
2,0851.6%
[
1.0%
-
1.5%
]
1.26%
44,4440.50%
[
1.0%
-
1.5%
]
1.33%
213,1640.35%
[
1.0%
-
1.5%
]
1.37%
57,2054.6%
[
1.0%
-
1.5%
]
1.42%
22,1870.41%
[
1.0%
-
1.5%
]
1.47%
28,5491.00%
[
1.5%
-
2.0%
]
1.68%
19,5311.2%
[
1.5%
-
2.0%
]
1.89%
29,3160.42%
[
2.0%
-
2.5%
]
2.01%
29,5800.63%
[
2.0%
-
2.5%
]
2.12%
26,1560.45%
[
2.0%
-
2.5%
]
2.16%
43,1830.85%
[
2.0%
-
2.5%
]
2.48%
38,0950.36%
[
2.5%
-
3.0%
]
2.71%
66,2494.0%
[
3.0%
-
3.5%
]
3.22%
31,9760.66%
[
5.0%
-
5.5%
]
5.10%
24,0280.66%
[
10.0%
-
10.5%
]
10.12%
1,2069.3%