Immigrants Disability Age Under 5
COMPARE
Immigrants
Select to Compare
Disability Age Under 5
Immigrants Disability Age Under 5
1.2%
DISABILITY | AGE UNDER 5
88.0/ 100
METRIC RATING
129th/ 347
METRIC RANK
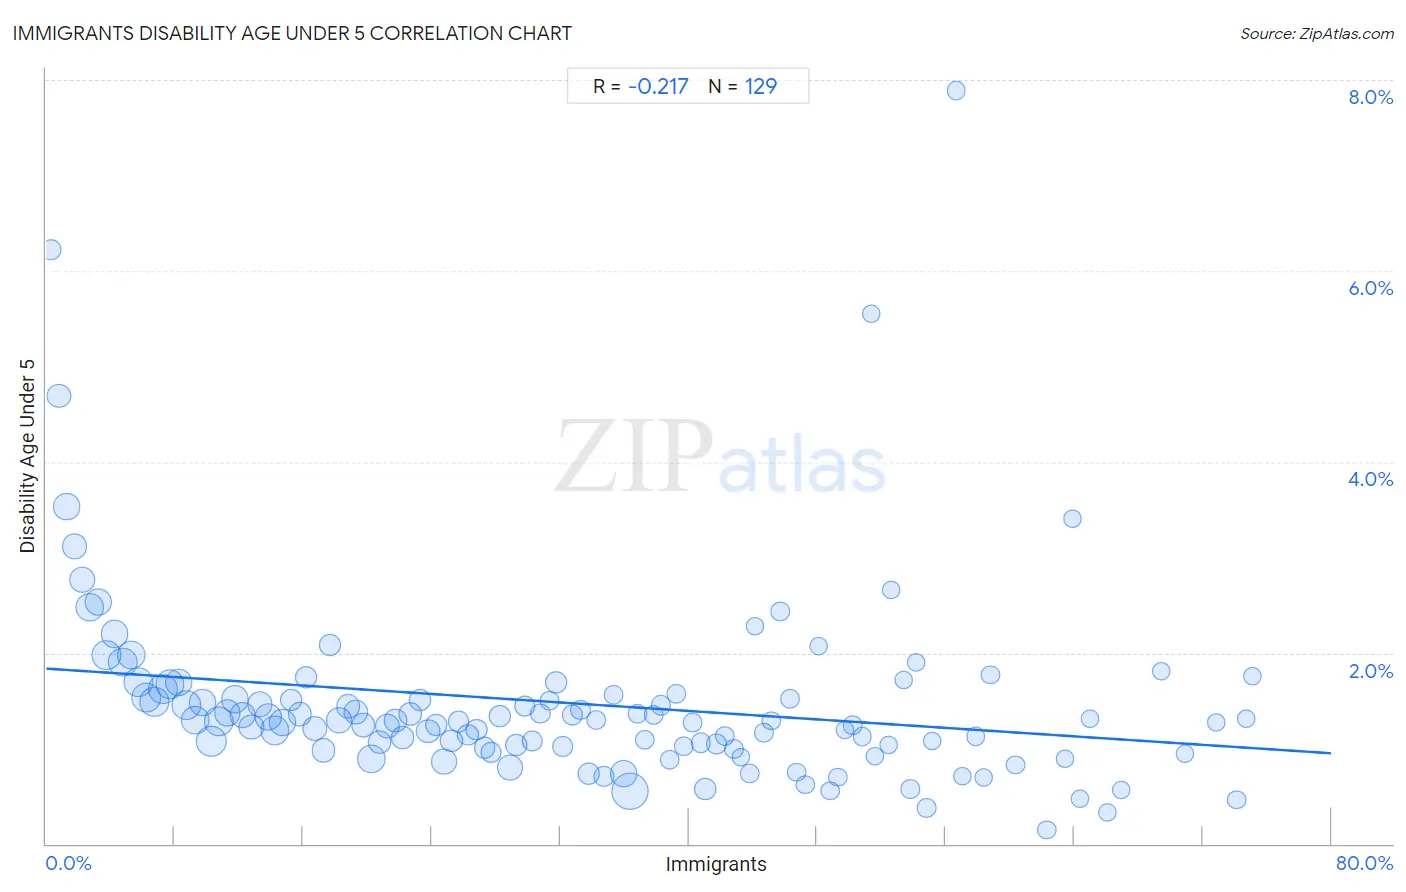
Immigrants Disability Age Under 5 Correlation Chart
The statistical analysis conducted on geographies consisting of 262,190,696 people shows a weak negative correlation between the proportion of Immigrants and percentage of population with a disability under the age of 5 in the United States with a correlation coefficient (R) of -0.217 and weighted average of 1.2%. On average, for every 1% (one percent) increase in Immigrants within a typical geography, there is a decrease of 0.011% in percentage of population with a disability under the age of 5.
It is essential to understand that the correlation between the percentage of Immigrants and percentage of population with a disability under the age of 5 does not imply a direct cause-and-effect relationship. It remains uncertain whether the presence of Immigrants influences an upward or downward trend in the level of percentage of population with a disability under the age of 5 within an area, or if Immigrants simply ended up residing in those areas with higher or lower levels of percentage of population with a disability under the age of 5 due to other factors.
Demographics Similar to Immigrants by Disability Age Under 5
In terms of disability age under 5, the demographic groups most similar to Immigrants are Korean (1.2%, a difference of 0.080%), Immigrants from Romania (1.2%, a difference of 0.090%), Immigrants from France (1.2%, a difference of 0.090%), Immigrants from Serbia (1.2%, a difference of 0.090%), and Immigrants from Eastern Europe (1.2%, a difference of 0.16%).
| Demographics | Rating | Rank | Disability Age Under 5 |
| Aleuts | 90.7 /100 | #122 | Exceptional 1.2% |
| Zimbabweans | 90.6 /100 | #123 | Exceptional 1.2% |
| Immigrants from Cambodia | 90.5 /100 | #124 | Exceptional 1.2% |
| Japanese | 90.3 /100 | #125 | Exceptional 1.2% |
| Central Americans | 89.7 /100 | #126 | Excellent 1.2% |
| Immigrants from Romania | 88.4 /100 | #127 | Excellent 1.2% |
| Immigrants from France | 88.4 /100 | #128 | Excellent 1.2% |
| Immigrants | 88.0 /100 | #129 | Excellent 1.2% |
| Koreans | 87.7 /100 | #130 | Excellent 1.2% |
| Immigrants from Serbia | 87.6 /100 | #131 | Excellent 1.2% |
| Immigrants from Eastern Europe | 87.3 /100 | #132 | Excellent 1.2% |
| Immigrants from Spain | 86.5 /100 | #133 | Excellent 1.2% |
| Argentineans | 85.7 /100 | #134 | Excellent 1.2% |
| Fijians | 84.7 /100 | #135 | Excellent 1.2% |
| Moroccans | 83.6 /100 | #136 | Excellent 1.2% |
Immigrants Disability Age Under 5 Correlation Summary
| Measurement | Immigrants Data | Disability Age Under 5 Data |
| Minimum | 0.28% | 0.14% |
| Maximum | 75.1% | 7.9% |
| Range | 74.8% | 7.8% |
| Mean | 33.1% | 1.5% |
| Median | 32.2% | 1.3% |
| Interquartile 25% (IQ1) | 16.0% | 1.0% |
| Interquartile 75% (IQ3) | 49.0% | 1.5% |
| Interquartile Range (IQR) | 33.1% | 0.54% |
| Standard Deviation (Sample) | 20.1% | 1.0% |
| Standard Deviation (Population) | 20.0% | 1.0% |
Correlation Details
| Immigrants Percentile | Sample Size | Disability Age Under 5 |
[ 0.0% - 0.5% ] 0.28% | 1,495,253 | 6.2% |
[ 0.5% - 1.0% ] 0.78% | 2,978,791 | 4.7% |
[ 1.0% - 1.5% ] 1.27% | 4,032,327 | 3.5% |
[ 1.5% - 2.0% ] 1.77% | 3,629,926 | 3.1% |
[ 2.0% - 2.5% ] 2.25% | 4,087,135 | 2.8% |
[ 2.5% - 3.0% ] 2.73% | 5,333,957 | 2.5% |
[ 3.0% - 3.5% ] 3.24% | 4,897,207 | 2.5% |
[ 3.5% - 4.0% ] 3.73% | 5,542,241 | 2.0% |
[ 4.0% - 4.5% ] 4.25% | 4,876,368 | 2.2% |
[ 4.5% - 5.0% ] 4.75% | 5,453,455 | 1.9% |
[ 5.0% - 5.5% ] 5.27% | 5,096,236 | 2.0% |
[ 5.5% - 6.0% ] 5.73% | 6,024,487 | 1.7% |
[ 6.0% - 6.5% ] 6.25% | 5,687,756 | 1.5% |
[ 6.5% - 7.0% ] 6.73% | 5,109,501 | 1.5% |
[ 7.0% - 7.5% ] 7.26% | 5,317,983 | 1.6% |
[ 7.5% - 8.0% ] 7.72% | 5,213,301 | 1.7% |
[ 8.0% - 8.5% ] 8.21% | 4,481,874 | 1.7% |
[ 8.5% - 9.0% ] 8.75% | 5,597,969 | 1.5% |
[ 9.0% - 9.5% ] 9.26% | 4,907,192 | 1.3% |
[ 9.5% - 10.0% ] 9.76% | 4,403,957 | 1.5% |
[ 10.0% - 10.5% ] 10.26% | 6,313,524 | 1.1% |
[ 10.5% - 11.0% ] 10.73% | 5,636,357 | 1.3% |
[ 11.0% - 11.5% ] 11.26% | 4,004,700 | 1.4% |
[ 11.5% - 12.0% ] 11.77% | 4,554,937 | 1.5% |
[ 12.0% - 12.5% ] 12.20% | 3,746,182 | 1.4% |
[ 12.5% - 13.0% ] 12.75% | 3,645,067 | 1.2% |
[ 13.0% - 13.5% ] 13.29% | 3,276,313 | 1.5% |
[ 13.5% - 14.0% ] 13.83% | 4,912,259 | 1.3% |
[ 14.0% - 14.5% ] 14.24% | 5,267,501 | 1.2% |
[ 14.5% - 15.0% ] 14.71% | 4,460,472 | 1.3% |
[ 15.0% - 15.5% ] 15.25% | 2,027,515 | 1.5% |
[ 15.5% - 16.0% ] 15.77% | 2,704,094 | 1.4% |
[ 16.0% - 16.5% ] 16.20% | 2,072,831 | 1.7% |
[ 16.5% - 17.0% ] 16.73% | 3,392,421 | 1.2% |
[ 17.0% - 17.5% ] 17.27% | 2,804,536 | 0.98% |
[ 17.5% - 18.0% ] 17.67% | 1,916,018 | 2.1% |
[ 18.0% - 18.5% ] 18.25% | 3,499,004 | 1.3% |
[ 18.5% - 19.0% ] 18.80% | 3,130,272 | 1.4% |
[ 19.0% - 19.5% ] 19.29% | 3,586,700 | 1.4% |
[ 19.5% - 20.0% ] 19.73% | 3,040,868 | 1.2% |
[ 20.0% - 20.5% ] 20.26% | 4,945,461 | 0.88% |
[ 20.5% - 21.0% ] 20.76% | 2,950,008 | 1.1% |
[ 21.0% - 21.5% ] 21.22% | 3,312,140 | 1.2% |
[ 21.5% - 22.0% ] 21.75% | 1,988,798 | 1.3% |
[ 22.0% - 22.5% ] 22.22% | 2,459,775 | 1.1% |
[ 22.5% - 23.0% ] 22.68% | 2,314,523 | 1.4% |
[ 23.0% - 23.5% ] 23.26% | 1,881,087 | 1.5% |
[ 23.5% - 24.0% ] 23.77% | 2,580,464 | 1.2% |
[ 24.0% - 24.5% ] 24.28% | 1,910,392 | 1.2% |
[ 24.5% - 25.0% ] 24.77% | 3,468,664 | 0.86% |
[ 25.0% - 25.5% ] 25.24% | 2,360,158 | 1.1% |
[ 25.5% - 26.0% ] 25.67% | 1,455,675 | 1.3% |
[ 26.0% - 26.5% ] 26.25% | 1,468,651 | 1.1% |
[ 26.5% - 27.0% ] 26.77% | 1,622,514 | 1.2% |
[ 27.0% - 27.5% ] 27.30% | 1,663,893 | 1.0% |
[ 27.5% - 28.0% ] 27.71% | 1,463,169 | 0.95% |
[ 28.0% - 28.5% ] 28.22% | 2,052,091 | 1.3% |
[ 28.5% - 29.0% ] 28.90% | 3,736,615 | 0.80% |
[ 29.0% - 29.5% ] 29.29% | 1,892,101 | 1.0% |
[ 29.5% - 30.0% ] 29.78% | 1,464,894 | 1.4% |
[ 30.0% - 30.5% ] 30.27% | 1,496,113 | 1.1% |
[ 30.5% - 31.0% ] 30.77% | 883,562 | 1.4% |
[ 31.0% - 31.5% ] 31.33% | 1,146,113 | 1.5% |
[ 31.5% - 32.0% ] 31.76% | 2,020,413 | 1.7% |
[ 32.0% - 32.5% ] 32.15% | 1,067,570 | 1.0% |
[ 32.5% - 33.0% ] 32.74% | 1,325,244 | 1.3% |
[ 33.0% - 33.5% ] 33.26% | 790,538 | 1.4% |
[ 33.5% - 34.0% ] 33.76% | 1,981,665 | 0.74% |
[ 34.0% - 34.5% ] 34.27% | 686,703 | 1.3% |
[ 34.5% - 35.0% ] 34.69% | 1,141,560 | 0.71% |
[ 35.0% - 35.5% ] 35.30% | 819,031 | 1.6% |
[ 35.5% - 36.0% ] 35.94% | 4,535,505 | 0.74% |
[ 36.0% - 36.5% ] 36.33% | 9,500,588 | 0.54% |
[ 36.5% - 37.0% ] 36.77% | 692,025 | 1.4% |
[ 37.0% - 37.5% ] 37.28% | 876,182 | 1.1% |
[ 37.5% - 38.0% ] 37.82% | 722,334 | 1.4% |
[ 38.0% - 38.5% ] 38.26% | 977,018 | 1.4% |
[ 38.5% - 39.0% ] 38.81% | 904,573 | 0.88% |
[ 39.0% - 39.5% ] 39.25% | 544,637 | 1.6% |
[ 39.5% - 40.0% ] 39.68% | 660,456 | 1.0% |
[ 40.0% - 40.5% ] 40.27% | 552,250 | 1.3% |
[ 40.5% - 41.0% ] 40.77% | 1,029,266 | 1.1% |
[ 41.0% - 41.5% ] 41.05% | 1,658,265 | 0.57% |
[ 41.5% - 42.0% ] 41.70% | 1,064,515 | 1.0% |
[ 42.0% - 42.5% ] 42.27% | 842,318 | 1.1% |
[ 42.5% - 43.0% ] 42.79% | 449,985 | 0.99% |
[ 43.0% - 43.5% ] 43.24% | 384,271 | 0.91% |
[ 43.5% - 44.0% ] 43.78% | 963,049 | 0.74% |
[ 44.0% - 44.5% ] 44.16% | 46,788 | 2.3% |
[ 44.5% - 45.0% ] 44.68% | 429,993 | 1.2% |
[ 45.0% - 45.5% ] 45.13% | 537,868 | 1.3% |
[ 45.5% - 46.0% ] 45.72% | 423,834 | 2.4% |
[ 46.0% - 46.5% ] 46.31% | 603,999 | 1.5% |
[ 46.5% - 47.0% ] 46.72% | 247,652 | 0.75% |
[ 47.0% - 47.5% ] 47.27% | 333,419 | 0.62% |
[ 48.0% - 48.5% ] 48.07% | 115,911 | 2.1% |
[ 48.5% - 49.0% ] 48.80% | 458,014 | 0.55% |
[ 49.0% - 49.5% ] 49.30% | 311,092 | 0.70% |
[ 49.5% - 50.0% ] 49.70% | 76,658 | 1.2% |
[ 50.0% - 50.5% ] 50.23% | 447,437 | 1.2% |
[ 50.5% - 51.0% ] 50.81% | 286,005 | 1.1% |
[ 51.0% - 51.5% ] 51.33% | 5,922 | 5.6% |
[ 51.5% - 52.0% ] 51.58% | 88,180 | 0.92% |
[ 52.0% - 52.5% ] 52.43% | 100,373 | 1.0% |
[ 52.5% - 53.0% ] 52.63% | 51,153 | 2.7% |
[ 53.0% - 53.5% ] 53.36% | 52,152 | 1.7% |
[ 53.5% - 54.0% ] 53.79% | 304,106 | 0.57% |
[ 54.0% - 54.5% ] 54.16% | 104,461 | 1.9% |
[ 54.5% - 55.0% ] 54.81% | 224,465 | 0.38% |
[ 55.0% - 55.5% ] 55.15% | 293,259 | 1.1% |
[ 56.5% - 57.0% ] 56.64% | 37,340 | 7.9% |
[ 57.0% - 57.5% ] 57.07% | 67,287 | 0.70% |
[ 57.5% - 58.0% ] 57.87% | 484,697 | 1.1% |
[ 58.0% - 58.5% ] 58.34% | 67,394 | 0.69% |
[ 58.5% - 59.0% ] 58.79% | 146,628 | 1.8% |
[ 60.0% - 60.5% ] 60.34% | 112,750 | 0.82% |
[ 62.0% - 62.5% ] 62.29% | 83,069 | 0.14% |
[ 63.0% - 63.5% ] 63.43% | 24,597 | 0.88% |
[ 63.5% - 64.0% ] 63.88% | 13,163 | 3.4% |
[ 64.0% - 64.5% ] 64.38% | 56,696 | 0.48% |
[ 64.5% - 65.0% ] 64.97% | 21,778 | 1.3% |
[ 66.0% - 66.5% ] 66.09% | 102,618 | 0.33% |
[ 66.5% - 67.0% ] 66.91% | 52,851 | 0.56% |
[ 69.0% - 69.5% ] 69.38% | 34,335 | 1.8% |
[ 70.5% - 71.0% ] 70.88% | 79,495 | 0.94% |
[ 72.5% - 73.0% ] 72.85% | 57,066 | 1.3% |
[ 74.0% - 74.5% ] 74.12% | 222,996 | 0.46% |
[ 74.5% - 75.0% ] 74.68% | 46,798 | 1.3% |
[ 75.0% - 75.5% ] 75.10% | 71,088 | 1.8% |