Venezuelan Disability Age Under 5

COMPARE

Venezuelan
Race
Ancestry
AfghanAfricanAlaska NativeAlaskan AthabascanAlbanianAleutAlsatianAmericanApacheArabArapahoArgentineanArmenianAssyrian/Chaldean/SyriacAustralianAustrianBahamianBangladeshiBarbadianBasqueBelgianBelizeanBermudanBhutaneseBlackfeetBolivianBrazilianBritishBritish West IndianBulgarianBurmeseCajunCambodianCanadianCape VerdeanCarpatho RusynCelticCentral AmericanCentral American IndianCherokeeCheyenneChickasawChileanChineseChippewaChoctawColombianColvilleComancheCosta RicanCreeCreekCroatianCrowCubanCypriotCzechCzechoslovakianDanishDelawareDominicanDutchDutch West IndianEastern EuropeanEcuadorianEgyptianEnglishEstonianEthiopianEuropeanFijianFilipinoFinnishFrenchFrench American IndianFrench CanadianGermanGerman RussianGhanaianGreekGuamanian/ChamorroGuatemalanGuyaneseHaitianHmongHonduranHopiHoumaHungarianIcelanderIndian (Asian)IndonesianInupiatIranianIraqiIrishIroquoisIsraeliItalianJamaicanJapaneseJordanianKenyanKiowaKoreanLaotianLatvianLebaneseLiberianLithuanianLumbeeLuxembourgerMacedonianMalaysianMalteseMarshalleseMenomineeMexicanMexican American IndianMongolianMoroccanNative HawaiianNavajoNepaleseNew ZealanderNicaraguanNigerianNorthern EuropeanNorwegianOkinawanOsageOttawaPaiutePakistaniPalestinianPanamanianParaguayanPennsylvania GermanPeruvianPimaPolishPortuguesePotawatomiPuebloPuerto RicanPuget Sound SalishRomanianRussianSalvadoranSamoanScandinavianScotch-IrishScottishSeminoleSenegaleseSerbianShoshoneSierra LeoneanSiouxSlavicSlovakSloveneSomaliSouth AfricanSouth AmericanSouth American IndianSoviet UnionSpaniardSpanishSpanish AmericanSpanish American IndianSri LankanSubsaharan AfricanSudaneseSwedishSwissSyrianTaiwaneseThaiTlingit-HaidaTohono O'OdhamTonganTrinidadian and TobagonianTsimshianTurkishU.S. Virgin IslanderUgandanUkrainianUruguayanUteVenezuelanVietnameseWelshWest IndianYakamaYaquiYugoslavianYumanYup'ikZimbabwean
Immigration
NonimmigrantsImmigrantsAfghanistanAfricaAlbaniaArgentinaArmeniaAsiaAustraliaAustriaBahamasBangladeshBarbadosBelarusBelgiumBelizeBoliviaBosnia and HerzegovinaBrazilBulgariaBurma/MyanmarCabo VerdeCambodiaCameroonCanadaCaribbeanCentral AmericaChileChinaColombiaCongoCosta RicaCroatiaCubaCzechoslovakiaDenmarkDominicaDominican RepublicEastern AfricaEastern AsiaEastern EuropeEcuadorEgyptEl SalvadorEnglandEritreaEthiopiaEuropeFijiFranceGermanyGhanaGreeceGrenadaGuatemalaGuyanaHaitiHondurasHong KongHungaryIndiaIndonesiaIranIraqIrelandIsraelItalyJamaicaJapanJordanKazakhstanKenyaKoreaKuwaitLaosLatin AmericaLatviaLebanonLiberiaLithuaniaMalaysiaMexicoMicronesiaMiddle AfricaMoldovaMoroccoNepalNetherlandsNicaraguaNigeriaNorth AmericaNorth MacedoniaNorthern AfricaNorthern EuropeNorwayOceaniaPakistanPanamaPeruPhilippinesPolandPortugalRomaniaRussiaSaudi ArabiaScotlandSenegalSerbiaSierra LeoneSingaporeSomaliaSouth AfricaSouth AmericaSouth Central AsiaSouth Eastern AsiaSouthern EuropeSpainSri LankaSt. Vincent and the GrenadinesSudanSwedenSwitzerlandSyriaTaiwanThailandTrinidad and TobagoTurkeyUgandaUkraineUruguayUzbekistanVenezuelaVietnamWest IndiesWestern AfricaWestern AsiaWestern EuropeYemenZaireZimbabweAzores
Select to Compare
Race
Ancestry
AfghanAfricanAlaska NativeAlaskan AthabascanAlbanianAleutAlsatianAmericanApacheArabArapahoArgentineanArmenianAssyrian/Chaldean/SyriacAustralianAustrianBahamianBangladeshiBarbadianBasqueBelgianBelizeanBermudanBhutaneseBlackfeetBolivianBrazilianBritishBritish West IndianBulgarianBurmeseCajunCambodianCanadianCape VerdeanCarpatho RusynCelticCentral AmericanCentral American IndianCherokeeCheyenneChickasawChileanChineseChippewaChoctawColombianColvilleComancheCosta RicanCreeCreekCroatianCrowCubanCypriotCzechCzechoslovakianDanishDelawareDominicanDutchDutch West IndianEastern EuropeanEcuadorianEgyptianEnglishEstonianEthiopianEuropeanFijianFilipinoFinnishFrenchFrench American IndianFrench CanadianGermanGerman RussianGhanaianGreekGuamanian/ChamorroGuatemalanGuyaneseHaitianHmongHonduranHopiHoumaHungarianIcelanderIndian (Asian)IndonesianInupiatIranianIraqiIrishIroquoisIsraeliItalianJamaicanJapaneseJordanianKenyanKiowaKoreanLaotianLatvianLebaneseLiberianLithuanianLumbeeLuxembourgerMacedonianMalaysianMalteseMarshalleseMenomineeMexicanMexican American IndianMongolianMoroccanNative HawaiianNavajoNepaleseNew ZealanderNicaraguanNigerianNorthern EuropeanNorwegianOkinawanOsageOttawaPaiutePakistaniPalestinianPanamanianParaguayanPennsylvania GermanPeruvianPimaPolishPortuguesePotawatomiPuebloPuerto RicanPuget Sound SalishRomanianRussianSalvadoranSamoanScandinavianScotch-IrishScottishSeminoleSenegaleseSerbianShoshoneSierra LeoneanSiouxSlavicSlovakSloveneSomaliSouth AfricanSouth AmericanSouth American IndianSoviet UnionSpaniardSpanishSpanish AmericanSpanish American IndianSri LankanSubsaharan AfricanSudaneseSwedishSwissSyrianTaiwaneseThaiTlingit-HaidaTohono O'OdhamTonganTrinidadian and TobagonianTsimshianTurkishU.S. Virgin IslanderUgandanUkrainianUruguayanUteVietnameseWelshWest IndianYakamaYaquiYugoslavianYumanYup'ikZimbabwean
Immigration
NonimmigrantsImmigrantsAfghanistanAfricaAlbaniaArgentinaArmeniaAsiaAustraliaAustriaBahamasBangladeshBarbadosBelarusBelgiumBelizeBoliviaBosnia and HerzegovinaBrazilBulgariaBurma/MyanmarCabo VerdeCambodiaCameroonCanadaCaribbeanCentral AmericaChileChinaColombiaCongoCosta RicaCroatiaCubaCzechoslovakiaDenmarkDominicaDominican RepublicEastern AfricaEastern AsiaEastern EuropeEcuadorEgyptEl SalvadorEnglandEritreaEthiopiaEuropeFijiFranceGermanyGhanaGreeceGrenadaGuatemalaGuyanaHaitiHondurasHong KongHungaryIndiaIndonesiaIranIraqIrelandIsraelItalyJamaicaJapanJordanKazakhstanKenyaKoreaKuwaitLaosLatin AmericaLatviaLebanonLiberiaLithuaniaMalaysiaMexicoMicronesiaMiddle AfricaMoldovaMoroccoNepalNetherlandsNicaraguaNigeriaNorth AmericaNorth MacedoniaNorthern AfricaNorthern EuropeNorwayOceaniaPakistanPanamaPeruPhilippinesPolandPortugalRomaniaRussiaSaudi ArabiaScotlandSenegalSerbiaSierra LeoneSingaporeSomaliaSouth AfricaSouth AmericaSouth Central AsiaSouth Eastern AsiaSouthern EuropeSpainSri LankaSt. Vincent and the GrenadinesSudanSwedenSwitzerlandSyriaTaiwanThailandTrinidad and TobagoTurkeyUgandaUkraineUruguayUzbekistanVenezuelaVietnamWest IndiesWestern AfricaWestern AsiaWestern EuropeYemenZaireZimbabweAzores
Disability Age Under 5
Income
Poverty
Unemployment
Labor Participation
Family Structure
Vehicle Availability
Education Level
Disability

Venezuelan Disability Age Under 5
Average

1.2%
DISABILITY | AGE UNDER 5
47.1/ 100
METRIC RATING
178th/ 347
METRIC RANK

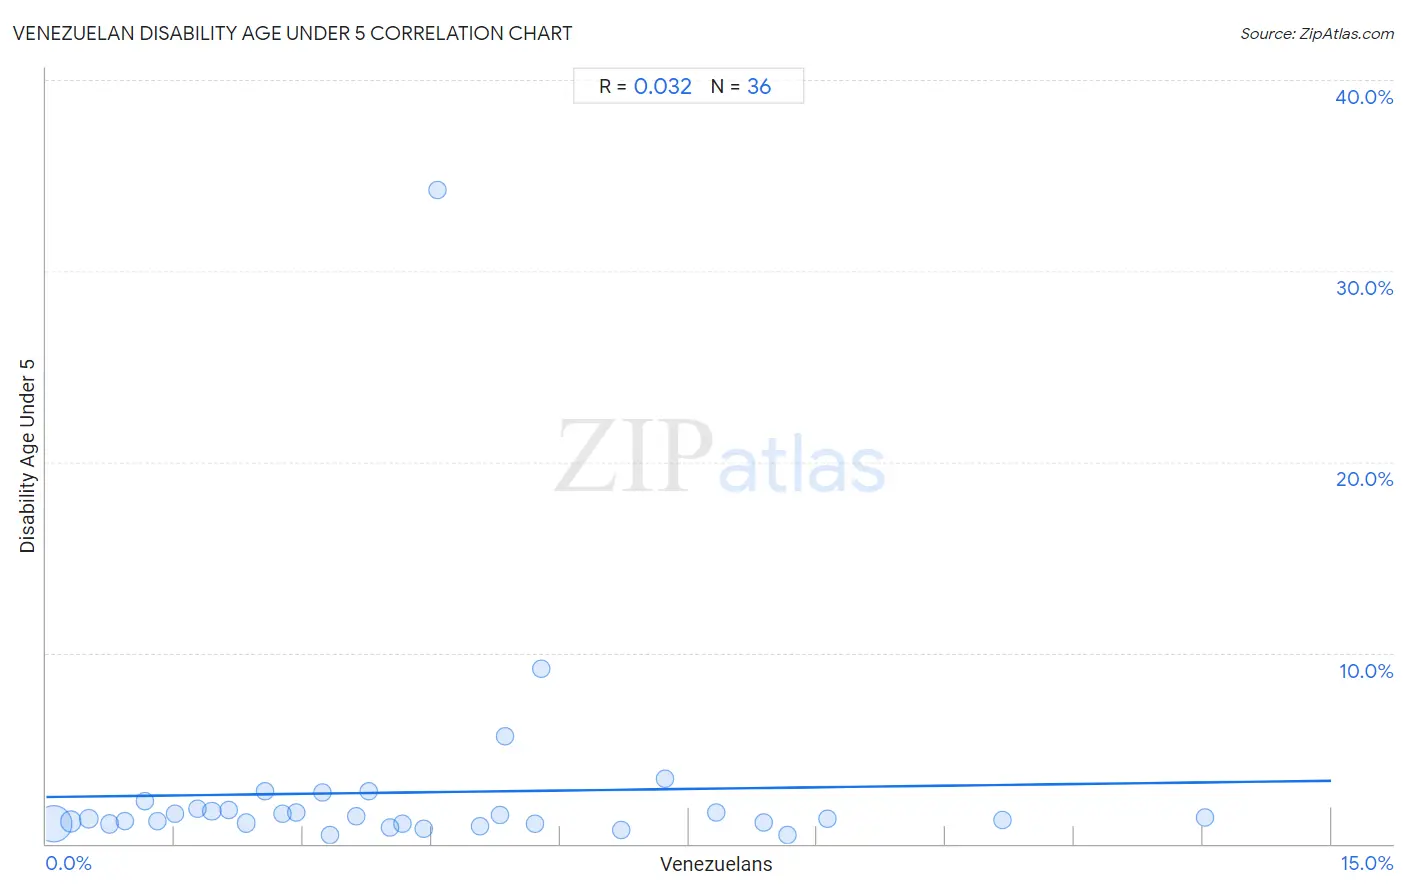
Venezuelan Disability Age Under 5 Correlation Chart

The statistical analysis conducted on geographies consisting of 181,706,863 people shows no correlation between the proportion of Venezuelans and percentage of population with a disability under the age of 5 in the United States with a correlation coefficient (R) of 0.032 and weighted average of 1.2%. On average, for every 1% (one percent) increase in Venezuelans within a typical geography, there is an increase of 0.056% in percentage of population with a disability under the age of 5.
Venezuelan Disability Age Under 5
It is essential to understand that the correlation between the percentage of Venezuelans and percentage of population with a disability under the age of 5 does not imply a direct cause-and-effect relationship. It remains uncertain whether the presence of Venezuelans influences an upward or downward trend in the level of percentage of population with a disability under the age of 5 within an area, or if Venezuelans simply ended up residing in those areas with higher or lower levels of percentage of population with a disability under the age of 5 due to other factors.

Demographics Similar to Venezuelans by Disability Age Under 5

In terms of disability age under 5, the demographic groups most similar to Venezuelans are Comanche (1.2%, a difference of 0.040%), Immigrants from Kenya (1.2%, a difference of 0.14%), Immigrants from Bahamas (1.2%, a difference of 0.17%), Immigrants from Mexico (1.2%, a difference of 0.24%), and Immigrants from Latvia (1.2%, a difference of 0.27%).
DemographicsRating | RankDisability Age Under 5
Guamanians/Chamorros
57.8
/100
|
#171
Average
1.2%
Crow
51.0
/100
|
#172
Average
1.2%
Immigrants from Ireland
50.3
/100
|
#173
Average
1.2%
Immigrants from Latvia
50.0
/100
|
#174
Average
1.2%
Immigrants from Nigeria
50.0
/100
|
#175
Average
1.2%
Immigrants from Kenya
48.6
/100
|
#176
Average
1.2%
Comanche
47.5
/100
|
#177
Average
1.2%
Venezuelans
47.1
/100
|
#178
Average
1.2%
Immigrants from Bahamas
45.2
/100
|
#179
Average
1.2%
Immigrants from Mexico
44.4
/100
|
#180
Average
1.2%
Immigrants from Peru
43.7
/100
|
#181
Average
1.2%
Macedonians
43.7
/100
|
#181
Average
1.2%
Immigrants from Saudi Arabia
43.3
/100
|
#183
Average
1.2%
Palestinians
43.0
/100
|
#184
Average
1.2%
Immigrants from Western Africa
42.5
/100
|
#185
Average
1.2%

Venezuelan Disability Age Under 5 Correlation Summary

MeasurementVenezuelan DataDisability Age Under 5 Data
Minimum0.091%0.44%
Maximum13.5%34.2%
Range13.4%33.8%
Mean4.3%2.7%
Median3.7%1.4%
Interquartile 25% (IQ1)1.9%1.0%
Interquartile 75% (IQ3)5.7%1.8%
Interquartile Range (IQR)3.9%0.76%
Standard Deviation (Sample)3.2%5.6%
Standard Deviation (Population)3.1%5.6%

Correlation Details

Venezuelan PercentileSample SizeDisability Age Under 5
[
0.0%
-
0.5%
]
0.091%
133,240,5151.1%
[
0.0%
-
0.5%
]
0.29%
23,857,1851.2%
[
0.5%
-
1.0%
]
0.50%
8,650,6721.3%
[
0.5%
-
1.0%
]
0.74%
6,194,4401.0%
[
0.5%
-
1.0%
]
0.92%
2,216,3241.2%
[
1.0%
-
1.5%
]
1.15%
1,634,4842.2%
[
1.0%
-
1.5%
]
1.30%
1,221,6551.2%
[
1.5%
-
2.0%
]
1.51%
330,2171.6%
[
1.5%
-
2.0%
]
1.77%
494,2381.9%
[
1.5%
-
2.0%
]
1.93%
487,2741.7%
[
2.0%
-
2.5%
]
2.13%
228,1051.7%
[
2.0%
-
2.5%
]
2.34%
568,3691.1%
[
2.5%
-
3.0%
]
2.55%
87,7262.8%
[
2.5%
-
3.0%
]
2.76%
278,1291.6%
[
2.5%
-
3.0%
]
2.92%
66,0391.7%
[
3.0%
-
3.5%
]
3.22%
85,7612.7%
[
3.0%
-
3.5%
]
3.31%
43,7020.44%
[
3.5%
-
4.0%
]
3.62%
50,3001.4%
[
3.5%
-
4.0%
]
3.77%
29,2402.8%
[
4.0%
-
4.5%
]
4.02%
160,2750.83%
[
4.0%
-
4.5%
]
4.16%
882,9951.0%
[
4.0%
-
4.5%
]
4.40%
167,3760.76%
[
4.5%
-
5.0%
]
4.57%
3,28334.2%
[
5.0%
-
5.5%
]
5.06%
12,7460.89%
[
5.0%
-
5.5%
]
5.29%
176,8531.5%
[
5.0%
-
5.5%
]
5.36%
30,0345.6%
[
5.5%
-
6.0%
]
5.71%
22,5061.0%
[
5.5%
-
6.0%
]
5.78%
2,3369.2%
[
6.5%
-
7.0%
]
6.71%
183,1600.72%
[
7.0%
-
7.5%
]
7.22%
13,1633.4%
[
7.5%
-
8.0%
]
7.82%
25,2831.6%
[
8.0%
-
8.5%
]
8.37%
23,7081.1%
[
8.5%
-
9.0%
]
8.66%
48,7620.46%
[
9.0%
-
9.5%
]
9.12%
78,4781.3%
[
11.0%
-
11.5%
]
11.16%
57,0661.3%
[
13.5%
-
14.0%
]
13.53%
54,4641.4%