States with the Highest Percentage of Population Employed in Architecture & Engineering
RELATED REPORTS & OPTIONS
Architecture & Engineering
United States
Compare States
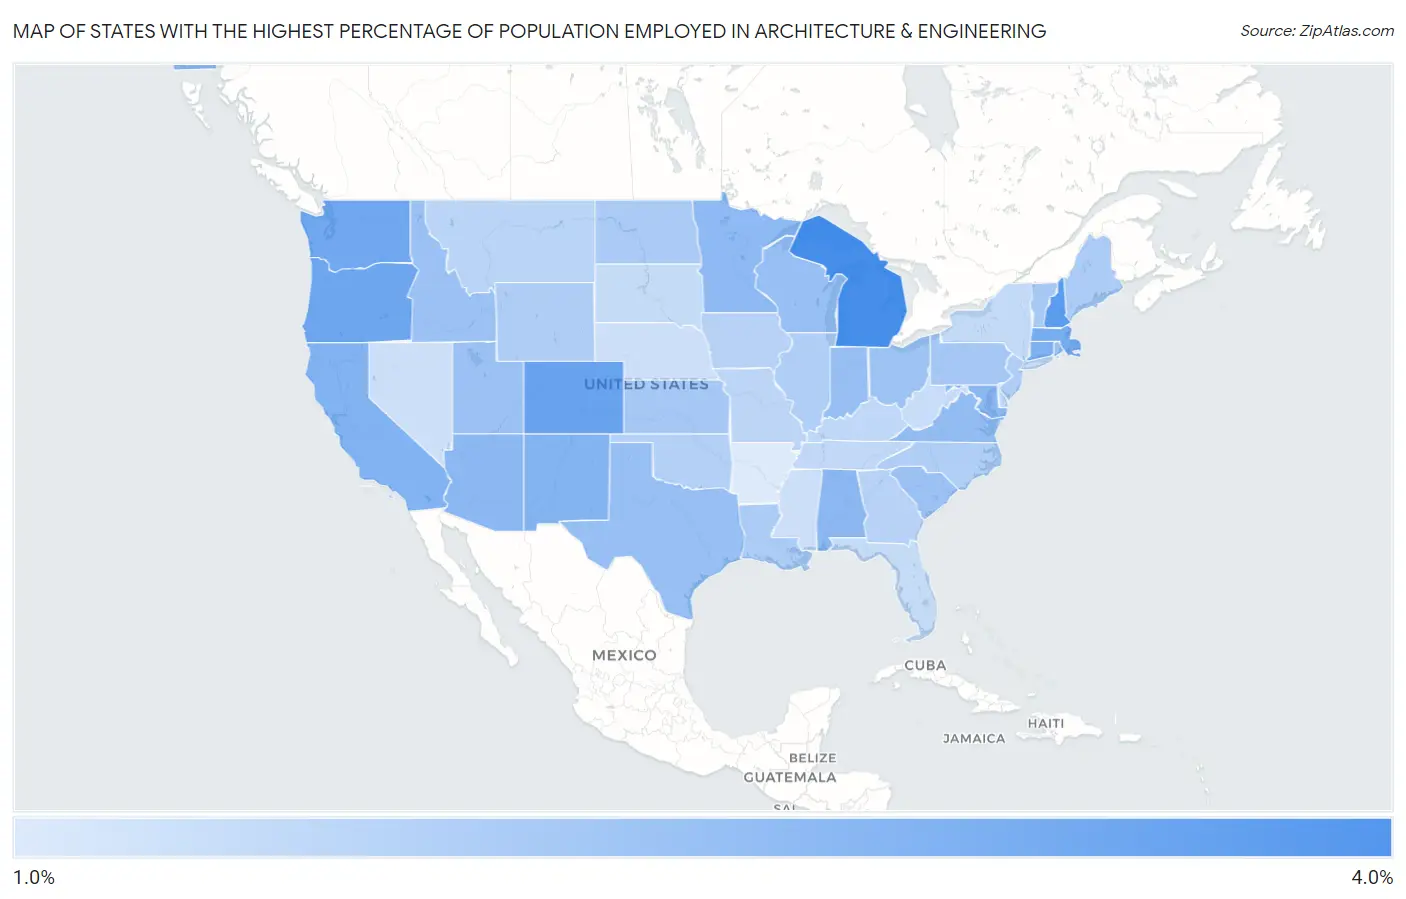
Map of States with the Highest Percentage of Population Employed in Architecture & Engineering
1.0%
4.0%
States with the Highest Percentage of Population Employed in Architecture & Engineering in the United States
| State | % Employed | vs State Median | vs National | |
| 1. | Michigan | 3.4% | 2.0% (+1.35) | 2.1%(+1.22) |
| 2. | New Hampshire | 3.1% | 2.0% (+1.09) | 2.1%(+0.962) |
| 3. | Colorado | 2.9% | 2.0% (+0.900) | 2.1%(+0.772) |
| 4. | Oregon | 2.8% | 2.0% (+0.793) | 2.1%(+0.665) |
| 5. | Washington | 2.8% | 2.0% (+0.769) | 2.1%(+0.642) |
| 6. | Massachusetts | 2.7% | 2.0% (+0.652) | 2.1%(+0.524) |
| 7. | Connecticut | 2.6% | 2.0% (+0.554) | 2.1%(+0.427) |
| 8. | California | 2.6% | 2.0% (+0.532) | 2.1%(+0.405) |
| 9. | New Mexico | 2.5% | 2.0% (+0.495) | 2.1%(+0.367) |
| 10. | Alabama | 2.4% | 2.0% (+0.385) | 2.1%(+0.258) |
| 11. | Arizona | 2.4% | 2.0% (+0.370) | 2.1%(+0.242) |
| 12. | Maryland | 2.4% | 2.0% (+0.366) | 2.1%(+0.238) |
| 13. | Minnesota | 2.4% | 2.0% (+0.347) | 2.1%(+0.219) |
| 14. | Virginia | 2.3% | 2.0% (+0.283) | 2.1%(+0.156) |
| 15. | Alaska | 2.3% | 2.0% (+0.262) | 2.1%(+0.135) |
| 16. | Wisconsin | 2.2% | 2.0% (+0.222) | 2.1%(+0.094) |
| 17. | Texas | 2.2% | 2.0% (+0.200) | 2.1%(+0.073) |
| 18. | Indiana | 2.2% | 2.0% (+0.200) | 2.1%(+0.072) |
| 19. | South Carolina | 2.2% | 2.0% (+0.175) | 2.1%(+0.047) |
| 20. | Rhode Island | 2.2% | 2.0% (+0.166) | 2.1%(+0.039) |
| 21. | Idaho | 2.2% | 2.0% (+0.157) | 2.1%(+0.029) |
| 22. | Utah | 2.2% | 2.0% (+0.136) | 2.1%(+0.009) |
| 23. | Ohio | 2.1% | 2.0% (+0.112) | 2.1%(-0.015) |
| 24. | Kansas | 2.0% | 2.0% (+0.020) | 2.1%(-0.108) |
| 25. | Pennsylvania | 2.0% | 2.0% (+0.019) | 2.1%(-0.108) |
| 26. | Vermont | 2.0% | 2.0% (-0.019) | 2.1%(-0.147) |
| 27. | North Dakota | 2.0% | 2.0% (-0.042) | 2.1%(-0.170) |
| 28. | Louisiana | 1.9% | 2.0% (-0.081) | 2.1%(-0.208) |
| 29. | Maine | 1.9% | 2.0% (-0.084) | 2.1%(-0.211) |
| 30. | Wyoming | 1.9% | 2.0% (-0.095) | 2.1%(-0.222) |
| 31. | Illinois | 1.9% | 2.0% (-0.127) | 2.1%(-0.255) |
| 32. | New Jersey | 1.9% | 2.0% (-0.129) | 2.1%(-0.257) |
| 33. | North Carolina | 1.9% | 2.0% (-0.133) | 2.1%(-0.261) |
| 34. | Oklahoma | 1.8% | 2.0% (-0.184) | 2.1%(-0.311) |
| 35. | Georgia | 1.8% | 2.0% (-0.227) | 2.1%(-0.354) |
| 36. | Iowa | 1.8% | 2.0% (-0.238) | 2.1%(-0.366) |
| 37. | Montana | 1.8% | 2.0% (-0.268) | 2.1%(-0.395) |
| 38. | Hawaii | 1.7% | 2.0% (-0.272) | 2.1%(-0.399) |
| 39. | Missouri | 1.7% | 2.0% (-0.317) | 2.1%(-0.445) |
| 40. | Kentucky | 1.7% | 2.0% (-0.322) | 2.1%(-0.450) |
| 41. | Delaware | 1.7% | 2.0% (-0.332) | 2.1%(-0.459) |
| 42. | Tennessee | 1.7% | 2.0% (-0.354) | 2.1%(-0.481) |
| 43. | New York | 1.6% | 2.0% (-0.411) | 2.1%(-0.539) |
| 44. | Florida | 1.6% | 2.0% (-0.423) | 2.1%(-0.550) |
| 45. | South Dakota | 1.6% | 2.0% (-0.431) | 2.1%(-0.559) |
| 46. | West Virginia | 1.6% | 2.0% (-0.462) | 2.1%(-0.589) |
| 47. | Nebraska | 1.5% | 2.0% (-0.519) | 2.1%(-0.647) |
| 48. | Mississippi | 1.5% | 2.0% (-0.534) | 2.1%(-0.662) |
| 49. | Nevada | 1.5% | 2.0% (-0.537) | 2.1%(-0.664) |
| 50. | Arkansas | 1.3% | 2.0% (-0.751) | 2.1%(-0.878) |
1
Common Questions
What are the Top 10 States with the Highest Percentage of Population Employed in Architecture & Engineering in the United States?
Top 10 States with the Highest Percentage of Population Employed in Architecture & Engineering in the United States are:
#1
3.4%
#2
3.1%
#3
2.9%
#4
2.8%
#5
2.8%
#6
2.7%
#7
2.6%
#8
2.6%
#9
2.5%
#10
2.4%
What state has the Highest Percentage of Population Employed in Architecture & Engineering in the United States?
Michigan has the Highest Percentage of Population Employed in Architecture & Engineering in the United States with 3.4%.
What is the Percentage of Population Employed in Architecture & Engineering in the United States?
Percentage of Population Employed in Architecture & Engineering in the United States is 2.1%.