Immigrants from South America Disability Age Under 5
COMPARE
Immigrants from South America
Select to Compare
Disability Age Under 5
Immigrants from South America Disability Age Under 5
1.2%
DISABILITY | AGE UNDER 5
67.0/ 100
METRIC RATING
157th/ 347
METRIC RANK
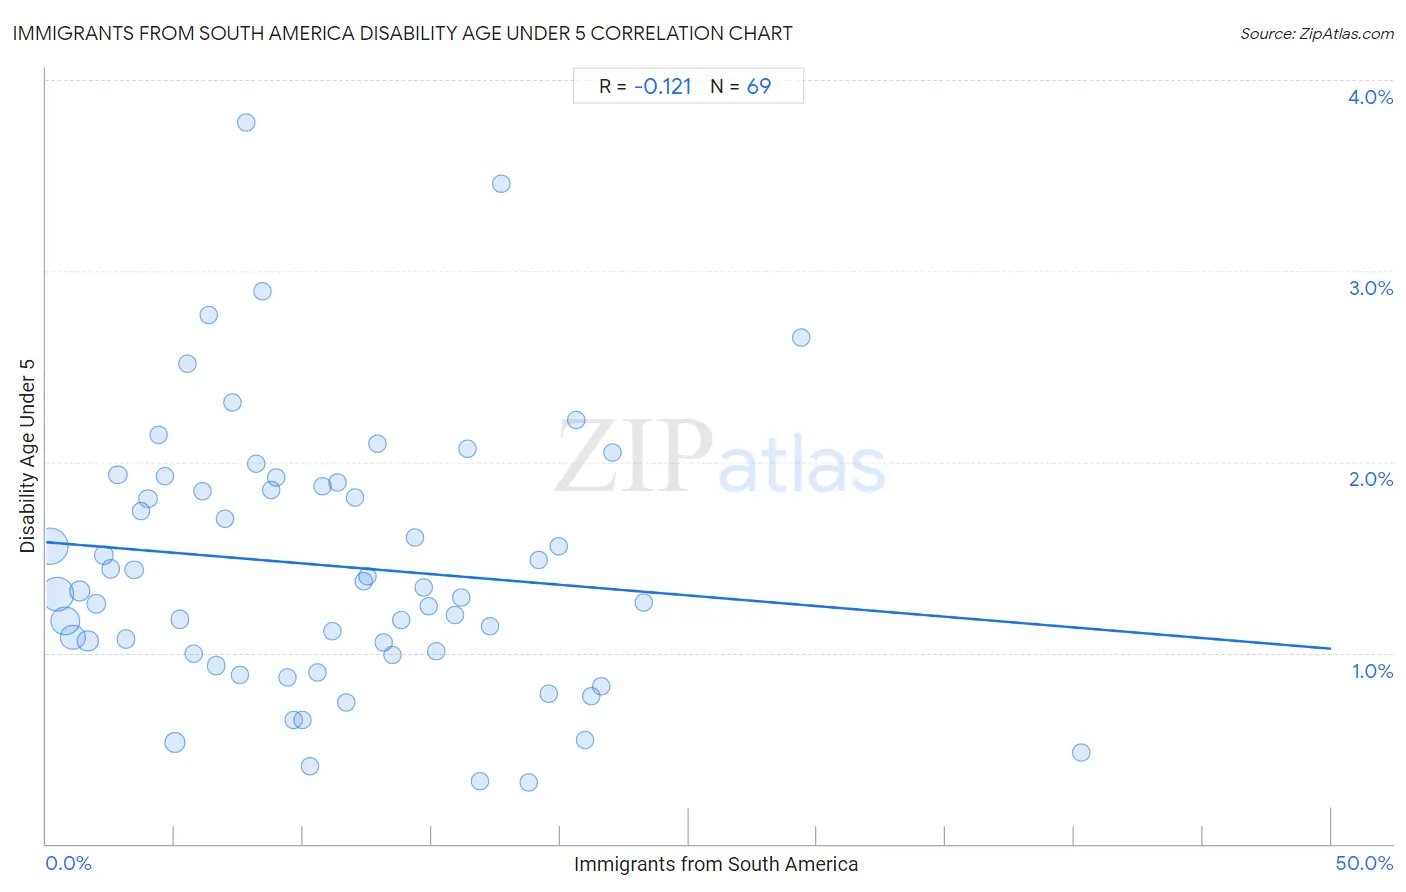
Immigrants from South America Disability Age Under 5 Correlation Chart
The statistical analysis conducted on geographies consisting of 244,519,101 people shows a poor negative correlation between the proportion of Immigrants from South America and percentage of population with a disability under the age of 5 in the United States with a correlation coefficient (R) of -0.121 and weighted average of 1.2%. On average, for every 1% (one percent) increase in Immigrants from South America within a typical geography, there is a decrease of 0.011% in percentage of population with a disability under the age of 5.
It is essential to understand that the correlation between the percentage of Immigrants from South America and percentage of population with a disability under the age of 5 does not imply a direct cause-and-effect relationship. It remains uncertain whether the presence of Immigrants from South America influences an upward or downward trend in the level of percentage of population with a disability under the age of 5 within an area, or if Immigrants from South America simply ended up residing in those areas with higher or lower levels of percentage of population with a disability under the age of 5 due to other factors.
Demographics Similar to Immigrants from South America by Disability Age Under 5
In terms of disability age under 5, the demographic groups most similar to Immigrants from South America are Arab (1.2%, a difference of 0.060%), Colombian (1.2%, a difference of 0.12%), Immigrants from Latin America (1.2%, a difference of 0.12%), Hawaiian (1.2%, a difference of 0.16%), and Immigrants from Ghana (1.2%, a difference of 0.18%).
| Demographics | Rating | Rank | Disability Age Under 5 |
| South Americans | 75.6 /100 | #150 | Good 1.2% |
| Yaqui | 74.8 /100 | #151 | Good 1.2% |
| Hondurans | 72.5 /100 | #152 | Good 1.2% |
| Immigrants from Thailand | 69.4 /100 | #153 | Good 1.2% |
| Uruguayans | 68.8 /100 | #154 | Good 1.2% |
| Immigrants from Ghana | 68.7 /100 | #155 | Good 1.2% |
| Hawaiians | 68.5 /100 | #156 | Good 1.2% |
| Immigrants from South America | 67.0 /100 | #157 | Good 1.2% |
| Arabs | 66.4 /100 | #158 | Good 1.2% |
| Colombians | 65.8 /100 | #159 | Good 1.2% |
| Immigrants from Latin America | 65.8 /100 | #160 | Good 1.2% |
| Immigrants from Africa | 65.1 /100 | #161 | Good 1.2% |
| Guatemalans | 63.6 /100 | #162 | Good 1.2% |
| Immigrants from Guatemala | 63.2 /100 | #163 | Good 1.2% |
| Laotians | 62.8 /100 | #164 | Good 1.2% |
Immigrants from South America Disability Age Under 5 Correlation Summary
| Measurement | Immigrants from South America Data | Disability Age Under 5 Data |
| Minimum | 0.16% | 0.32% |
| Maximum | 40.3% | 3.8% |
| Range | 40.1% | 3.5% |
| Mean | 11.1% | 1.5% |
| Median | 10.3% | 1.3% |
| Interquartile 25% (IQ1) | 5.1% | 0.99% |
| Interquartile 75% (IQ3) | 16.0% | 1.9% |
| Interquartile Range (IQR) | 10.9% | 0.89% |
| Standard Deviation (Sample) | 7.6% | 0.70% |
| Standard Deviation (Population) | 7.6% | 0.70% |
Correlation Details
| Immigrants from South America Percentile | Sample Size | Disability Age Under 5 |
[ 0.0% - 0.5% ] 0.16% | 66,663,820 | 1.6% |
[ 0.0% - 0.5% ] 0.43% | 55,043,205 | 1.3% |
[ 0.5% - 1.0% ] 0.74% | 37,942,715 | 1.2% |
[ 1.0% - 1.5% ] 1.04% | 23,827,577 | 1.1% |
[ 1.0% - 1.5% ] 1.29% | 10,978,087 | 1.3% |
[ 1.5% - 2.0% ] 1.63% | 11,004,801 | 1.1% |
[ 1.5% - 2.0% ] 1.94% | 4,209,771 | 1.3% |
[ 2.0% - 2.5% ] 2.24% | 3,580,428 | 1.5% |
[ 2.5% - 3.0% ] 2.51% | 3,786,224 | 1.4% |
[ 2.5% - 3.0% ] 2.79% | 1,624,915 | 1.9% |
[ 3.0% - 3.5% ] 3.11% | 2,164,374 | 1.1% |
[ 3.0% - 3.5% ] 3.42% | 1,399,925 | 1.4% |
[ 3.5% - 4.0% ] 3.69% | 1,364,045 | 1.7% |
[ 3.5% - 4.0% ] 3.96% | 950,023 | 1.8% |
[ 4.0% - 4.5% ] 4.37% | 969,556 | 2.1% |
[ 4.5% - 5.0% ] 4.64% | 638,287 | 1.9% |
[ 4.5% - 5.0% ] 4.99% | 9,152,394 | 0.53% |
[ 5.0% - 5.5% ] 5.22% | 905,689 | 1.2% |
[ 5.0% - 5.5% ] 5.47% | 339,649 | 2.5% |
[ 5.5% - 6.0% ] 5.74% | 376,753 | 1.00% |
[ 6.0% - 6.5% ] 6.06% | 188,967 | 1.8% |
[ 6.0% - 6.5% ] 6.33% | 108,507 | 2.8% |
[ 6.5% - 7.0% ] 6.63% | 458,377 | 0.93% |
[ 6.5% - 7.0% ] 6.98% | 245,152 | 1.7% |
[ 7.0% - 7.5% ] 7.25% | 308,150 | 2.3% |
[ 7.5% - 8.0% ] 7.54% | 474,707 | 0.88% |
[ 7.5% - 8.0% ] 7.78% | 85,332 | 3.8% |
[ 8.0% - 8.5% ] 8.18% | 294,102 | 2.0% |
[ 8.0% - 8.5% ] 8.43% | 176,057 | 2.9% |
[ 8.5% - 9.0% ] 8.76% | 265,447 | 1.9% |
[ 8.5% - 9.0% ] 8.94% | 123,847 | 1.9% |
[ 9.0% - 9.5% ] 9.41% | 376,214 | 0.87% |
[ 9.5% - 10.0% ] 9.65% | 157,864 | 0.65% |
[ 9.5% - 10.0% ] 9.98% | 306,391 | 0.65% |
[ 10.0% - 10.5% ] 10.26% | 164,942 | 0.41% |
[ 10.5% - 11.0% ] 10.54% | 296,106 | 0.90% |
[ 10.5% - 11.0% ] 10.75% | 97,439 | 1.9% |
[ 11.0% - 11.5% ] 11.13% | 659,058 | 1.1% |
[ 11.0% - 11.5% ] 11.35% | 27,928 | 1.9% |
[ 11.5% - 12.0% ] 11.67% | 60,600 | 0.74% |
[ 12.0% - 12.5% ] 12.02% | 34,335 | 1.8% |
[ 12.0% - 12.5% ] 12.33% | 98,672 | 1.4% |
[ 12.5% - 13.0% ] 12.52% | 38,935 | 1.4% |
[ 12.5% - 13.0% ] 12.90% | 373,324 | 2.1% |
[ 13.0% - 13.5% ] 13.14% | 370,229 | 1.1% |
[ 13.0% - 13.5% ] 13.46% | 257,177 | 0.99% |
[ 13.5% - 14.0% ] 13.80% | 16,939 | 1.2% |
[ 14.0% - 14.5% ] 14.34% | 70,535 | 1.6% |
[ 14.5% - 15.0% ] 14.70% | 156,519 | 1.3% |
[ 14.5% - 15.0% ] 14.89% | 153,335 | 1.2% |
[ 15.0% - 15.5% ] 15.16% | 41,102 | 1.0% |
[ 15.5% - 16.0% ] 15.92% | 120,385 | 1.2% |
[ 16.0% - 16.5% ] 16.16% | 61,832 | 1.3% |
[ 16.0% - 16.5% ] 16.37% | 70,737 | 2.1% |
[ 16.5% - 17.0% ] 16.88% | 102,618 | 0.33% |
[ 17.0% - 17.5% ] 17.26% | 23,708 | 1.1% |
[ 17.5% - 18.0% ] 17.73% | 33,691 | 3.5% |
[ 18.5% - 19.0% ] 18.76% | 26,548 | 0.32% |
[ 19.0% - 19.5% ] 19.18% | 107,541 | 1.5% |
[ 19.5% - 20.0% ] 19.57% | 49,890 | 0.79% |
[ 19.5% - 20.0% ] 19.94% | 45,694 | 1.6% |
[ 20.5% - 21.0% ] 20.63% | 87,660 | 2.2% |
[ 20.5% - 21.0% ] 20.95% | 18,426 | 0.54% |
[ 21.0% - 21.5% ] 21.20% | 17,178 | 0.77% |
[ 21.5% - 22.0% ] 21.60% | 112,750 | 0.82% |
[ 22.0% - 22.5% ] 22.01% | 67,001 | 2.0% |
[ 23.0% - 23.5% ] 23.23% | 57,066 | 1.3% |
[ 29.0% - 29.5% ] 29.39% | 51,153 | 2.7% |
[ 40.0% - 40.5% ] 40.26% | 56,696 | 0.48% |