Immigrants from Nepal Disability Age Under 5

COMPARE

Immigrants from Nepal
Race
Ancestry
AfghanAfricanAlaska NativeAlaskan AthabascanAlbanianAleutAlsatianAmericanApacheArabArapahoArgentineanArmenianAssyrian/Chaldean/SyriacAustralianAustrianBahamianBangladeshiBarbadianBasqueBelgianBelizeanBermudanBhutaneseBlackfeetBolivianBrazilianBritishBritish West IndianBulgarianBurmeseCajunCambodianCanadianCape VerdeanCarpatho RusynCelticCentral AmericanCentral American IndianCherokeeCheyenneChickasawChileanChineseChippewaChoctawColombianColvilleComancheCosta RicanCreeCreekCroatianCrowCubanCypriotCzechCzechoslovakianDanishDelawareDominicanDutchDutch West IndianEastern EuropeanEcuadorianEgyptianEnglishEstonianEthiopianEuropeanFijianFilipinoFinnishFrenchFrench American IndianFrench CanadianGermanGerman RussianGhanaianGreekGuamanian/ChamorroGuatemalanGuyaneseHaitianHmongHonduranHopiHoumaHungarianIcelanderIndian (Asian)IndonesianInupiatIranianIraqiIrishIroquoisIsraeliItalianJamaicanJapaneseJordanianKenyanKiowaKoreanLaotianLatvianLebaneseLiberianLithuanianLumbeeLuxembourgerMacedonianMalaysianMalteseMarshalleseMenomineeMexicanMexican American IndianMongolianMoroccanNative HawaiianNavajoNepaleseNew ZealanderNicaraguanNigerianNorthern EuropeanNorwegianOkinawanOsageOttawaPaiutePakistaniPalestinianPanamanianParaguayanPennsylvania GermanPeruvianPimaPolishPortuguesePotawatomiPuebloPuerto RicanPuget Sound SalishRomanianRussianSalvadoranSamoanScandinavianScotch-IrishScottishSeminoleSenegaleseSerbianShoshoneSierra LeoneanSiouxSlavicSlovakSloveneSomaliSouth AfricanSouth AmericanSouth American IndianSoviet UnionSpaniardSpanishSpanish AmericanSpanish American IndianSri LankanSubsaharan AfricanSudaneseSwedishSwissSyrianTaiwaneseThaiTlingit-HaidaTohono O'OdhamTonganTrinidadian and TobagonianTsimshianTurkishU.S. Virgin IslanderUgandanUkrainianUruguayanUteVenezuelanVietnameseWelshWest IndianYakamaYaquiYugoslavianYumanYup'ikZimbabwean
Immigration
NonimmigrantsImmigrantsAfghanistanAfricaAlbaniaArgentinaArmeniaAsiaAustraliaAustriaBahamasBangladeshBarbadosBelarusBelgiumBelizeBoliviaBosnia and HerzegovinaBrazilBulgariaBurma/MyanmarCabo VerdeCambodiaCameroonCanadaCaribbeanCentral AmericaChileChinaColombiaCongoCosta RicaCroatiaCubaCzechoslovakiaDenmarkDominicaDominican RepublicEastern AfricaEastern AsiaEastern EuropeEcuadorEgyptEl SalvadorEnglandEritreaEthiopiaEuropeFijiFranceGermanyGhanaGreeceGrenadaGuatemalaGuyanaHaitiHondurasHong KongHungaryIndiaIndonesiaIranIraqIrelandIsraelItalyJamaicaJapanJordanKazakhstanKenyaKoreaKuwaitLaosLatin AmericaLatviaLebanonLiberiaLithuaniaMalaysiaMexicoMicronesiaMiddle AfricaMoldovaMoroccoNepalNetherlandsNicaraguaNigeriaNorth AmericaNorth MacedoniaNorthern AfricaNorthern EuropeNorwayOceaniaPakistanPanamaPeruPhilippinesPolandPortugalRomaniaRussiaSaudi ArabiaScotlandSenegalSerbiaSierra LeoneSingaporeSomaliaSouth AfricaSouth AmericaSouth Central AsiaSouth Eastern AsiaSouthern EuropeSpainSri LankaSt. Vincent and the GrenadinesSudanSwedenSwitzerlandSyriaTaiwanThailandTrinidad and TobagoTurkeyUgandaUkraineUruguayUzbekistanVenezuelaVietnamWest IndiesWestern AfricaWestern AsiaWestern EuropeYemenZaireZimbabweAzores
Select to Compare
Race
Ancestry
AfghanAfricanAlaska NativeAlaskan AthabascanAlbanianAleutAlsatianAmericanApacheArabArapahoArgentineanArmenianAssyrian/Chaldean/SyriacAustralianAustrianBahamianBangladeshiBarbadianBasqueBelgianBelizeanBermudanBhutaneseBlackfeetBolivianBrazilianBritishBritish West IndianBulgarianBurmeseCajunCambodianCanadianCape VerdeanCarpatho RusynCelticCentral AmericanCentral American IndianCherokeeCheyenneChickasawChileanChineseChippewaChoctawColombianColvilleComancheCosta RicanCreeCreekCroatianCrowCubanCypriotCzechCzechoslovakianDanishDelawareDominicanDutchDutch West IndianEastern EuropeanEcuadorianEgyptianEnglishEstonianEthiopianEuropeanFijianFilipinoFinnishFrenchFrench American IndianFrench CanadianGermanGerman RussianGhanaianGreekGuamanian/ChamorroGuatemalanGuyaneseHaitianHmongHonduranHopiHoumaHungarianIcelanderIndian (Asian)IndonesianInupiatIranianIraqiIrishIroquoisIsraeliItalianJamaicanJapaneseJordanianKenyanKiowaKoreanLaotianLatvianLebaneseLiberianLithuanianLumbeeLuxembourgerMacedonianMalaysianMalteseMarshalleseMenomineeMexicanMexican American IndianMongolianMoroccanNative HawaiianNavajoNepaleseNew ZealanderNicaraguanNigerianNorthern EuropeanNorwegianOkinawanOsageOttawaPaiutePakistaniPalestinianPanamanianParaguayanPennsylvania GermanPeruvianPimaPolishPortuguesePotawatomiPuebloPuerto RicanPuget Sound SalishRomanianRussianSalvadoranSamoanScandinavianScotch-IrishScottishSeminoleSenegaleseSerbianShoshoneSierra LeoneanSiouxSlavicSlovakSloveneSomaliSouth AfricanSouth AmericanSouth American IndianSoviet UnionSpaniardSpanishSpanish AmericanSpanish American IndianSri LankanSubsaharan AfricanSudaneseSwedishSwissSyrianTaiwaneseThaiTlingit-HaidaTohono O'OdhamTonganTrinidadian and TobagonianTsimshianTurkishU.S. Virgin IslanderUgandanUkrainianUruguayanUteVenezuelanVietnameseWelshWest IndianYakamaYaquiYugoslavianYumanYup'ikZimbabwean
Immigration
NonimmigrantsImmigrantsAfghanistanAfricaAlbaniaArgentinaArmeniaAsiaAustraliaAustriaBahamasBangladeshBarbadosBelarusBelgiumBelizeBoliviaBosnia and HerzegovinaBrazilBulgariaBurma/MyanmarCabo VerdeCambodiaCameroonCanadaCaribbeanCentral AmericaChileChinaColombiaCongoCosta RicaCroatiaCubaCzechoslovakiaDenmarkDominicaDominican RepublicEastern AfricaEastern AsiaEastern EuropeEcuadorEgyptEl SalvadorEnglandEritreaEthiopiaEuropeFijiFranceGermanyGhanaGreeceGrenadaGuatemalaGuyanaHaitiHondurasHong KongHungaryIndiaIndonesiaIranIraqIrelandIsraelItalyJamaicaJapanJordanKazakhstanKenyaKoreaKuwaitLaosLatin AmericaLatviaLebanonLiberiaLithuaniaMalaysiaMexicoMicronesiaMiddle AfricaMoldovaMoroccoNetherlandsNicaraguaNigeriaNorth AmericaNorth MacedoniaNorthern AfricaNorthern EuropeNorwayOceaniaPakistanPanamaPeruPhilippinesPolandPortugalRomaniaRussiaSaudi ArabiaScotlandSenegalSerbiaSierra LeoneSingaporeSomaliaSouth AfricaSouth AmericaSouth Central AsiaSouth Eastern AsiaSouthern EuropeSpainSri LankaSt. Vincent and the GrenadinesSudanSwedenSwitzerlandSyriaTaiwanThailandTrinidad and TobagoTurkeyUgandaUkraineUruguayUzbekistanVenezuelaVietnamWest IndiesWestern AfricaWestern AsiaWestern EuropeYemenZaireZimbabweAzores
Disability Age Under 5
Income
Poverty
Unemployment
Labor Participation
Family Structure
Vehicle Availability
Education Level
Disability

Immigrants from Nepal Disability Age Under 5
Exceptional

1.0%
DISABILITY | AGE UNDER 5
99.9/ 100
METRIC RATING
36th/ 347
METRIC RANK

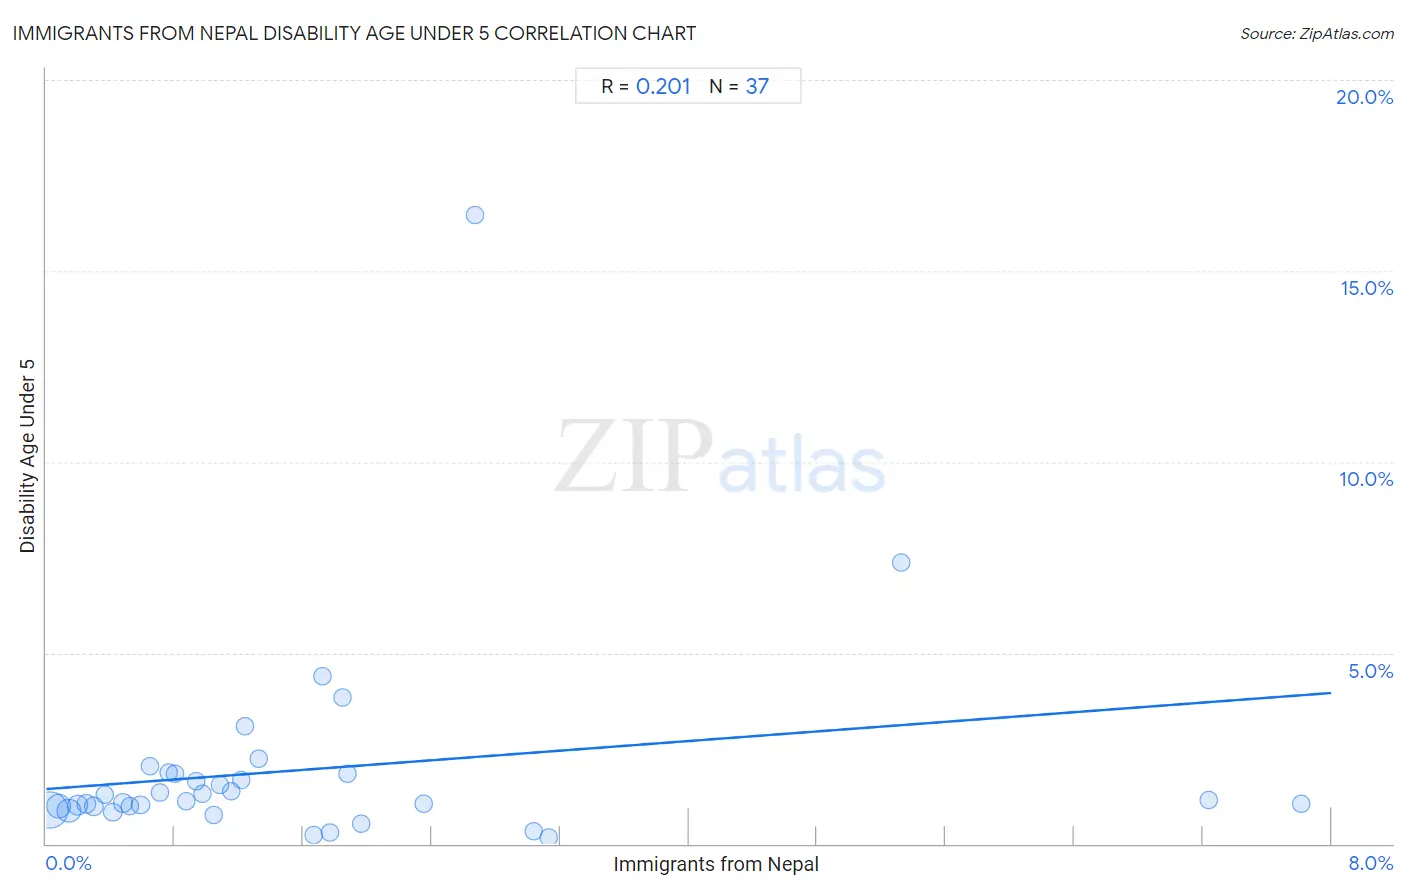
Immigrants from Nepal Disability Age Under 5 Correlation Chart

The statistical analysis conducted on geographies consisting of 121,153,865 people shows a weak positive correlation between the proportion of Immigrants from Nepal and percentage of population with a disability under the age of 5 in the United States with a correlation coefficient (R) of 0.201 and weighted average of 1.0%. On average, for every 1% (one percent) increase in Immigrants from Nepal within a typical geography, there is an increase of 0.31% in percentage of population with a disability under the age of 5.
Immigrants from Nepal Disability Age Under 5
It is essential to understand that the correlation between the percentage of Immigrants from Nepal and percentage of population with a disability under the age of 5 does not imply a direct cause-and-effect relationship. It remains uncertain whether the presence of Immigrants from Nepal influences an upward or downward trend in the level of percentage of population with a disability under the age of 5 within an area, or if Immigrants from Nepal simply ended up residing in those areas with higher or lower levels of percentage of population with a disability under the age of 5 due to other factors.

Demographics Similar to Immigrants from Nepal by Disability Age Under 5

In terms of disability age under 5, the demographic groups most similar to Immigrants from Nepal are Immigrants from India (1.0%, a difference of 0.020%), Immigrants from Guyana (1.0%, a difference of 0.11%), Barbadian (1.0%, a difference of 0.71%), Filipino (1.1%, a difference of 0.78%), and Immigrants from Ukraine (1.0%, a difference of 0.95%).
DemographicsRating | RankDisability Age Under 5
Immigrants from Belarus
100.0
/100
|
#29
Exceptional
1.0%
Immigrants from South Central Asia
99.9
/100
|
#30
Exceptional
1.0%
Armenians
99.9
/100
|
#31
Exceptional
1.0%
Iranians
99.9
/100
|
#32
Exceptional
1.0%
Bolivians
99.9
/100
|
#33
Exceptional
1.0%
Immigrants from Ukraine
99.9
/100
|
#34
Exceptional
1.0%
Barbadians
99.9
/100
|
#35
Exceptional
1.0%
Immigrants from Nepal
99.9
/100
|
#36
Exceptional
1.0%
Immigrants from India
99.9
/100
|
#37
Exceptional
1.0%
Immigrants from Guyana
99.9
/100
|
#38
Exceptional
1.0%
Filipinos
99.9
/100
|
#39
Exceptional
1.1%
Immigrants from Albania
99.9
/100
|
#40
Exceptional
1.1%
Thais
99.8
/100
|
#41
Exceptional
1.1%
Immigrants from Bulgaria
99.8
/100
|
#42
Exceptional
1.1%
Pima
99.8
/100
|
#43
Exceptional
1.1%

Immigrants from Nepal Disability Age Under 5 Correlation Summary

MeasurementImmigrants from Nepal DataDisability Age Under 5 Data
Minimum0.025%0.17%
Maximum7.8%16.5%
Range7.8%16.3%
Mean1.6%1.9%
Median1.0%1.1%
Interquartile 25% (IQ1)0.50%0.92%
Interquartile 75% (IQ3)1.9%1.8%
Interquartile Range (IQR)1.4%0.92%
Standard Deviation (Sample)1.8%2.8%
Standard Deviation (Population)1.8%2.8%

Correlation Details

Immigrants from Nepal PercentileSample SizeDisability Age Under 5
[
0.0%
-
0.5%
]
0.025%
59,192,6890.87%
[
0.0%
-
0.5%
]
0.079%
20,499,6250.97%
[
0.0%
-
0.5%
]
0.14%
18,973,9970.87%
[
0.0%
-
0.5%
]
0.20%
6,777,8611.0%
[
0.0%
-
0.5%
]
0.25%
3,372,6801.0%
[
0.0%
-
0.5%
]
0.30%
3,461,3010.97%
[
0.0%
-
0.5%
]
0.36%
1,620,9261.3%
[
0.0%
-
0.5%
]
0.41%
2,000,3120.83%
[
0.0%
-
0.5%
]
0.48%
807,9741.1%
[
0.5%
-
1.0%
]
0.52%
800,8640.98%
[
0.5%
-
1.0%
]
0.59%
548,0011.0%
[
0.5%
-
1.0%
]
0.65%
402,8062.0%
[
0.5%
-
1.0%
]
0.71%
247,7391.3%
[
0.5%
-
1.0%
]
0.76%
245,6951.9%
[
0.5%
-
1.0%
]
0.80%
360,9771.8%
[
0.5%
-
1.0%
]
0.87%
84,8171.1%
[
0.5%
-
1.0%
]
0.93%
114,6491.6%
[
0.5%
-
1.0%
]
0.97%
183,8651.3%
[
1.0%
-
1.5%
]
1.04%
118,7900.76%
[
1.0%
-
1.5%
]
1.08%
357,9021.5%
[
1.0%
-
1.5%
]
1.15%
169,1061.4%
[
1.0%
-
1.5%
]
1.21%
17,8431.7%
[
1.0%
-
1.5%
]
1.24%
112,6203.1%
[
1.0%
-
1.5%
]
1.32%
35,0552.2%
[
1.5%
-
2.0%
]
1.67%
29,2550.23%
[
1.5%
-
2.0%
]
1.72%
11,1994.4%
[
1.5%
-
2.0%
]
1.76%
45,2540.29%
[
1.5%
-
2.0%
]
1.84%
1,5723.8%
[
1.5%
-
2.0%
]
1.88%
58,9161.8%
[
1.5%
-
2.0%
]
1.96%
269,1660.51%
[
2.0%
-
2.5%
]
2.35%
27,1111.1%
[
2.5%
-
3.0%
]
2.67%
2,66116.5%
[
3.0%
-
3.5%
]
3.04%
102,6180.33%
[
3.0%
-
3.5%
]
3.13%
38,6320.17%
[
5.0%
-
5.5%
]
5.32%
1,9367.4%
[
7.0%
-
7.5%
]
7.24%
24,8921.2%
[
7.5%
-
8.0%
]
7.81%
32,5591.1%