British West Indian Disability Age Under 5
COMPARE
British West Indian
Select to Compare
Disability Age Under 5
British West Indian Disability Age Under 5
0.99%
DISABILITY | AGE UNDER 5
100.0/ 100
METRIC RATING
21st/ 347
METRIC RANK
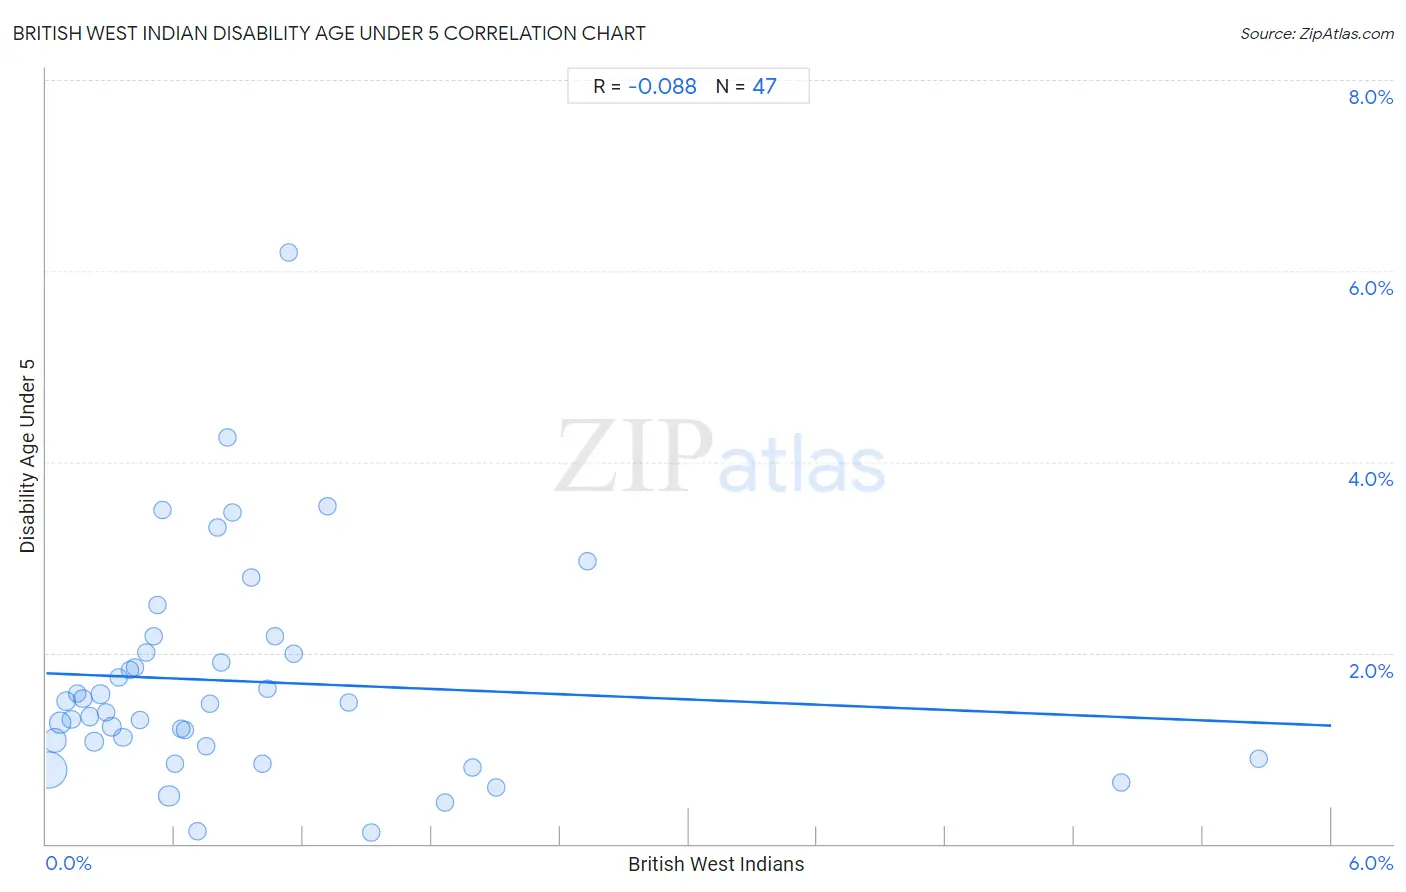
British West Indian Disability Age Under 5 Correlation Chart
The statistical analysis conducted on geographies consisting of 105,175,944 people shows a slight negative correlation between the proportion of British West Indians and percentage of population with a disability under the age of 5 in the United States with a correlation coefficient (R) of -0.088 and weighted average of 0.99%. On average, for every 1% (one percent) increase in British West Indians within a typical geography, there is a decrease of 0.091% in percentage of population with a disability under the age of 5.
It is essential to understand that the correlation between the percentage of British West Indians and percentage of population with a disability under the age of 5 does not imply a direct cause-and-effect relationship. It remains uncertain whether the presence of British West Indians influences an upward or downward trend in the level of percentage of population with a disability under the age of 5 within an area, or if British West Indians simply ended up residing in those areas with higher or lower levels of percentage of population with a disability under the age of 5 due to other factors.
Demographics Similar to British West Indians by Disability Age Under 5
In terms of disability age under 5, the demographic groups most similar to British West Indians are Immigrants from Iran (1.00%, a difference of 0.79%), Yakama (1.00%, a difference of 0.87%), Indian (Asian) (1.0%, a difference of 1.1%), Immigrants from Micronesia (1.0%, a difference of 1.5%), and Immigrants from Taiwan (1.0%, a difference of 1.6%).
| Demographics | Rating | Rank | Disability Age Under 5 |
| Yuman | 100.0 /100 | #14 | Exceptional 0.95% |
| Immigrants from Hong Kong | 100.0 /100 | #15 | Exceptional 0.95% |
| Immigrants from Israel | 100.0 /100 | #16 | Exceptional 0.96% |
| Immigrants from China | 100.0 /100 | #17 | Exceptional 0.96% |
| Immigrants from Barbados | 100.0 /100 | #18 | Exceptional 0.97% |
| Puget Sound Salish | 100.0 /100 | #19 | Exceptional 0.97% |
| Nepalese | 100.0 /100 | #20 | Exceptional 0.97% |
| British West Indians | 100.0 /100 | #21 | Exceptional 0.99% |
| Immigrants from Iran | 100.0 /100 | #22 | Exceptional 1.00% |
| Yakama | 100.0 /100 | #23 | Exceptional 1.00% |
| Indians (Asian) | 100.0 /100 | #24 | Exceptional 1.0% |
| Immigrants from Micronesia | 100.0 /100 | #25 | Exceptional 1.0% |
| Immigrants from Taiwan | 100.0 /100 | #26 | Exceptional 1.0% |
| Guyanese | 100.0 /100 | #27 | Exceptional 1.0% |
| Immigrants from Eastern Asia | 100.0 /100 | #28 | Exceptional 1.0% |
British West Indian Disability Age Under 5 Correlation Summary
| Measurement | British West Indian Data | Disability Age Under 5 Data |
| Minimum | 0.011% | 0.12% |
| Maximum | 5.7% | 6.2% |
| Range | 5.6% | 6.1% |
| Mean | 0.93% | 1.7% |
| Median | 0.63% | 1.5% |
| Interquartile 25% (IQ1) | 0.31% | 1.0% |
| Interquartile 75% (IQ3) | 1.1% | 2.0% |
| Interquartile Range (IQR) | 0.76% | 0.98% |
| Standard Deviation (Sample) | 1.1% | 1.1% |
| Standard Deviation (Population) | 1.1% | 1.1% |
Correlation Details
| British West Indian Percentile | Sample Size | Disability Age Under 5 |
[ 0.0% - 0.5% ] 0.011% | 52,659,907 | 0.78% |
[ 0.0% - 0.5% ] 0.039% | 15,138,342 | 1.1% |
[ 0.0% - 0.5% ] 0.065% | 9,482,831 | 1.3% |
[ 0.0% - 0.5% ] 0.092% | 4,017,446 | 1.5% |
[ 0.0% - 0.5% ] 0.12% | 3,169,415 | 1.3% |
[ 0.0% - 0.5% ] 0.15% | 1,280,671 | 1.6% |
[ 0.0% - 0.5% ] 0.17% | 1,072,837 | 1.5% |
[ 0.0% - 0.5% ] 0.20% | 1,534,241 | 1.3% |
[ 0.0% - 0.5% ] 0.22% | 1,093,625 | 1.1% |
[ 0.0% - 0.5% ] 0.25% | 1,028,846 | 1.6% |
[ 0.0% - 0.5% ] 0.28% | 749,361 | 1.4% |
[ 0.0% - 0.5% ] 0.31% | 622,978 | 1.2% |
[ 0.0% - 0.5% ] 0.34% | 369,429 | 1.7% |
[ 0.0% - 0.5% ] 0.36% | 1,041,884 | 1.1% |
[ 0.0% - 0.5% ] 0.39% | 390,950 | 1.8% |
[ 0.0% - 0.5% ] 0.42% | 332,112 | 1.8% |
[ 0.0% - 0.5% ] 0.44% | 90,573 | 1.3% |
[ 0.0% - 0.5% ] 0.47% | 170,401 | 2.0% |
[ 0.5% - 1.0% ] 0.50% | 141,554 | 2.2% |
[ 0.5% - 1.0% ] 0.52% | 33,544 | 2.5% |
[ 0.5% - 1.0% ] 0.54% | 89,530 | 3.5% |
[ 0.5% - 1.0% ] 0.57% | 8,721,924 | 0.50% |
[ 0.5% - 1.0% ] 0.60% | 133,340 | 0.83% |
[ 0.5% - 1.0% ] 0.63% | 95,843 | 1.2% |
[ 0.5% - 1.0% ] 0.65% | 143,234 | 1.2% |
[ 0.5% - 1.0% ] 0.70% | 126,930 | 0.13% |
[ 0.5% - 1.0% ] 0.75% | 263,282 | 1.0% |
[ 0.5% - 1.0% ] 0.76% | 41,073 | 1.5% |
[ 0.5% - 1.0% ] 0.80% | 59,852 | 3.3% |
[ 0.5% - 1.0% ] 0.81% | 101,166 | 1.9% |
[ 0.5% - 1.0% ] 0.85% | 46,861 | 4.3% |
[ 0.5% - 1.0% ] 0.87% | 74,028 | 3.5% |
[ 0.5% - 1.0% ] 0.96% | 52,292 | 2.8% |
[ 1.0% - 1.5% ] 1.01% | 104,294 | 0.84% |
[ 1.0% - 1.5% ] 1.04% | 87,317 | 1.6% |
[ 1.0% - 1.5% ] 1.07% | 49,196 | 2.2% |
[ 1.0% - 1.5% ] 1.13% | 13,058 | 6.2% |
[ 1.0% - 1.5% ] 1.16% | 16,230 | 2.0% |
[ 1.0% - 1.5% ] 1.31% | 6,410 | 3.5% |
[ 1.0% - 1.5% ] 1.41% | 35,082 | 1.5% |
[ 1.5% - 2.0% ] 1.52% | 30,124 | 0.12% |
[ 1.5% - 2.0% ] 1.86% | 92,221 | 0.44% |
[ 1.5% - 2.0% ] 1.99% | 62,373 | 0.80% |
[ 2.0% - 2.5% ] 2.10% | 58,476 | 0.59% |
[ 2.5% - 3.0% ] 2.53% | 72,273 | 3.0% |
[ 5.0% - 5.5% ] 5.02% | 100,082 | 0.65% |
[ 5.5% - 6.0% ] 5.66% | 78,506 | 0.89% |