States with the Highest Percentage of Population Employed in Computer & Mathematics
RELATED REPORTS & OPTIONS
Computer & Mathematics
United States
Compare States
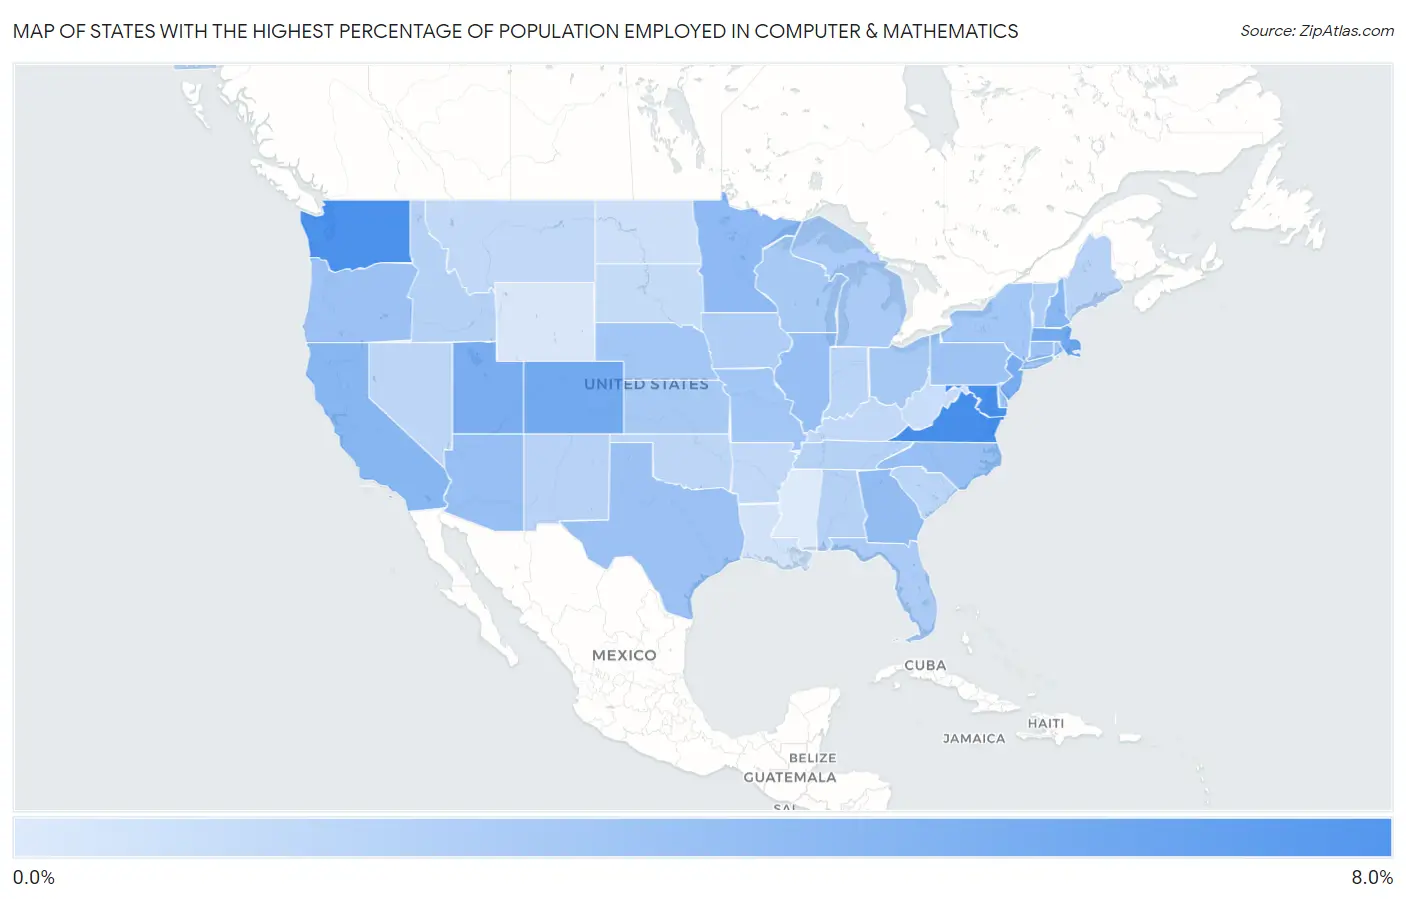
Map of States with the Highest Percentage of Population Employed in Computer & Mathematics
0.0%
8.0%
States with the Highest Percentage of Population Employed in Computer & Mathematics in the United States
| State | % Employed | vs State Median | vs National | |
| 1. | Virginia | 6.2% | 3.0% (+3.24) | 3.5%(+2.71) |
| 2. | Maryland | 6.1% | 3.0% (+3.14) | 3.5%(+2.61) |
| 3. | Washington | 6.1% | 3.0% (+3.06) | 3.5%(+2.53) |
| 4. | Massachusetts | 4.8% | 3.0% (+1.80) | 3.5%(+1.27) |
| 5. | Colorado | 4.8% | 3.0% (+1.76) | 3.5%(+1.23) |
| 6. | New Jersey | 4.5% | 3.0% (+1.53) | 3.5%(+1.00) |
| 7. | Utah | 4.5% | 3.0% (+1.52) | 3.5%(+0.992) |
| 8. | California | 4.1% | 3.0% (+1.11) | 3.5%(+0.577) |
| 9. | New Hampshire | 4.1% | 3.0% (+1.06) | 3.5%(+0.532) |
| 10. | Minnesota | 3.9% | 3.0% (+0.875) | 3.5%(+0.348) |
| 11. | Georgia | 3.7% | 3.0% (+0.659) | 3.5%(+0.132) |
| 12. | Illinois | 3.6% | 3.0% (+0.566) | 3.5%(+0.038) |
| 13. | Arizona | 3.6% | 3.0% (+0.560) | 3.5%(+0.032) |
| 14. | North Carolina | 3.5% | 3.0% (+0.550) | 3.5%(+0.023) |
| 15. | Oregon | 3.5% | 3.0% (+0.457) | 3.5%(-0.070) |
| 16. | Texas | 3.4% | 3.0% (+0.439) | 3.5%(-0.089) |
| 17. | Connecticut | 3.4% | 3.0% (+0.415) | 3.5%(-0.112) |
| 18. | Delaware | 3.4% | 3.0% (+0.357) | 3.5%(-0.170) |
| 19. | Pennsylvania | 3.3% | 3.0% (+0.280) | 3.5%(-0.248) |
| 20. | Missouri | 3.2% | 3.0% (+0.196) | 3.5%(-0.332) |
| 21. | Rhode Island | 3.2% | 3.0% (+0.190) | 3.5%(-0.338) |
| 22. | Nebraska | 3.2% | 3.0% (+0.167) | 3.5%(-0.361) |
| 23. | New York | 3.1% | 3.0% (+0.133) | 3.5%(-0.395) |
| 24. | Ohio | 3.0% | 3.0% (+0.037) | 3.5%(-0.491) |
| 25. | Wisconsin | 3.0% | 3.0% (+0.017) | 3.5%(-0.511) |
| 26. | Kansas | 3.0% | 3.0% (-0.017) | 3.5%(-0.545) |
| 27. | Michigan | 2.9% | 3.0% (-0.071) | 3.5%(-0.599) |
| 28. | Florida | 2.9% | 3.0% (-0.091) | 3.5%(-0.619) |
| 29. | Vermont | 2.8% | 3.0% (-0.209) | 3.5%(-0.737) |
| 30. | Iowa | 2.7% | 3.0% (-0.288) | 3.5%(-0.816) |
| 31. | Tennessee | 2.6% | 3.0% (-0.415) | 3.5%(-0.943) |
| 32. | Alabama | 2.5% | 3.0% (-0.453) | 3.5%(-0.981) |
| 33. | Idaho | 2.5% | 3.0% (-0.478) | 3.5%(-1.01) |
| 34. | Maine | 2.4% | 3.0% (-0.549) | 3.5%(-1.08) |
| 35. | New Mexico | 2.4% | 3.0% (-0.555) | 3.5%(-1.08) |
| 36. | South Carolina | 2.4% | 3.0% (-0.577) | 3.5%(-1.10) |
| 37. | Indiana | 2.4% | 3.0% (-0.583) | 3.5%(-1.11) |
| 38. | Nevada | 2.3% | 3.0% (-0.668) | 3.5%(-1.20) |
| 39. | Oklahoma | 2.3% | 3.0% (-0.671) | 3.5%(-1.20) |
| 40. | Hawaii | 2.3% | 3.0% (-0.684) | 3.5%(-1.21) |
| 41. | Montana | 2.2% | 3.0% (-0.822) | 3.5%(-1.35) |
| 42. | Kentucky | 2.2% | 3.0% (-0.833) | 3.5%(-1.36) |
| 43. | Arkansas | 2.2% | 3.0% (-0.839) | 3.5%(-1.37) |
| 44. | South Dakota | 2.0% | 3.0% (-0.983) | 3.5%(-1.51) |
| 45. | Alaska | 1.9% | 3.0% (-1.05) | 3.5%(-1.58) |
| 46. | West Virginia | 1.9% | 3.0% (-1.08) | 3.5%(-1.60) |
| 47. | North Dakota | 1.8% | 3.0% (-1.19) | 3.5%(-1.71) |
| 48. | Louisiana | 1.7% | 3.0% (-1.31) | 3.5%(-1.84) |
| 49. | Wyoming | 1.4% | 3.0% (-1.55) | 3.5%(-2.08) |
| 50. | Mississippi | 1.3% | 3.0% (-1.72) | 3.5%(-2.25) |
1
Common Questions
What are the Top 10 States with the Highest Percentage of Population Employed in Computer & Mathematics in the United States?
Top 10 States with the Highest Percentage of Population Employed in Computer & Mathematics in the United States are:
#1
6.2%
#2
6.1%
#3
6.1%
#4
4.8%
#5
4.8%
#6
4.5%
#7
4.5%
#8
4.1%
#9
4.1%
#10
3.9%
What state has the Highest Percentage of Population Employed in Computer & Mathematics in the United States?
Virginia has the Highest Percentage of Population Employed in Computer & Mathematics in the United States with 6.2%.
What is the Percentage of Population Employed in Computer & Mathematics in the United States?
Percentage of Population Employed in Computer & Mathematics in the United States is 3.5%.