Norwegian Disability Age Under 5
COMPARE
Norwegian
Select to Compare
Disability Age Under 5
Norwegian Disability Age Under 5
1.7%
DISABILITY | AGE UNDER 5
0.0/ 100
METRIC RATING
314th/ 347
METRIC RANK
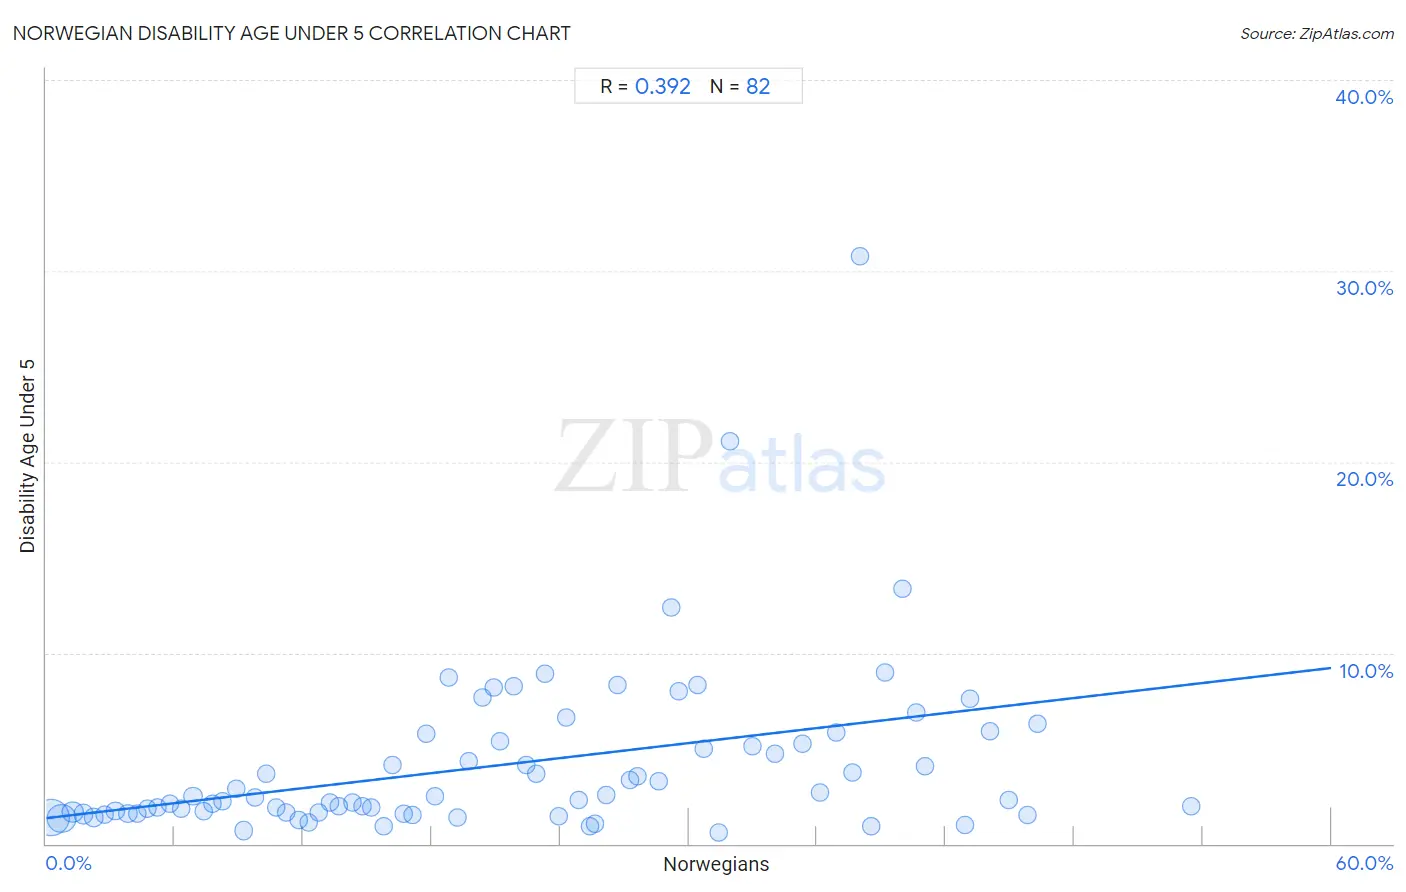
Norwegian Disability Age Under 5 Correlation Chart
The statistical analysis conducted on geographies consisting of 251,234,547 people shows a mild positive correlation between the proportion of Norwegians and percentage of population with a disability under the age of 5 in the United States with a correlation coefficient (R) of 0.392 and weighted average of 1.7%. On average, for every 1% (one percent) increase in Norwegians within a typical geography, there is an increase of 0.13% in percentage of population with a disability under the age of 5.
It is essential to understand that the correlation between the percentage of Norwegians and percentage of population with a disability under the age of 5 does not imply a direct cause-and-effect relationship. It remains uncertain whether the presence of Norwegians influences an upward or downward trend in the level of percentage of population with a disability under the age of 5 within an area, or if Norwegians simply ended up residing in those areas with higher or lower levels of percentage of population with a disability under the age of 5 due to other factors.
Demographics Similar to Norwegians by Disability Age Under 5
In terms of disability age under 5, the demographic groups most similar to Norwegians are Celtic (1.7%, a difference of 0.16%), Dutch (1.7%, a difference of 0.26%), Puerto Rican (1.7%, a difference of 0.32%), English (1.7%, a difference of 0.36%), and Immigrants from Cabo Verde (1.7%, a difference of 0.44%).
| Demographics | Rating | Rank | Disability Age Under 5 |
| Scottish | 0.0 /100 | #307 | Tragic 1.6% |
| Navajo | 0.0 /100 | #308 | Tragic 1.6% |
| Cape Verdeans | 0.0 /100 | #309 | Tragic 1.7% |
| Whites/Caucasians | 0.0 /100 | #310 | Tragic 1.7% |
| English | 0.0 /100 | #311 | Tragic 1.7% |
| Puerto Ricans | 0.0 /100 | #312 | Tragic 1.7% |
| Celtics | 0.0 /100 | #313 | Tragic 1.7% |
| Norwegians | 0.0 /100 | #314 | Tragic 1.7% |
| Dutch | 0.0 /100 | #315 | Tragic 1.7% |
| Immigrants from Cabo Verde | 0.0 /100 | #316 | Tragic 1.7% |
| French | 0.0 /100 | #317 | Tragic 1.7% |
| Irish | 0.0 /100 | #318 | Tragic 1.7% |
| Slovaks | 0.0 /100 | #319 | Tragic 1.7% |
| Scotch-Irish | 0.0 /100 | #320 | Tragic 1.7% |
| Ottawa | 0.0 /100 | #321 | Tragic 1.7% |
Norwegian Disability Age Under 5 Correlation Summary
| Measurement | Norwegian Data | Disability Age Under 5 Data |
| Minimum | 0.26% | 0.60% |
| Maximum | 53.5% | 30.8% |
| Range | 53.2% | 30.2% |
| Mean | 21.5% | 4.2% |
| Median | 20.6% | 2.4% |
| Interquartile 25% (IQ1) | 10.3% | 1.6% |
| Interquartile 75% (IQ3) | 31.4% | 5.4% |
| Interquartile Range (IQR) | 21.1% | 3.8% |
| Standard Deviation (Sample) | 13.5% | 4.5% |
| Standard Deviation (Population) | 13.4% | 4.5% |
Correlation Details
| Norwegian Percentile | Sample Size | Disability Age Under 5 |
[ 0.0% - 0.5% ] 0.26% | 119,056,135 | 1.4% |
[ 0.5% - 1.0% ] 0.71% | 67,159,164 | 1.3% |
[ 1.0% - 1.5% ] 1.23% | 21,366,892 | 1.7% |
[ 1.5% - 2.0% ] 1.73% | 12,072,611 | 1.5% |
[ 2.0% - 2.5% ] 2.24% | 8,014,707 | 1.3% |
[ 2.5% - 3.0% ] 2.73% | 4,668,332 | 1.5% |
[ 3.0% - 3.5% ] 3.23% | 3,393,285 | 1.7% |
[ 3.5% - 4.0% ] 3.82% | 2,880,743 | 1.6% |
[ 4.0% - 4.5% ] 4.25% | 2,119,747 | 1.6% |
[ 4.5% - 5.0% ] 4.73% | 1,247,580 | 1.8% |
[ 5.0% - 5.5% ] 5.18% | 567,615 | 1.9% |
[ 5.5% - 6.0% ] 5.75% | 596,747 | 2.1% |
[ 6.0% - 6.5% ] 6.32% | 932,500 | 1.9% |
[ 6.5% - 7.0% ] 6.86% | 920,305 | 2.5% |
[ 7.0% - 7.5% ] 7.33% | 347,746 | 1.7% |
[ 7.5% - 8.0% ] 7.75% | 328,985 | 2.1% |
[ 8.0% - 8.5% ] 8.21% | 329,057 | 2.3% |
[ 8.5% - 9.0% ] 8.86% | 101,299 | 2.9% |
[ 9.0% - 9.5% ] 9.19% | 539,204 | 0.69% |
[ 9.5% - 10.0% ] 9.72% | 360,023 | 2.4% |
[ 10.0% - 10.5% ] 10.25% | 145,423 | 3.7% |
[ 10.5% - 11.0% ] 10.74% | 365,060 | 1.9% |
[ 11.0% - 11.5% ] 11.21% | 419,401 | 1.7% |
[ 11.5% - 12.0% ] 11.81% | 338,423 | 1.3% |
[ 12.0% - 12.5% ] 12.28% | 489,860 | 1.1% |
[ 12.5% - 13.0% ] 12.75% | 238,383 | 1.6% |
[ 13.0% - 13.5% ] 13.23% | 193,596 | 2.2% |
[ 13.5% - 14.0% ] 13.67% | 237,248 | 1.9% |
[ 14.0% - 14.5% ] 14.31% | 226,652 | 2.2% |
[ 14.5% - 15.0% ] 14.75% | 153,241 | 2.0% |
[ 15.0% - 15.5% ] 15.17% | 137,652 | 1.9% |
[ 15.5% - 16.0% ] 15.74% | 215,745 | 0.91% |
[ 16.0% - 16.5% ] 16.16% | 52,346 | 4.1% |
[ 16.5% - 17.0% ] 16.68% | 221,915 | 1.6% |
[ 17.0% - 17.5% ] 17.13% | 88,771 | 1.5% |
[ 17.5% - 18.0% ] 17.74% | 17,098 | 5.7% |
[ 18.0% - 18.5% ] 18.14% | 38,651 | 2.5% |
[ 18.5% - 19.0% ] 18.79% | 23,603 | 8.7% |
[ 19.0% - 19.5% ] 19.19% | 39,553 | 1.4% |
[ 19.5% - 20.0% ] 19.72% | 22,039 | 4.3% |
[ 20.0% - 20.5% ] 20.35% | 11,418 | 7.6% |
[ 20.5% - 21.0% ] 20.90% | 818 | 8.2% |
[ 21.0% - 21.5% ] 21.20% | 38,788 | 5.4% |
[ 21.5% - 22.0% ] 21.85% | 11,206 | 8.2% |
[ 22.0% - 22.5% ] 22.43% | 31,190 | 4.1% |
[ 22.5% - 23.0% ] 22.86% | 32,365 | 3.6% |
[ 23.0% - 23.5% ] 23.26% | 2,429 | 8.9% |
[ 23.5% - 24.0% ] 23.94% | 3,877 | 1.4% |
[ 24.0% - 24.5% ] 24.31% | 3,213 | 6.6% |
[ 24.5% - 25.0% ] 24.85% | 27,955 | 2.3% |
[ 25.0% - 25.5% ] 25.41% | 19,428 | 0.89% |
[ 25.5% - 26.0% ] 25.61% | 186,254 | 1.1% |
[ 26.0% - 26.5% ] 26.16% | 47,468 | 2.6% |
[ 26.5% - 27.0% ] 26.66% | 2,468 | 8.3% |
[ 27.0% - 27.5% ] 27.25% | 53,011 | 3.3% |
[ 27.5% - 28.0% ] 27.62% | 16,777 | 3.5% |
[ 28.5% - 29.0% ] 28.63% | 4,527 | 3.3% |
[ 29.0% - 29.5% ] 29.19% | 8,165 | 12.3% |
[ 29.5% - 30.0% ] 29.52% | 166 | 8.0% |
[ 30.0% - 30.5% ] 30.41% | 901 | 8.3% |
[ 30.5% - 31.0% ] 30.68% | 4,465 | 5.0% |
[ 31.0% - 31.5% ] 31.39% | 7,419 | 0.60% |
[ 31.5% - 32.0% ] 31.90% | 279 | 21.1% |
[ 32.5% - 33.0% ] 32.99% | 10,190 | 5.1% |
[ 34.0% - 34.5% ] 34.03% | 5,325 | 4.7% |
[ 35.0% - 35.5% ] 35.33% | 2,358 | 5.2% |
[ 36.0% - 36.5% ] 36.11% | 12,317 | 2.7% |
[ 36.5% - 37.0% ] 36.89% | 618 | 5.8% |
[ 37.5% - 38.0% ] 37.63% | 2,761 | 3.7% |
[ 38.0% - 38.5% ] 38.01% | 171 | 30.8% |
[ 38.5% - 39.0% ] 38.54% | 1,915 | 0.94% |
[ 39.0% - 39.5% ] 39.16% | 2,505 | 9.0% |
[ 40.0% - 40.5% ] 40.00% | 440 | 13.3% |
[ 40.5% - 41.0% ] 40.62% | 256 | 6.9% |
[ 41.0% - 41.5% ] 41.01% | 2,275 | 4.0% |
[ 42.5% - 43.0% ] 42.88% | 3,734 | 1.00% |
[ 43.0% - 43.5% ] 43.13% | 1,521 | 7.6% |
[ 44.0% - 44.5% ] 44.04% | 277 | 5.9% |
[ 44.5% - 45.0% ] 44.95% | 3,052 | 2.3% |
[ 45.5% - 46.0% ] 45.83% | 1,006 | 1.5% |
[ 46.0% - 46.5% ] 46.30% | 1,242 | 6.3% |
[ 53.0% - 53.5% ] 53.48% | 660 | 2.0% |