Immigrants from Spain Disability Age Under 5

COMPARE

Immigrants from Spain
Race
Ancestry
AfghanAfricanAlaska NativeAlaskan AthabascanAlbanianAleutAlsatianAmericanApacheArabArapahoArgentineanArmenianAssyrian/Chaldean/SyriacAustralianAustrianBahamianBangladeshiBarbadianBasqueBelgianBelizeanBermudanBhutaneseBlackfeetBolivianBrazilianBritishBritish West IndianBulgarianBurmeseCajunCambodianCanadianCape VerdeanCarpatho RusynCelticCentral AmericanCentral American IndianCherokeeCheyenneChickasawChileanChineseChippewaChoctawColombianColvilleComancheCosta RicanCreeCreekCroatianCrowCubanCypriotCzechCzechoslovakianDanishDelawareDominicanDutchDutch West IndianEastern EuropeanEcuadorianEgyptianEnglishEstonianEthiopianEuropeanFijianFilipinoFinnishFrenchFrench American IndianFrench CanadianGermanGerman RussianGhanaianGreekGuamanian/ChamorroGuatemalanGuyaneseHaitianHmongHonduranHopiHoumaHungarianIcelanderIndian (Asian)IndonesianInupiatIranianIraqiIrishIroquoisIsraeliItalianJamaicanJapaneseJordanianKenyanKiowaKoreanLaotianLatvianLebaneseLiberianLithuanianLumbeeLuxembourgerMacedonianMalaysianMalteseMarshalleseMenomineeMexicanMexican American IndianMongolianMoroccanNative HawaiianNavajoNepaleseNew ZealanderNicaraguanNigerianNorthern EuropeanNorwegianOkinawanOsageOttawaPaiutePakistaniPalestinianPanamanianParaguayanPennsylvania GermanPeruvianPimaPolishPortuguesePotawatomiPuebloPuerto RicanPuget Sound SalishRomanianRussianSalvadoranSamoanScandinavianScotch-IrishScottishSeminoleSenegaleseSerbianShoshoneSierra LeoneanSiouxSlavicSlovakSloveneSomaliSouth AfricanSouth AmericanSouth American IndianSoviet UnionSpaniardSpanishSpanish AmericanSpanish American IndianSri LankanSubsaharan AfricanSudaneseSwedishSwissSyrianTaiwaneseThaiTlingit-HaidaTohono O'OdhamTonganTrinidadian and TobagonianTsimshianTurkishU.S. Virgin IslanderUgandanUkrainianUruguayanUteVenezuelanVietnameseWelshWest IndianYakamaYaquiYugoslavianYumanYup'ikZimbabwean
Immigration
NonimmigrantsImmigrantsAfghanistanAfricaAlbaniaArgentinaArmeniaAsiaAustraliaAustriaBahamasBangladeshBarbadosBelarusBelgiumBelizeBoliviaBosnia and HerzegovinaBrazilBulgariaBurma/MyanmarCabo VerdeCambodiaCameroonCanadaCaribbeanCentral AmericaChileChinaColombiaCongoCosta RicaCroatiaCubaCzechoslovakiaDenmarkDominicaDominican RepublicEastern AfricaEastern AsiaEastern EuropeEcuadorEgyptEl SalvadorEnglandEritreaEthiopiaEuropeFijiFranceGermanyGhanaGreeceGrenadaGuatemalaGuyanaHaitiHondurasHong KongHungaryIndiaIndonesiaIranIraqIrelandIsraelItalyJamaicaJapanJordanKazakhstanKenyaKoreaKuwaitLaosLatin AmericaLatviaLebanonLiberiaLithuaniaMalaysiaMexicoMicronesiaMiddle AfricaMoldovaMoroccoNepalNetherlandsNicaraguaNigeriaNorth AmericaNorth MacedoniaNorthern AfricaNorthern EuropeNorwayOceaniaPakistanPanamaPeruPhilippinesPolandPortugalRomaniaRussiaSaudi ArabiaScotlandSenegalSerbiaSierra LeoneSingaporeSomaliaSouth AfricaSouth AmericaSouth Central AsiaSouth Eastern AsiaSouthern EuropeSpainSri LankaSt. Vincent and the GrenadinesSudanSwedenSwitzerlandSyriaTaiwanThailandTrinidad and TobagoTurkeyUgandaUkraineUruguayUzbekistanVenezuelaVietnamWest IndiesWestern AfricaWestern AsiaWestern EuropeYemenZaireZimbabweAzores
Select to Compare
Race
Ancestry
AfghanAfricanAlaska NativeAlaskan AthabascanAlbanianAleutAlsatianAmericanApacheArabArapahoArgentineanArmenianAssyrian/Chaldean/SyriacAustralianAustrianBahamianBangladeshiBarbadianBasqueBelgianBelizeanBermudanBhutaneseBlackfeetBolivianBrazilianBritishBritish West IndianBulgarianBurmeseCajunCambodianCanadianCape VerdeanCarpatho RusynCelticCentral AmericanCentral American IndianCherokeeCheyenneChickasawChileanChineseChippewaChoctawColombianColvilleComancheCosta RicanCreeCreekCroatianCrowCubanCypriotCzechCzechoslovakianDanishDelawareDominicanDutchDutch West IndianEastern EuropeanEcuadorianEgyptianEnglishEstonianEthiopianEuropeanFijianFilipinoFinnishFrenchFrench American IndianFrench CanadianGermanGerman RussianGhanaianGreekGuamanian/ChamorroGuatemalanGuyaneseHaitianHmongHonduranHopiHoumaHungarianIcelanderIndian (Asian)IndonesianInupiatIranianIraqiIrishIroquoisIsraeliItalianJamaicanJapaneseJordanianKenyanKiowaKoreanLaotianLatvianLebaneseLiberianLithuanianLumbeeLuxembourgerMacedonianMalaysianMalteseMarshalleseMenomineeMexicanMexican American IndianMongolianMoroccanNative HawaiianNavajoNepaleseNew ZealanderNicaraguanNigerianNorthern EuropeanNorwegianOkinawanOsageOttawaPaiutePakistaniPalestinianPanamanianParaguayanPennsylvania GermanPeruvianPimaPolishPortuguesePotawatomiPuebloPuerto RicanPuget Sound SalishRomanianRussianSalvadoranSamoanScandinavianScotch-IrishScottishSeminoleSenegaleseSerbianShoshoneSierra LeoneanSiouxSlavicSlovakSloveneSomaliSouth AfricanSouth AmericanSouth American IndianSoviet UnionSpaniardSpanishSpanish AmericanSpanish American IndianSri LankanSubsaharan AfricanSudaneseSwedishSwissSyrianTaiwaneseThaiTlingit-HaidaTohono O'OdhamTonganTrinidadian and TobagonianTsimshianTurkishU.S. Virgin IslanderUgandanUkrainianUruguayanUteVenezuelanVietnameseWelshWest IndianYakamaYaquiYugoslavianYumanYup'ikZimbabwean
Immigration
NonimmigrantsImmigrantsAfghanistanAfricaAlbaniaArgentinaArmeniaAsiaAustraliaAustriaBahamasBangladeshBarbadosBelarusBelgiumBelizeBoliviaBosnia and HerzegovinaBrazilBulgariaBurma/MyanmarCabo VerdeCambodiaCameroonCanadaCaribbeanCentral AmericaChileChinaColombiaCongoCosta RicaCroatiaCubaCzechoslovakiaDenmarkDominicaDominican RepublicEastern AfricaEastern AsiaEastern EuropeEcuadorEgyptEl SalvadorEnglandEritreaEthiopiaEuropeFijiFranceGermanyGhanaGreeceGrenadaGuatemalaGuyanaHaitiHondurasHong KongHungaryIndiaIndonesiaIranIraqIrelandIsraelItalyJamaicaJapanJordanKazakhstanKenyaKoreaKuwaitLaosLatin AmericaLatviaLebanonLiberiaLithuaniaMalaysiaMexicoMicronesiaMiddle AfricaMoldovaMoroccoNepalNetherlandsNicaraguaNigeriaNorth AmericaNorth MacedoniaNorthern AfricaNorthern EuropeNorwayOceaniaPakistanPanamaPeruPhilippinesPolandPortugalRomaniaRussiaSaudi ArabiaScotlandSenegalSerbiaSierra LeoneSingaporeSomaliaSouth AfricaSouth AmericaSouth Central AsiaSouth Eastern AsiaSouthern EuropeSri LankaSt. Vincent and the GrenadinesSudanSwedenSwitzerlandSyriaTaiwanThailandTrinidad and TobagoTurkeyUgandaUkraineUruguayUzbekistanVenezuelaVietnamWest IndiesWestern AfricaWestern AsiaWestern EuropeYemenZaireZimbabweAzores
Disability Age Under 5
Income
Poverty
Unemployment
Labor Participation
Family Structure
Vehicle Availability
Education Level
Disability

Immigrants from Spain Disability Age Under 5
Excellent

1.2%
DISABILITY | AGE UNDER 5
86.5/ 100
METRIC RATING
133rd/ 347
METRIC RANK

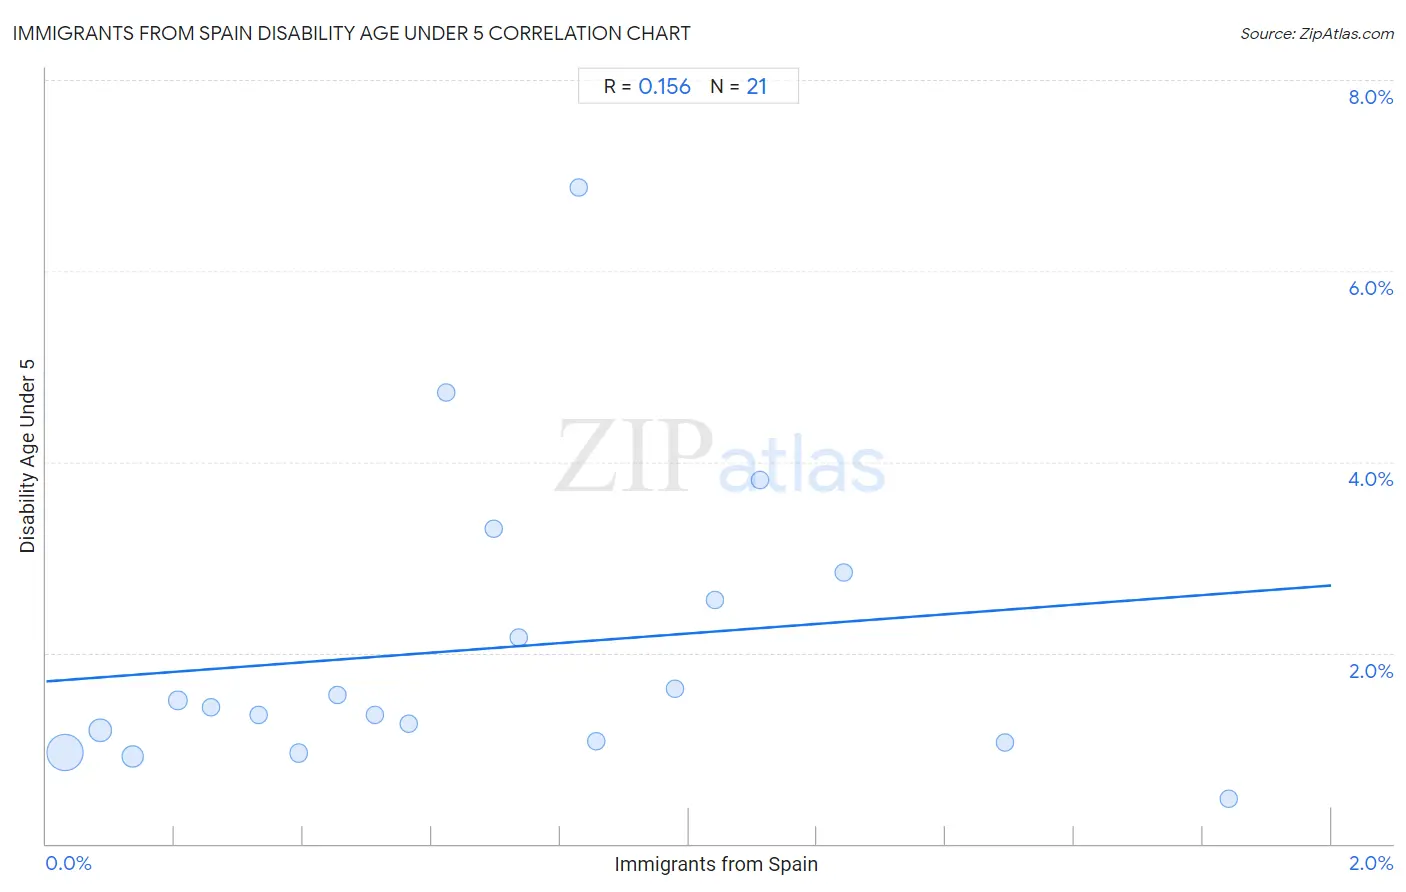
Immigrants from Spain Disability Age Under 5 Correlation Chart

The statistical analysis conducted on geographies consisting of 150,109,645 people shows a poor positive correlation between the proportion of Immigrants from Spain and percentage of population with a disability under the age of 5 in the United States with a correlation coefficient (R) of 0.156 and weighted average of 1.2%. On average, for every 1% (one percent) increase in Immigrants from Spain within a typical geography, there is an increase of 0.50% in percentage of population with a disability under the age of 5.
Immigrants from Spain Disability Age Under 5
It is essential to understand that the correlation between the percentage of Immigrants from Spain and percentage of population with a disability under the age of 5 does not imply a direct cause-and-effect relationship. It remains uncertain whether the presence of Immigrants from Spain influences an upward or downward trend in the level of percentage of population with a disability under the age of 5 within an area, or if Immigrants from Spain simply ended up residing in those areas with higher or lower levels of percentage of population with a disability under the age of 5 due to other factors.

Demographics Similar to Immigrants from Spain by Disability Age Under 5

In terms of disability age under 5, the demographic groups most similar to Immigrants from Spain are Immigrants from Eastern Europe (1.2%, a difference of 0.16%), Argentinean (1.2%, a difference of 0.16%), Immigrants from Serbia (1.2%, a difference of 0.23%), Korean (1.2%, a difference of 0.24%), and Immigrants (1.2%, a difference of 0.32%).
DemographicsRating | RankDisability Age Under 5
Central Americans
89.7
/100
|
#126
Excellent
1.2%
Immigrants from Romania
88.4
/100
|
#127
Excellent
1.2%
Immigrants from France
88.4
/100
|
#128
Excellent
1.2%
Immigrants
88.0
/100
|
#129
Excellent
1.2%
Koreans
87.7
/100
|
#130
Excellent
1.2%
Immigrants from Serbia
87.6
/100
|
#131
Excellent
1.2%
Immigrants from Eastern Europe
87.3
/100
|
#132
Excellent
1.2%
Immigrants from Spain
86.5
/100
|
#133
Excellent
1.2%
Argentineans
85.7
/100
|
#134
Excellent
1.2%
Fijians
84.7
/100
|
#135
Excellent
1.2%
Moroccans
83.6
/100
|
#136
Excellent
1.2%
Immigrants from Eastern Africa
83.1
/100
|
#137
Excellent
1.2%
Immigrants from Czechoslovakia
82.8
/100
|
#138
Excellent
1.2%
New Zealanders
81.4
/100
|
#139
Excellent
1.2%
Somalis
80.8
/100
|
#140
Excellent
1.2%

Immigrants from Spain Disability Age Under 5 Correlation Summary

MeasurementImmigrants from Spain DataDisability Age Under 5 Data
Minimum0.029%0.48%
Maximum1.8%6.9%
Range1.8%6.4%
Mean0.69%2.0%
Median0.62%1.4%
Interquartile 25% (IQ1)0.29%1.1%
Interquartile 75% (IQ3)1.0%2.7%
Interquartile Range (IQR)0.72%1.6%
Standard Deviation (Sample)0.48%1.5%
Standard Deviation (Population)0.47%1.5%

Correlation Details

Immigrants from Spain PercentileSample SizeDisability Age Under 5
[
0.0%
-
0.5%
]
0.029%
99,320,8650.96%
[
0.0%
-
0.5%
]
0.084%
23,530,8881.2%
[
0.0%
-
0.5%
]
0.13%
17,888,5910.91%
[
0.0%
-
0.5%
]
0.20%
2,677,1221.5%
[
0.0%
-
0.5%
]
0.26%
2,679,3321.4%
[
0.0%
-
0.5%
]
0.33%
1,046,0901.4%
[
0.0%
-
0.5%
]
0.39%
534,9560.95%
[
0.0%
-
0.5%
]
0.45%
495,9011.6%
[
0.5%
-
1.0%
]
0.51%
1,055,7331.3%
[
0.5%
-
1.0%
]
0.56%
225,5281.3%
[
0.5%
-
1.0%
]
0.62%
144,6904.7%
[
0.5%
-
1.0%
]
0.70%
49,8033.3%
[
0.5%
-
1.0%
]
0.74%
97,5642.2%
[
0.5%
-
1.0%
]
0.83%
37,2476.9%
[
0.5%
-
1.0%
]
0.86%
83,6471.1%
[
0.5%
-
1.0%
]
0.98%
32,5821.6%
[
1.0%
-
1.5%
]
1.04%
97,7172.6%
[
1.0%
-
1.5%
]
1.11%
15,5633.8%
[
1.0%
-
1.5%
]
1.24%
18,2792.8%
[
1.0%
-
1.5%
]
1.49%
20,8511.1%
[
1.5%
-
2.0%
]
1.84%
56,6960.48%