Spanish American Indian Disability Age Under 5
COMPARE
Spanish American Indian
Select to Compare
Disability Age Under 5
Spanish American Indian Disability Age Under 5
1.3%
DISABILITY | AGE UNDER 5
2.4/ 100
METRIC RATING
238th/ 347
METRIC RANK
Spanish American Indian Disability Age Under 5 Correlation Chart
The statistical analysis conducted on geographies consisting of 62,046,351 people shows a weak positive correlation between the proportion of Spanish American Indians and percentage of population with a disability under the age of 5 in the United States with a correlation coefficient (R) of 0.255 and weighted average of 1.3%. On average, for every 1% (one percent) increase in Spanish American Indians within a typical geography, there is an increase of 1.4% in percentage of population with a disability under the age of 5.
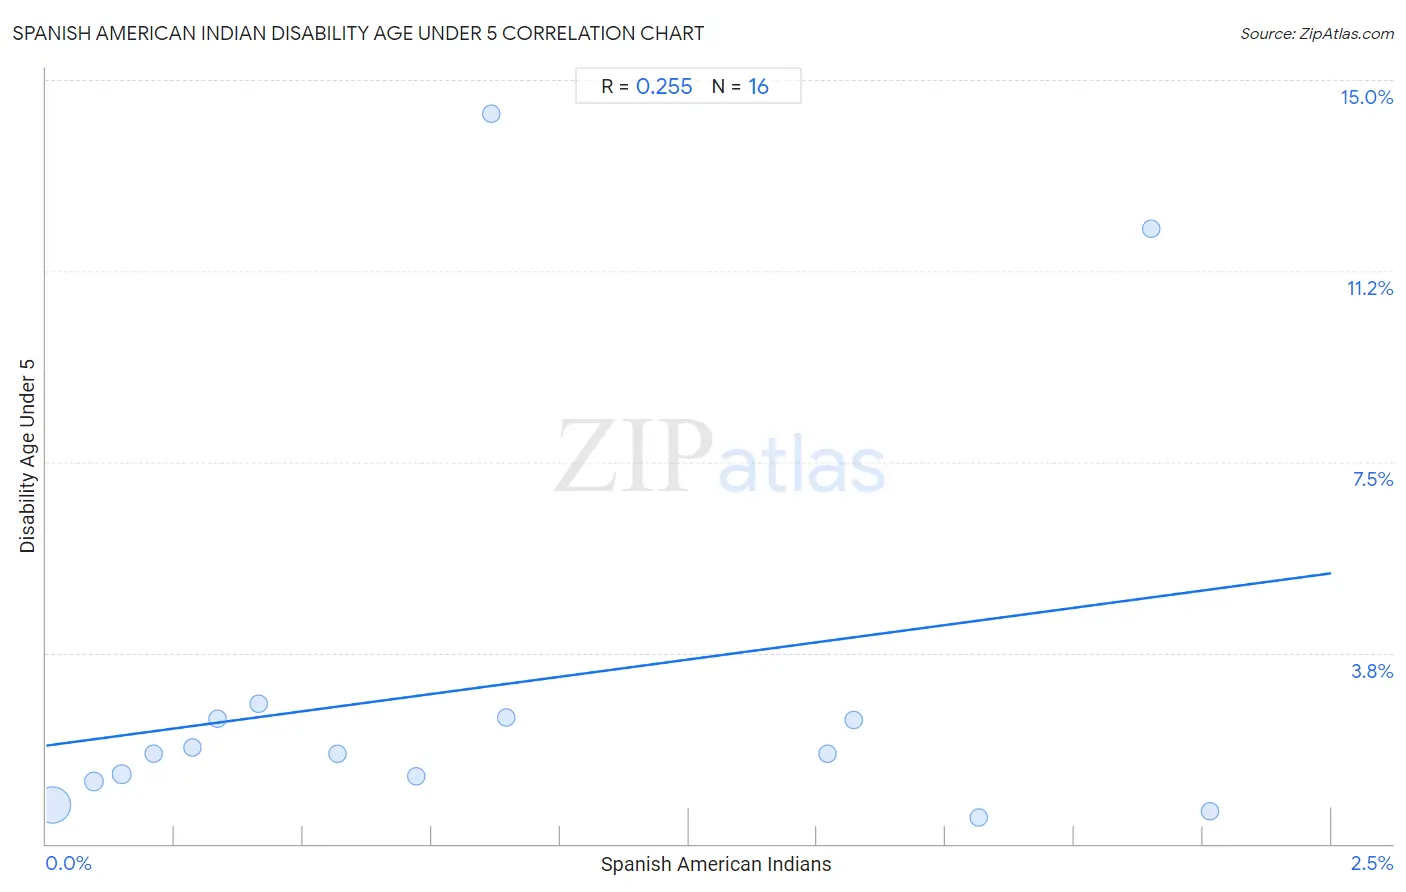
It is essential to understand that the correlation between the percentage of Spanish American Indians and percentage of population with a disability under the age of 5 does not imply a direct cause-and-effect relationship. It remains uncertain whether the presence of Spanish American Indians influences an upward or downward trend in the level of percentage of population with a disability under the age of 5 within an area, or if Spanish American Indians simply ended up residing in those areas with higher or lower levels of percentage of population with a disability under the age of 5 due to other factors.
Demographics Similar to Spanish American Indians by Disability Age Under 5
In terms of disability age under 5, the demographic groups most similar to Spanish American Indians are Immigrants from Austria (1.3%, a difference of 0.16%), Native Hawaiian (1.3%, a difference of 0.18%), Maltese (1.3%, a difference of 0.25%), Lumbee (1.3%, a difference of 0.34%), and Basque (1.3%, a difference of 0.43%).
| Demographics | Rating | Rank | Disability Age Under 5 |
| Immigrants from Northern Europe | 4.7 /100 | #231 | Tragic 1.3% |
| French American Indians | 4.5 /100 | #232 | Tragic 1.3% |
| Tongans | 4.2 /100 | #233 | Tragic 1.3% |
| Pueblo | 3.8 /100 | #234 | Tragic 1.3% |
| Central American Indians | 3.6 /100 | #235 | Tragic 1.3% |
| South American Indians | 3.3 /100 | #236 | Tragic 1.3% |
| Basques | 3.0 /100 | #237 | Tragic 1.3% |
| Spanish American Indians | 2.4 /100 | #238 | Tragic 1.3% |
| Immigrants from Austria | 2.3 /100 | #239 | Tragic 1.3% |
| Native Hawaiians | 2.2 /100 | #240 | Tragic 1.3% |
| Maltese | 2.2 /100 | #241 | Tragic 1.3% |
| Lumbee | 2.1 /100 | #242 | Tragic 1.3% |
| Immigrants from Cameroon | 1.7 /100 | #243 | Tragic 1.4% |
| Spaniards | 1.4 /100 | #244 | Tragic 1.4% |
| Potawatomi | 1.1 /100 | #245 | Tragic 1.4% |
Spanish American Indian Disability Age Under 5 Correlation Summary
| Measurement | Spanish American Indian Data | Disability Age Under 5 Data |
| Minimum | 0.012% | 0.53% |
| Maximum | 2.3% | 14.3% |
| Range | 2.3% | 13.8% |
| Mean | 0.87% | 3.1% |
| Median | 0.64% | 1.8% |
| Interquartile 25% (IQ1) | 0.25% | 1.3% |
| Interquartile 75% (IQ3) | 1.5% | 2.5% |
| Interquartile Range (IQR) | 1.3% | 1.2% |
| Standard Deviation (Sample) | 0.76% | 4.0% |
| Standard Deviation (Population) | 0.73% | 3.9% |
Correlation Details
| Spanish American Indian Percentile | Sample Size | Disability Age Under 5 |
[ 0.0% - 0.5% ] 0.012% | 56,984,715 | 0.77% |
[ 0.0% - 0.5% ] 0.092% | 2,541,376 | 1.2% |
[ 0.0% - 0.5% ] 0.15% | 1,071,551 | 1.4% |
[ 0.0% - 0.5% ] 0.21% | 541,947 | 1.8% |
[ 0.0% - 0.5% ] 0.28% | 325,085 | 1.9% |
[ 0.0% - 0.5% ] 0.33% | 68,567 | 2.4% |
[ 0.0% - 0.5% ] 0.41% | 69,860 | 2.8% |
[ 0.5% - 1.0% ] 0.57% | 35,443 | 1.8% |
[ 0.5% - 1.0% ] 0.72% | 33,717 | 1.3% |
[ 0.5% - 1.0% ] 0.87% | 6,929 | 14.3% |
[ 0.5% - 1.0% ] 0.89% | 21,686 | 2.5% |
[ 1.5% - 2.0% ] 1.52% | 49,704 | 1.8% |
[ 1.5% - 2.0% ] 1.57% | 89,021 | 2.4% |
[ 1.5% - 2.0% ] 1.81% | 108,682 | 0.53% |
[ 2.0% - 2.5% ] 2.15% | 10,979 | 12.1% |
[ 2.0% - 2.5% ] 2.26% | 87,089 | 0.65% |