Chickasaw 1 or more Vehicles in Household
COMPARE
Chickasaw
Select to Compare
1 or more Vehicles in Household
Chickasaw 1 or more Vehicles in Household
92.3%
1+ VEHICLES AVAILABLE
99.9/ 100
METRIC RATING
42nd/ 347
METRIC RANK
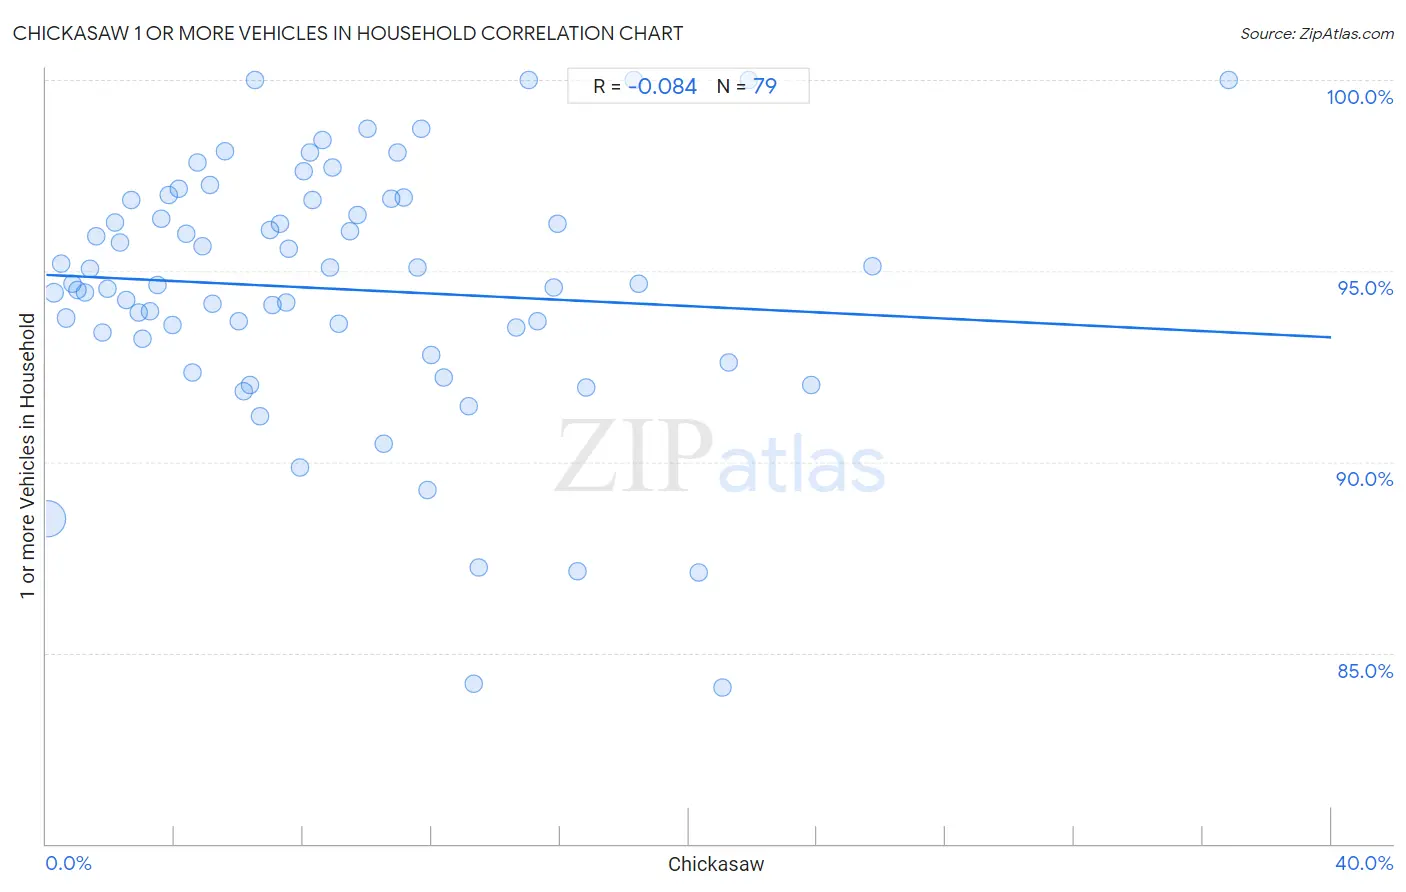
Chickasaw 1 or more Vehicles in Household Correlation Chart
The statistical analysis conducted on geographies consisting of 147,674,268 people shows a slight negative correlation between the proportion of Chickasaw and percentage of households with 1 or more vehicles available in the United States with a correlation coefficient (R) of -0.084 and weighted average of 92.3%. On average, for every 1% (one percent) increase in Chickasaw within a typical geography, there is a decrease of 0.041% in percentage of households with 1 or more vehicles available.
It is essential to understand that the correlation between the percentage of Chickasaw and percentage of households with 1 or more vehicles available does not imply a direct cause-and-effect relationship. It remains uncertain whether the presence of Chickasaw influences an upward or downward trend in the level of percentage of households with 1 or more vehicles available within an area, or if Chickasaw simply ended up residing in those areas with higher or lower levels of percentage of households with 1 or more vehicles available due to other factors.
Demographics Similar to Chickasaw by 1 or more Vehicles in Household
In terms of 1 or more vehicles in household, the demographic groups most similar to Chickasaw are Spanish (92.3%, a difference of 0.0%), Immigrants from Taiwan (92.3%, a difference of 0.010%), Choctaw (92.2%, a difference of 0.020%), Swiss (92.3%, a difference of 0.030%), and Creek (92.3%, a difference of 0.030%).
| Demographics | Rating | Rank | 1 or more Vehicles in Household |
| Czechoslovakians | 99.9 /100 | #35 | Exceptional 92.3% |
| Malaysians | 99.9 /100 | #36 | Exceptional 92.3% |
| French Canadians | 99.9 /100 | #37 | Exceptional 92.3% |
| Immigrants from Vietnam | 99.9 /100 | #38 | Exceptional 92.3% |
| Swiss | 99.9 /100 | #39 | Exceptional 92.3% |
| Creek | 99.9 /100 | #40 | Exceptional 92.3% |
| Immigrants from Taiwan | 99.9 /100 | #41 | Exceptional 92.3% |
| Chickasaw | 99.9 /100 | #42 | Exceptional 92.3% |
| Spanish | 99.9 /100 | #43 | Exceptional 92.3% |
| Choctaw | 99.9 /100 | #44 | Exceptional 92.2% |
| Nonimmigrants | 99.9 /100 | #45 | Exceptional 92.2% |
| Immigrants from Fiji | 99.9 /100 | #46 | Exceptional 92.2% |
| Northern Europeans | 99.9 /100 | #47 | Exceptional 92.2% |
| Belgians | 99.9 /100 | #48 | Exceptional 92.1% |
| Afghans | 99.9 /100 | #49 | Exceptional 92.1% |
Chickasaw 1 or more Vehicles in Household Correlation Summary
| Measurement | Chickasaw Data | 1 or more Vehicles in Household Data |
| Minimum | 0.032% | 84.1% |
| Maximum | 36.8% | 100.0% |
| Range | 36.8% | 15.9% |
| Mean | 9.0% | 94.5% |
| Median | 7.6% | 94.7% |
| Interquartile 25% (IQ1) | 3.6% | 93.2% |
| Interquartile 75% (IQ3) | 12.4% | 96.8% |
| Interquartile Range (IQR) | 8.8% | 3.6% |
| Standard Deviation (Sample) | 7.0% | 3.4% |
| Standard Deviation (Population) | 6.9% | 3.4% |
Correlation Details
| Chickasaw Percentile | Sample Size | 1 or more Vehicles in Household |
[ 0.0% - 0.5% ] 0.032% | 136,647,910 | 88.5% |
[ 0.0% - 0.5% ] 0.25% | 5,292,005 | 94.4% |
[ 0.0% - 0.5% ] 0.45% | 1,603,236 | 95.2% |
[ 0.5% - 1.0% ] 0.60% | 1,614,409 | 93.8% |
[ 0.5% - 1.0% ] 0.83% | 822,648 | 94.7% |
[ 0.5% - 1.0% ] 0.99% | 474,840 | 94.5% |
[ 1.0% - 1.5% ] 1.19% | 233,583 | 94.4% |
[ 1.0% - 1.5% ] 1.35% | 249,739 | 95.1% |
[ 1.5% - 2.0% ] 1.54% | 89,231 | 95.9% |
[ 1.5% - 2.0% ] 1.74% | 87,815 | 93.4% |
[ 1.5% - 2.0% ] 1.93% | 53,323 | 94.5% |
[ 2.0% - 2.5% ] 2.13% | 48,029 | 96.3% |
[ 2.0% - 2.5% ] 2.28% | 55,156 | 95.7% |
[ 2.5% - 3.0% ] 2.51% | 15,979 | 94.2% |
[ 2.5% - 3.0% ] 2.66% | 16,025 | 96.8% |
[ 2.5% - 3.0% ] 2.88% | 67,875 | 93.9% |
[ 3.0% - 3.5% ] 3.00% | 18,539 | 93.2% |
[ 3.0% - 3.5% ] 3.24% | 16,118 | 93.9% |
[ 3.0% - 3.5% ] 3.46% | 7,995 | 94.6% |
[ 3.5% - 4.0% ] 3.58% | 7,909 | 96.4% |
[ 3.5% - 4.0% ] 3.83% | 1,750 | 97.0% |
[ 3.5% - 4.0% ] 3.93% | 2,773 | 93.6% |
[ 4.0% - 4.5% ] 4.14% | 4,957 | 97.2% |
[ 4.0% - 4.5% ] 4.35% | 20,308 | 96.0% |
[ 4.5% - 5.0% ] 4.53% | 26,620 | 92.4% |
[ 4.5% - 5.0% ] 4.70% | 4,529 | 97.9% |
[ 4.5% - 5.0% ] 4.86% | 2,552 | 95.7% |
[ 5.0% - 5.5% ] 5.10% | 4,663 | 97.2% |
[ 5.0% - 5.5% ] 5.18% | 40,906 | 94.2% |
[ 5.5% - 6.0% ] 5.57% | 4,596 | 98.1% |
[ 5.5% - 6.0% ] 6.00% | 4,318 | 93.7% |
[ 6.0% - 6.5% ] 6.17% | 665 | 91.8% |
[ 6.0% - 6.5% ] 6.36% | 6,967 | 92.0% |
[ 6.5% - 7.0% ] 6.51% | 215 | 100.0% |
[ 6.5% - 7.0% ] 6.65% | 1,234 | 91.2% |
[ 6.5% - 7.0% ] 6.95% | 4,633 | 96.1% |
[ 7.0% - 7.5% ] 7.04% | 1,108 | 94.1% |
[ 7.0% - 7.5% ] 7.28% | 8,632 | 96.3% |
[ 7.0% - 7.5% ] 7.45% | 2,925 | 94.2% |
[ 7.5% - 8.0% ] 7.56% | 6,148 | 95.6% |
[ 7.5% - 8.0% ] 7.88% | 2,449 | 89.9% |
[ 8.0% - 8.5% ] 8.00% | 350 | 97.6% |
[ 8.0% - 8.5% ] 8.21% | 633 | 98.1% |
[ 8.0% - 8.5% ] 8.29% | 4,329 | 96.8% |
[ 8.5% - 9.0% ] 8.60% | 651 | 98.4% |
[ 8.5% - 9.0% ] 8.81% | 919 | 95.1% |
[ 8.5% - 9.0% ] 8.93% | 1,803 | 97.7% |
[ 9.0% - 9.5% ] 9.11% | 966 | 93.6% |
[ 9.0% - 9.5% ] 9.44% | 4,841 | 96.0% |
[ 9.5% - 10.0% ] 9.69% | 351 | 96.4% |
[ 10.0% - 10.5% ] 10.00% | 7,518 | 98.7% |
[ 10.0% - 10.5% ] 10.49% | 286 | 90.5% |
[ 10.5% - 11.0% ] 10.75% | 930 | 96.9% |
[ 10.5% - 11.0% ] 10.95% | 5,491 | 98.1% |
[ 11.0% - 11.5% ] 11.15% | 1,283 | 96.9% |
[ 11.5% - 12.0% ] 11.54% | 208 | 95.1% |
[ 11.5% - 12.0% ] 11.68% | 1,516 | 98.7% |
[ 11.5% - 12.0% ] 11.85% | 16,629 | 89.3% |
[ 11.5% - 12.0% ] 11.98% | 31,368 | 92.8% |
[ 12.0% - 12.5% ] 12.37% | 897 | 92.2% |
[ 13.0% - 13.5% ] 13.13% | 8,460 | 91.5% |
[ 13.0% - 13.5% ] 13.31% | 3,110 | 84.2% |
[ 13.0% - 13.5% ] 13.45% | 119 | 87.2% |
[ 14.5% - 15.0% ] 14.64% | 560 | 93.5% |
[ 15.0% - 15.5% ] 15.00% | 40 | 100.0% |
[ 15.0% - 15.5% ] 15.30% | 791 | 93.7% |
[ 15.5% - 16.0% ] 15.79% | 190 | 94.6% |
[ 15.5% - 16.0% ] 15.93% | 841 | 96.2% |
[ 16.5% - 17.0% ] 16.55% | 145 | 87.1% |
[ 16.5% - 17.0% ] 16.79% | 262 | 92.0% |
[ 18.0% - 18.5% ] 18.29% | 82 | 100.0% |
[ 18.0% - 18.5% ] 18.46% | 428 | 94.7% |
[ 20.0% - 20.5% ] 20.31% | 64 | 87.1% |
[ 21.0% - 21.5% ] 21.05% | 114 | 84.1% |
[ 21.0% - 21.5% ] 21.23% | 212 | 92.6% |
[ 21.5% - 22.0% ] 21.86% | 988 | 100.0% |
[ 23.5% - 24.0% ] 23.81% | 189 | 92.0% |
[ 25.5% - 26.0% ] 25.74% | 1,286 | 95.1% |
[ 36.5% - 37.0% ] 36.79% | 106 | 100.0% |