Hmong Disability Age Under 5

COMPARE

Hmong
Race
Ancestry
AfghanAfricanAlaska NativeAlaskan AthabascanAlbanianAleutAlsatianAmericanApacheArabArapahoArgentineanArmenianAssyrian/Chaldean/SyriacAustralianAustrianBahamianBangladeshiBarbadianBasqueBelgianBelizeanBermudanBhutaneseBlackfeetBolivianBrazilianBritishBritish West IndianBulgarianBurmeseCajunCambodianCanadianCape VerdeanCarpatho RusynCelticCentral AmericanCentral American IndianCherokeeCheyenneChickasawChileanChineseChippewaChoctawColombianColvilleComancheCosta RicanCreeCreekCroatianCrowCubanCypriotCzechCzechoslovakianDanishDelawareDominicanDutchDutch West IndianEastern EuropeanEcuadorianEgyptianEnglishEstonianEthiopianEuropeanFijianFilipinoFinnishFrenchFrench American IndianFrench CanadianGermanGerman RussianGhanaianGreekGuamanian/ChamorroGuatemalanGuyaneseHaitianHmongHonduranHopiHoumaHungarianIcelanderIndian (Asian)IndonesianInupiatIranianIraqiIrishIroquoisIsraeliItalianJamaicanJapaneseJordanianKenyanKiowaKoreanLaotianLatvianLebaneseLiberianLithuanianLumbeeLuxembourgerMacedonianMalaysianMalteseMarshalleseMenomineeMexicanMexican American IndianMongolianMoroccanNative HawaiianNavajoNepaleseNew ZealanderNicaraguanNigerianNorthern EuropeanNorwegianOkinawanOsageOttawaPaiutePakistaniPalestinianPanamanianParaguayanPennsylvania GermanPeruvianPimaPolishPortuguesePotawatomiPuebloPuerto RicanPuget Sound SalishRomanianRussianSalvadoranSamoanScandinavianScotch-IrishScottishSeminoleSenegaleseSerbianShoshoneSierra LeoneanSiouxSlavicSlovakSloveneSomaliSouth AfricanSouth AmericanSouth American IndianSoviet UnionSpaniardSpanishSpanish AmericanSpanish American IndianSri LankanSubsaharan AfricanSudaneseSwedishSwissSyrianTaiwaneseThaiTlingit-HaidaTohono O'OdhamTonganTrinidadian and TobagonianTsimshianTurkishU.S. Virgin IslanderUgandanUkrainianUruguayanUteVenezuelanVietnameseWelshWest IndianYakamaYaquiYugoslavianYumanYup'ikZimbabwean
Immigration
NonimmigrantsImmigrantsAfghanistanAfricaAlbaniaArgentinaArmeniaAsiaAustraliaAustriaBahamasBangladeshBarbadosBelarusBelgiumBelizeBoliviaBosnia and HerzegovinaBrazilBulgariaBurma/MyanmarCabo VerdeCambodiaCameroonCanadaCaribbeanCentral AmericaChileChinaColombiaCongoCosta RicaCroatiaCubaCzechoslovakiaDenmarkDominicaDominican RepublicEastern AfricaEastern AsiaEastern EuropeEcuadorEgyptEl SalvadorEnglandEritreaEthiopiaEuropeFijiFranceGermanyGhanaGreeceGrenadaGuatemalaGuyanaHaitiHondurasHong KongHungaryIndiaIndonesiaIranIraqIrelandIsraelItalyJamaicaJapanJordanKazakhstanKenyaKoreaKuwaitLaosLatin AmericaLatviaLebanonLiberiaLithuaniaMalaysiaMexicoMicronesiaMiddle AfricaMoldovaMoroccoNepalNetherlandsNicaraguaNigeriaNorth AmericaNorth MacedoniaNorthern AfricaNorthern EuropeNorwayOceaniaPakistanPanamaPeruPhilippinesPolandPortugalRomaniaRussiaSaudi ArabiaScotlandSenegalSerbiaSierra LeoneSingaporeSomaliaSouth AfricaSouth AmericaSouth Central AsiaSouth Eastern AsiaSouthern EuropeSpainSri LankaSt. Vincent and the GrenadinesSudanSwedenSwitzerlandSyriaTaiwanThailandTrinidad and TobagoTurkeyUgandaUkraineUruguayUzbekistanVenezuelaVietnamWest IndiesWestern AfricaWestern AsiaWestern EuropeYemenZaireZimbabweAzores
Select to Compare
Race
Ancestry
AfghanAfricanAlaska NativeAlaskan AthabascanAlbanianAleutAlsatianAmericanApacheArabArapahoArgentineanArmenianAssyrian/Chaldean/SyriacAustralianAustrianBahamianBangladeshiBarbadianBasqueBelgianBelizeanBermudanBhutaneseBlackfeetBolivianBrazilianBritishBritish West IndianBulgarianBurmeseCajunCambodianCanadianCape VerdeanCarpatho RusynCelticCentral AmericanCentral American IndianCherokeeCheyenneChickasawChileanChineseChippewaChoctawColombianColvilleComancheCosta RicanCreeCreekCroatianCrowCubanCypriotCzechCzechoslovakianDanishDelawareDominicanDutchDutch West IndianEastern EuropeanEcuadorianEgyptianEnglishEstonianEthiopianEuropeanFijianFilipinoFinnishFrenchFrench American IndianFrench CanadianGermanGerman RussianGhanaianGreekGuamanian/ChamorroGuatemalanGuyaneseHaitianHonduranHopiHoumaHungarianIcelanderIndian (Asian)IndonesianInupiatIranianIraqiIrishIroquoisIsraeliItalianJamaicanJapaneseJordanianKenyanKiowaKoreanLaotianLatvianLebaneseLiberianLithuanianLumbeeLuxembourgerMacedonianMalaysianMalteseMarshalleseMenomineeMexicanMexican American IndianMongolianMoroccanNative HawaiianNavajoNepaleseNew ZealanderNicaraguanNigerianNorthern EuropeanNorwegianOkinawanOsageOttawaPaiutePakistaniPalestinianPanamanianParaguayanPennsylvania GermanPeruvianPimaPolishPortuguesePotawatomiPuebloPuerto RicanPuget Sound SalishRomanianRussianSalvadoranSamoanScandinavianScotch-IrishScottishSeminoleSenegaleseSerbianShoshoneSierra LeoneanSiouxSlavicSlovakSloveneSomaliSouth AfricanSouth AmericanSouth American IndianSoviet UnionSpaniardSpanishSpanish AmericanSpanish American IndianSri LankanSubsaharan AfricanSudaneseSwedishSwissSyrianTaiwaneseThaiTlingit-HaidaTohono O'OdhamTonganTrinidadian and TobagonianTsimshianTurkishU.S. Virgin IslanderUgandanUkrainianUruguayanUteVenezuelanVietnameseWelshWest IndianYakamaYaquiYugoslavianYumanYup'ikZimbabwean
Immigration
NonimmigrantsImmigrantsAfghanistanAfricaAlbaniaArgentinaArmeniaAsiaAustraliaAustriaBahamasBangladeshBarbadosBelarusBelgiumBelizeBoliviaBosnia and HerzegovinaBrazilBulgariaBurma/MyanmarCabo VerdeCambodiaCameroonCanadaCaribbeanCentral AmericaChileChinaColombiaCongoCosta RicaCroatiaCubaCzechoslovakiaDenmarkDominicaDominican RepublicEastern AfricaEastern AsiaEastern EuropeEcuadorEgyptEl SalvadorEnglandEritreaEthiopiaEuropeFijiFranceGermanyGhanaGreeceGrenadaGuatemalaGuyanaHaitiHondurasHong KongHungaryIndiaIndonesiaIranIraqIrelandIsraelItalyJamaicaJapanJordanKazakhstanKenyaKoreaKuwaitLaosLatin AmericaLatviaLebanonLiberiaLithuaniaMalaysiaMexicoMicronesiaMiddle AfricaMoldovaMoroccoNepalNetherlandsNicaraguaNigeriaNorth AmericaNorth MacedoniaNorthern AfricaNorthern EuropeNorwayOceaniaPakistanPanamaPeruPhilippinesPolandPortugalRomaniaRussiaSaudi ArabiaScotlandSenegalSerbiaSierra LeoneSingaporeSomaliaSouth AfricaSouth AmericaSouth Central AsiaSouth Eastern AsiaSouthern EuropeSpainSri LankaSt. Vincent and the GrenadinesSudanSwedenSwitzerlandSyriaTaiwanThailandTrinidad and TobagoTurkeyUgandaUkraineUruguayUzbekistanVenezuelaVietnamWest IndiesWestern AfricaWestern AsiaWestern EuropeYemenZaireZimbabweAzores
Disability Age Under 5
Income
Poverty
Unemployment
Labor Participation
Family Structure
Vehicle Availability
Education Level
Disability

Hmong Disability Age Under 5
Exceptional

1.1%
DISABILITY | AGE UNDER 5
98.0/ 100
METRIC RATING
79th/ 347
METRIC RANK

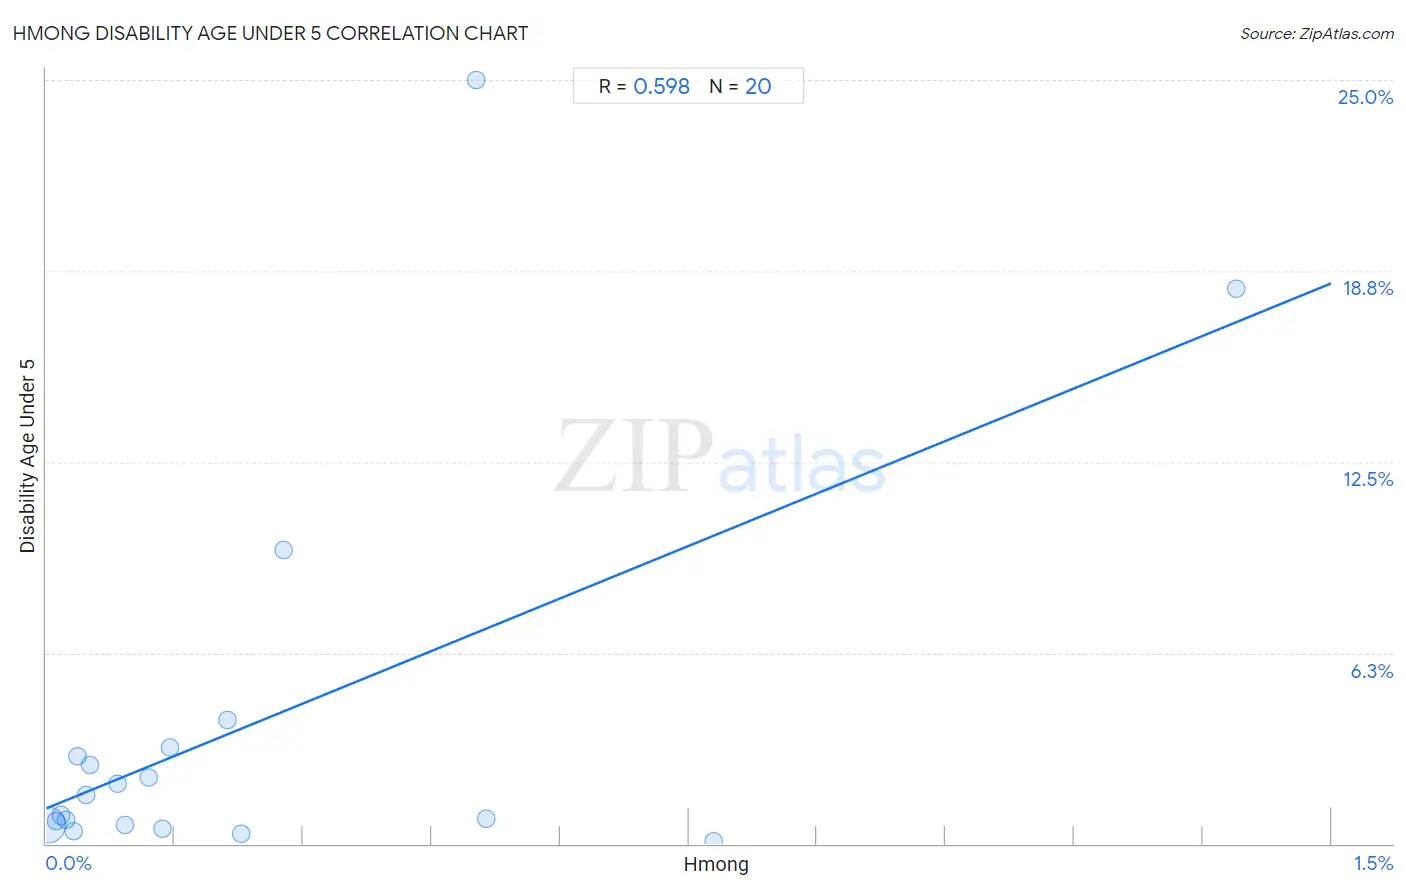
Hmong Disability Age Under 5 Correlation Chart

The statistical analysis conducted on geographies consisting of 22,687,572 people shows a substantial positive correlation between the proportion of Hmong and percentage of population with a disability under the age of 5 in the United States with a correlation coefficient (R) of 0.598 and weighted average of 1.1%. On average, for every 1% (one percent) increase in Hmong within a typical geography, there is an increase of 11.5% in percentage of population with a disability under the age of 5.
Hmong Disability Age Under 5
It is essential to understand that the correlation between the percentage of Hmong and percentage of population with a disability under the age of 5 does not imply a direct cause-and-effect relationship. It remains uncertain whether the presence of Hmong influences an upward or downward trend in the level of percentage of population with a disability under the age of 5 within an area, or if Hmong simply ended up residing in those areas with higher or lower levels of percentage of population with a disability under the age of 5 due to other factors.

Demographics Similar to Hmong by Disability Age Under 5

In terms of disability age under 5, the demographic groups most similar to Hmong are West Indian (1.1%, a difference of 0.020%), Immigrants from Trinidad and Tobago (1.1%, a difference of 0.020%), Turkish (1.1%, a difference of 0.040%), Immigrants from Denmark (1.1%, a difference of 0.14%), and Immigrants from Jordan (1.1%, a difference of 0.16%).
DemographicsRating | RankDisability Age Under 5
Burmese
98.5
/100
|
#72
Exceptional
1.1%
Immigrants from Sri Lanka
98.5
/100
|
#73
Exceptional
1.1%
Jordanians
98.5
/100
|
#74
Exceptional
1.1%
Immigrants from Pakistan
98.4
/100
|
#75
Exceptional
1.1%
Immigrants from Burma/Myanmar
98.2
/100
|
#76
Exceptional
1.1%
Immigrants from Denmark
98.1
/100
|
#77
Exceptional
1.1%
West Indians
98.0
/100
|
#78
Exceptional
1.1%
Hmong
98.0
/100
|
#79
Exceptional
1.1%
Immigrants from Trinidad and Tobago
98.0
/100
|
#80
Exceptional
1.1%
Turks
98.0
/100
|
#81
Exceptional
1.1%
Immigrants from Jordan
97.9
/100
|
#82
Exceptional
1.1%
Immigrants from Syria
97.9
/100
|
#83
Exceptional
1.1%
Immigrants from Zaire
97.8
/100
|
#84
Exceptional
1.1%
Sudanese
97.7
/100
|
#85
Exceptional
1.1%
Okinawans
97.6
/100
|
#86
Exceptional
1.1%

Hmong Disability Age Under 5 Correlation Summary

MeasurementHmong DataDisability Age Under 5 Data
Minimum0.0014%0.097%
Maximum1.4%25.0%
Range1.4%24.9%
Mean0.23%3.9%
Median0.11%1.3%
Interquartile 25% (IQ1)0.035%0.61%
Interquartile 75% (IQ3)0.25%3.0%
Interquartile Range (IQR)0.22%2.4%
Standard Deviation (Sample)0.34%6.5%
Standard Deviation (Population)0.33%6.4%

Correlation Details

Hmong PercentileSample SizeDisability Age Under 5
[
0.0%
-
0.5%
]
0.0014%
20,626,2150.63%
[
0.0%
-
0.5%
]
0.012%
383,6010.75%
[
0.0%
-
0.5%
]
0.018%
535,7430.92%
[
0.0%
-
0.5%
]
0.024%
333,3780.80%
[
0.0%
-
0.5%
]
0.032%
210,9100.40%
[
0.0%
-
0.5%
]
0.037%
13,5062.9%
[
0.0%
-
0.5%
]
0.047%
153,1911.6%
[
0.0%
-
0.5%
]
0.052%
114,1782.6%
[
0.0%
-
0.5%
]
0.084%
41,8492.0%
[
0.0%
-
0.5%
]
0.091%
52,4690.60%
[
0.0%
-
0.5%
]
0.12%
72,4352.2%
[
0.0%
-
0.5%
]
0.14%
26,5230.47%
[
0.0%
-
0.5%
]
0.14%
24,2353.1%
[
0.0%
-
0.5%
]
0.21%
3,3014.1%
[
0.0%
-
0.5%
]
0.23%
21,1180.35%
[
0.0%
-
0.5%
]
0.28%
1,0809.6%
[
0.5%
-
1.0%
]
0.50%
79625.0%
[
0.5%
-
1.0%
]
0.51%
61,2120.82%
[
0.5%
-
1.0%
]
0.78%
11,5440.097%
[
1.0%
-
1.5%
]
1.39%
28818.2%