Barbadian Disability Age Under 5

COMPARE

Barbadian
Race
Ancestry
AfghanAfricanAlaska NativeAlaskan AthabascanAlbanianAleutAlsatianAmericanApacheArabArapahoArgentineanArmenianAssyrian/Chaldean/SyriacAustralianAustrianBahamianBangladeshiBarbadianBasqueBelgianBelizeanBermudanBhutaneseBlackfeetBolivianBrazilianBritishBritish West IndianBulgarianBurmeseCajunCambodianCanadianCape VerdeanCarpatho RusynCelticCentral AmericanCentral American IndianCherokeeCheyenneChickasawChileanChineseChippewaChoctawColombianColvilleComancheCosta RicanCreeCreekCroatianCrowCubanCypriotCzechCzechoslovakianDanishDelawareDominicanDutchDutch West IndianEastern EuropeanEcuadorianEgyptianEnglishEstonianEthiopianEuropeanFijianFilipinoFinnishFrenchFrench American IndianFrench CanadianGermanGerman RussianGhanaianGreekGuamanian/ChamorroGuatemalanGuyaneseHaitianHmongHonduranHopiHoumaHungarianIcelanderIndian (Asian)IndonesianInupiatIranianIraqiIrishIroquoisIsraeliItalianJamaicanJapaneseJordanianKenyanKiowaKoreanLaotianLatvianLebaneseLiberianLithuanianLumbeeLuxembourgerMacedonianMalaysianMalteseMarshalleseMenomineeMexicanMexican American IndianMongolianMoroccanNative HawaiianNavajoNepaleseNew ZealanderNicaraguanNigerianNorthern EuropeanNorwegianOkinawanOsageOttawaPaiutePakistaniPalestinianPanamanianParaguayanPennsylvania GermanPeruvianPimaPolishPortuguesePotawatomiPuebloPuerto RicanPuget Sound SalishRomanianRussianSalvadoranSamoanScandinavianScotch-IrishScottishSeminoleSenegaleseSerbianShoshoneSierra LeoneanSiouxSlavicSlovakSloveneSomaliSouth AfricanSouth AmericanSouth American IndianSoviet UnionSpaniardSpanishSpanish AmericanSpanish American IndianSri LankanSubsaharan AfricanSudaneseSwedishSwissSyrianTaiwaneseThaiTlingit-HaidaTohono O'OdhamTonganTrinidadian and TobagonianTsimshianTurkishU.S. Virgin IslanderUgandanUkrainianUruguayanUteVenezuelanVietnameseWelshWest IndianYakamaYaquiYugoslavianYumanYup'ikZimbabwean
Immigration
NonimmigrantsImmigrantsAfghanistanAfricaAlbaniaArgentinaArmeniaAsiaAustraliaAustriaBahamasBangladeshBarbadosBelarusBelgiumBelizeBoliviaBosnia and HerzegovinaBrazilBulgariaBurma/MyanmarCabo VerdeCambodiaCameroonCanadaCaribbeanCentral AmericaChileChinaColombiaCongoCosta RicaCroatiaCubaCzechoslovakiaDenmarkDominicaDominican RepublicEastern AfricaEastern AsiaEastern EuropeEcuadorEgyptEl SalvadorEnglandEritreaEthiopiaEuropeFijiFranceGermanyGhanaGreeceGrenadaGuatemalaGuyanaHaitiHondurasHong KongHungaryIndiaIndonesiaIranIraqIrelandIsraelItalyJamaicaJapanJordanKazakhstanKenyaKoreaKuwaitLaosLatin AmericaLatviaLebanonLiberiaLithuaniaMalaysiaMexicoMicronesiaMiddle AfricaMoldovaMoroccoNepalNetherlandsNicaraguaNigeriaNorth AmericaNorth MacedoniaNorthern AfricaNorthern EuropeNorwayOceaniaPakistanPanamaPeruPhilippinesPolandPortugalRomaniaRussiaSaudi ArabiaScotlandSenegalSerbiaSierra LeoneSingaporeSomaliaSouth AfricaSouth AmericaSouth Central AsiaSouth Eastern AsiaSouthern EuropeSpainSri LankaSt. Vincent and the GrenadinesSudanSwedenSwitzerlandSyriaTaiwanThailandTrinidad and TobagoTurkeyUgandaUkraineUruguayUzbekistanVenezuelaVietnamWest IndiesWestern AfricaWestern AsiaWestern EuropeYemenZaireZimbabweAzores
Select to Compare
Race
Ancestry
AfghanAfricanAlaska NativeAlaskan AthabascanAlbanianAleutAlsatianAmericanApacheArabArapahoArgentineanArmenianAssyrian/Chaldean/SyriacAustralianAustrianBahamianBangladeshiBasqueBelgianBelizeanBermudanBhutaneseBlackfeetBolivianBrazilianBritishBritish West IndianBulgarianBurmeseCajunCambodianCanadianCape VerdeanCarpatho RusynCelticCentral AmericanCentral American IndianCherokeeCheyenneChickasawChileanChineseChippewaChoctawColombianColvilleComancheCosta RicanCreeCreekCroatianCrowCubanCypriotCzechCzechoslovakianDanishDelawareDominicanDutchDutch West IndianEastern EuropeanEcuadorianEgyptianEnglishEstonianEthiopianEuropeanFijianFilipinoFinnishFrenchFrench American IndianFrench CanadianGermanGerman RussianGhanaianGreekGuamanian/ChamorroGuatemalanGuyaneseHaitianHmongHonduranHopiHoumaHungarianIcelanderIndian (Asian)IndonesianInupiatIranianIraqiIrishIroquoisIsraeliItalianJamaicanJapaneseJordanianKenyanKiowaKoreanLaotianLatvianLebaneseLiberianLithuanianLumbeeLuxembourgerMacedonianMalaysianMalteseMarshalleseMenomineeMexicanMexican American IndianMongolianMoroccanNative HawaiianNavajoNepaleseNew ZealanderNicaraguanNigerianNorthern EuropeanNorwegianOkinawanOsageOttawaPaiutePakistaniPalestinianPanamanianParaguayanPennsylvania GermanPeruvianPimaPolishPortuguesePotawatomiPuebloPuerto RicanPuget Sound SalishRomanianRussianSalvadoranSamoanScandinavianScotch-IrishScottishSeminoleSenegaleseSerbianShoshoneSierra LeoneanSiouxSlavicSlovakSloveneSomaliSouth AfricanSouth AmericanSouth American IndianSoviet UnionSpaniardSpanishSpanish AmericanSpanish American IndianSri LankanSubsaharan AfricanSudaneseSwedishSwissSyrianTaiwaneseThaiTlingit-HaidaTohono O'OdhamTonganTrinidadian and TobagonianTsimshianTurkishU.S. Virgin IslanderUgandanUkrainianUruguayanUteVenezuelanVietnameseWelshWest IndianYakamaYaquiYugoslavianYumanYup'ikZimbabwean
Immigration
NonimmigrantsImmigrantsAfghanistanAfricaAlbaniaArgentinaArmeniaAsiaAustraliaAustriaBahamasBangladeshBarbadosBelarusBelgiumBelizeBoliviaBosnia and HerzegovinaBrazilBulgariaBurma/MyanmarCabo VerdeCambodiaCameroonCanadaCaribbeanCentral AmericaChileChinaColombiaCongoCosta RicaCroatiaCubaCzechoslovakiaDenmarkDominicaDominican RepublicEastern AfricaEastern AsiaEastern EuropeEcuadorEgyptEl SalvadorEnglandEritreaEthiopiaEuropeFijiFranceGermanyGhanaGreeceGrenadaGuatemalaGuyanaHaitiHondurasHong KongHungaryIndiaIndonesiaIranIraqIrelandIsraelItalyJamaicaJapanJordanKazakhstanKenyaKoreaKuwaitLaosLatin AmericaLatviaLebanonLiberiaLithuaniaMalaysiaMexicoMicronesiaMiddle AfricaMoldovaMoroccoNepalNetherlandsNicaraguaNigeriaNorth AmericaNorth MacedoniaNorthern AfricaNorthern EuropeNorwayOceaniaPakistanPanamaPeruPhilippinesPolandPortugalRomaniaRussiaSaudi ArabiaScotlandSenegalSerbiaSierra LeoneSingaporeSomaliaSouth AfricaSouth AmericaSouth Central AsiaSouth Eastern AsiaSouthern EuropeSpainSri LankaSt. Vincent and the GrenadinesSudanSwedenSwitzerlandSyriaTaiwanThailandTrinidad and TobagoTurkeyUgandaUkraineUruguayUzbekistanVenezuelaVietnamWest IndiesWestern AfricaWestern AsiaWestern EuropeYemenZaireZimbabweAzores
Disability Age Under 5
Income
Poverty
Unemployment
Labor Participation
Family Structure
Vehicle Availability
Education Level
Disability

Barbadian Disability Age Under 5
Exceptional

1.0%
DISABILITY | AGE UNDER 5
99.9/ 100
METRIC RATING
35th/ 347
METRIC RANK

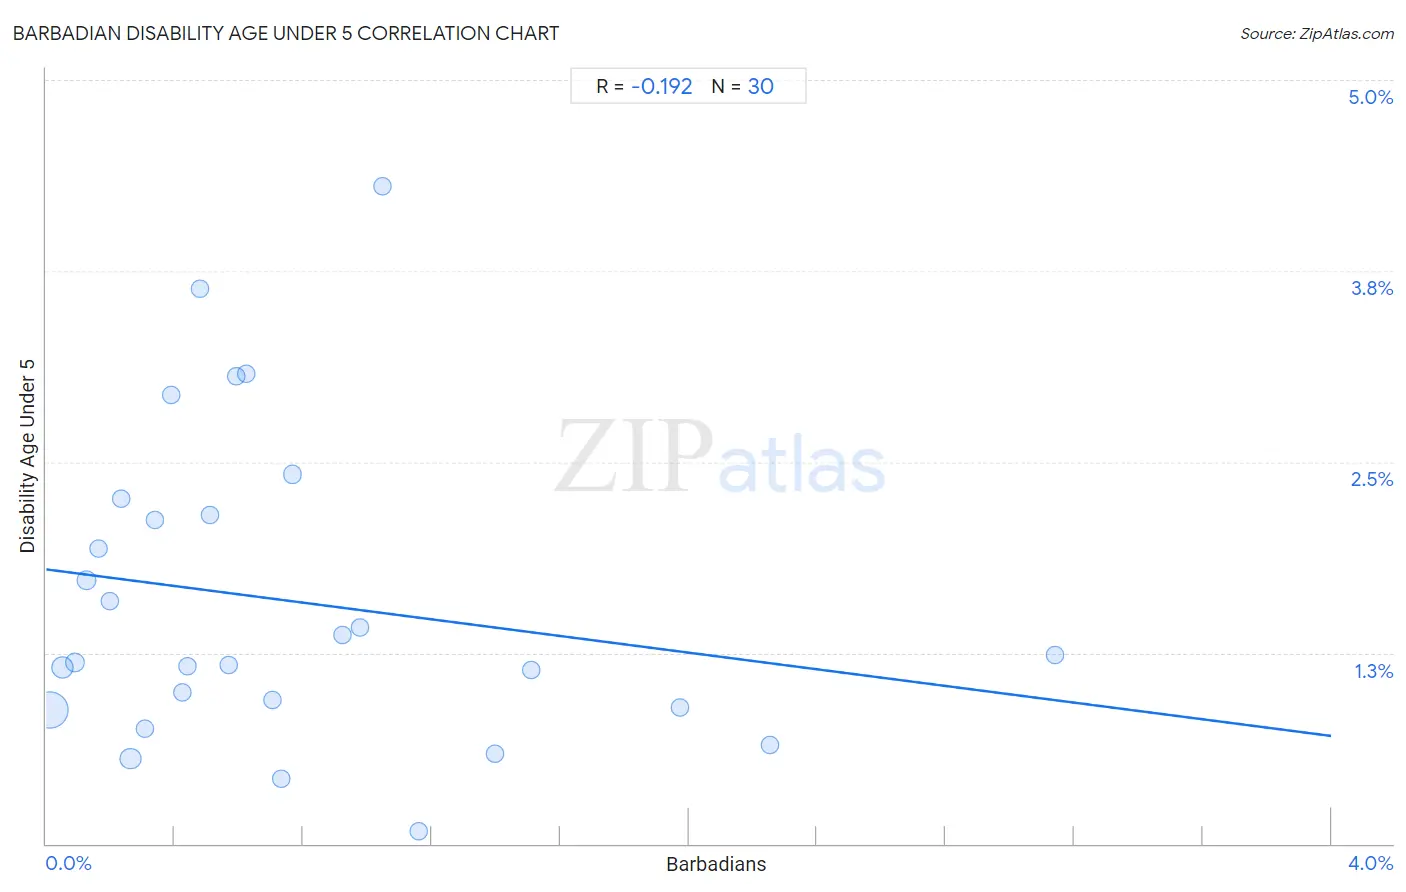
Barbadian Disability Age Under 5 Correlation Chart

The statistical analysis conducted on geographies consisting of 100,337,309 people shows a poor negative correlation between the proportion of Barbadians and percentage of population with a disability under the age of 5 in the United States with a correlation coefficient (R) of -0.192 and weighted average of 1.0%. On average, for every 1% (one percent) increase in Barbadians within a typical geography, there is a decrease of 0.27% in percentage of population with a disability under the age of 5.
Barbadian Disability Age Under 5
It is essential to understand that the correlation between the percentage of Barbadians and percentage of population with a disability under the age of 5 does not imply a direct cause-and-effect relationship. It remains uncertain whether the presence of Barbadians influences an upward or downward trend in the level of percentage of population with a disability under the age of 5 within an area, or if Barbadians simply ended up residing in those areas with higher or lower levels of percentage of population with a disability under the age of 5 due to other factors.

Demographics Similar to Barbadians by Disability Age Under 5

In terms of disability age under 5, the demographic groups most similar to Barbadians are Immigrants from Ukraine (1.0%, a difference of 0.24%), Bolivian (1.0%, a difference of 0.36%), Iranian (1.0%, a difference of 0.53%), Armenian (1.0%, a difference of 0.58%), and Immigrants from Nepal (1.0%, a difference of 0.71%).
DemographicsRating | RankDisability Age Under 5
Immigrants from Eastern Asia
100.0
/100
|
#28
Exceptional
1.0%
Immigrants from Belarus
100.0
/100
|
#29
Exceptional
1.0%
Immigrants from South Central Asia
99.9
/100
|
#30
Exceptional
1.0%
Armenians
99.9
/100
|
#31
Exceptional
1.0%
Iranians
99.9
/100
|
#32
Exceptional
1.0%
Bolivians
99.9
/100
|
#33
Exceptional
1.0%
Immigrants from Ukraine
99.9
/100
|
#34
Exceptional
1.0%
Barbadians
99.9
/100
|
#35
Exceptional
1.0%
Immigrants from Nepal
99.9
/100
|
#36
Exceptional
1.0%
Immigrants from India
99.9
/100
|
#37
Exceptional
1.0%
Immigrants from Guyana
99.9
/100
|
#38
Exceptional
1.0%
Filipinos
99.9
/100
|
#39
Exceptional
1.1%
Immigrants from Albania
99.9
/100
|
#40
Exceptional
1.1%
Thais
99.8
/100
|
#41
Exceptional
1.1%
Immigrants from Bulgaria
99.8
/100
|
#42
Exceptional
1.1%

Barbadian Disability Age Under 5 Correlation Summary

MeasurementBarbadian DataDisability Age Under 5 Data
Minimum0.012%0.086%
Maximum3.1%4.3%
Range3.1%4.2%
Mean0.75%1.6%
Median0.54%1.2%
Interquartile 25% (IQ1)0.26%0.89%
Interquartile 75% (IQ3)0.98%2.2%
Interquartile Range (IQR)0.72%1.3%
Standard Deviation (Sample)0.71%1.0%
Standard Deviation (Population)0.70%1.00%

Correlation Details

Barbadian PercentileSample SizeDisability Age Under 5
[
0.0%
-
0.5%
]
0.012%
64,542,1630.88%
[
0.0%
-
0.5%
]
0.050%
13,306,7681.2%
[
0.0%
-
0.5%
]
0.088%
4,610,6281.2%
[
0.0%
-
0.5%
]
0.12%
2,568,7201.7%
[
0.0%
-
0.5%
]
0.16%
1,321,3531.9%
[
0.0%
-
0.5%
]
0.20%
1,008,0891.6%
[
0.0%
-
0.5%
]
0.23%
421,5162.3%
[
0.0%
-
0.5%
]
0.26%
9,174,1260.56%
[
0.0%
-
0.5%
]
0.31%
594,1660.75%
[
0.0%
-
0.5%
]
0.34%
537,1282.1%
[
0.0%
-
0.5%
]
0.39%
235,7792.9%
[
0.0%
-
0.5%
]
0.42%
711,5110.99%
[
0.0%
-
0.5%
]
0.44%
142,2561.2%
[
0.0%
-
0.5%
]
0.48%
48,6813.6%
[
0.5%
-
1.0%
]
0.51%
86,8172.2%
[
0.5%
-
1.0%
]
0.57%
175,7211.2%
[
0.5%
-
1.0%
]
0.59%
1,8663.1%
[
0.5%
-
1.0%
]
0.62%
15,2433.1%
[
0.5%
-
1.0%
]
0.70%
107,2050.94%
[
0.5%
-
1.0%
]
0.73%
51,9640.43%
[
0.5%
-
1.0%
]
0.77%
136,5792.4%
[
0.5%
-
1.0%
]
0.92%
119,9391.4%
[
0.5%
-
1.0%
]
0.98%
37,5221.4%
[
1.0%
-
1.5%
]
1.05%
29,8204.3%
[
1.0%
-
1.5%
]
1.16%
89,9760.086%
[
1.0%
-
1.5%
]
1.40%
58,4760.59%
[
1.5%
-
2.0%
]
1.51%
1,5901.1%
[
1.5%
-
2.0%
]
1.97%
78,5060.89%
[
2.0%
-
2.5%
]
2.25%
100,0820.65%
[
3.0%
-
3.5%
]
3.14%
23,1191.2%