English Disability Age Under 5
COMPARE
English
Select to Compare
Disability Age Under 5
English Disability Age Under 5
1.7%
DISABILITY | AGE UNDER 5
0.0/ 100
METRIC RATING
311th/ 347
METRIC RANK
English Disability Age Under 5 Correlation Chart
The statistical analysis conducted on geographies consisting of 261,226,703 people shows a substantial positive correlation between the proportion of English and percentage of population with a disability under the age of 5 in the United States with a correlation coefficient (R) of 0.589 and weighted average of 1.7%. On average, for every 1% (one percent) increase in English within a typical geography, there is an increase of 0.75% in percentage of population with a disability under the age of 5.
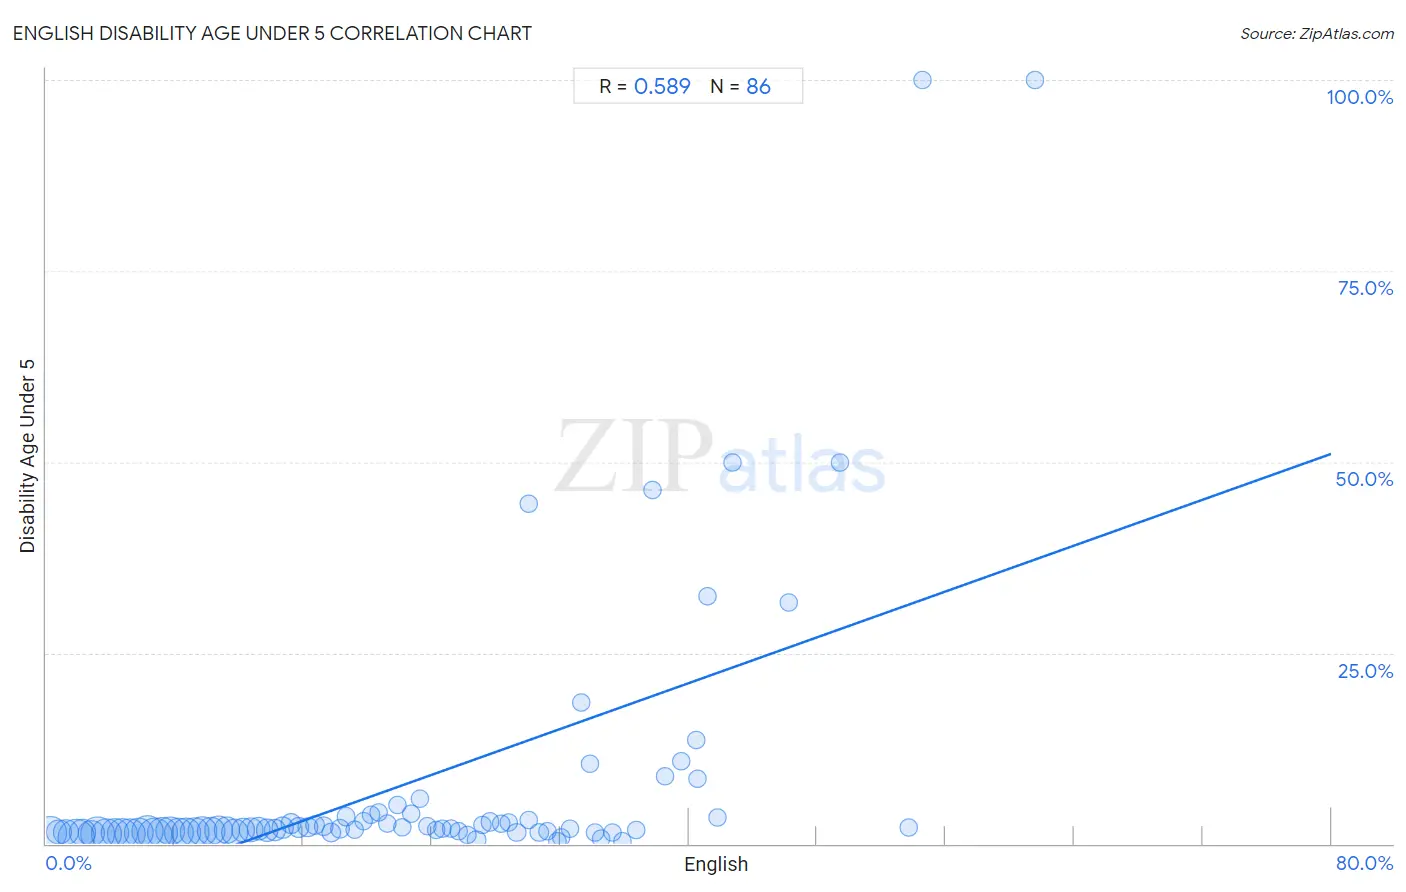
It is essential to understand that the correlation between the percentage of English and percentage of population with a disability under the age of 5 does not imply a direct cause-and-effect relationship. It remains uncertain whether the presence of English influences an upward or downward trend in the level of percentage of population with a disability under the age of 5 within an area, or if English simply ended up residing in those areas with higher or lower levels of percentage of population with a disability under the age of 5 due to other factors.
Demographics Similar to English by Disability Age Under 5
In terms of disability age under 5, the demographic groups most similar to English are Puerto Rican (1.7%, a difference of 0.040%), Celtic (1.7%, a difference of 0.20%), Norwegian (1.7%, a difference of 0.36%), White/Caucasian (1.7%, a difference of 0.59%), and Dutch (1.7%, a difference of 0.62%).
| Demographics | Rating | Rank | Disability Age Under 5 |
| Seminole | 0.0 /100 | #304 | Tragic 1.6% |
| Blackfeet | 0.0 /100 | #305 | Tragic 1.6% |
| Creek | 0.0 /100 | #306 | Tragic 1.6% |
| Scottish | 0.0 /100 | #307 | Tragic 1.6% |
| Navajo | 0.0 /100 | #308 | Tragic 1.6% |
| Cape Verdeans | 0.0 /100 | #309 | Tragic 1.7% |
| Whites/Caucasians | 0.0 /100 | #310 | Tragic 1.7% |
| English | 0.0 /100 | #311 | Tragic 1.7% |
| Puerto Ricans | 0.0 /100 | #312 | Tragic 1.7% |
| Celtics | 0.0 /100 | #313 | Tragic 1.7% |
| Norwegians | 0.0 /100 | #314 | Tragic 1.7% |
| Dutch | 0.0 /100 | #315 | Tragic 1.7% |
| Immigrants from Cabo Verde | 0.0 /100 | #316 | Tragic 1.7% |
| French | 0.0 /100 | #317 | Tragic 1.7% |
| Irish | 0.0 /100 | #318 | Tragic 1.7% |
English Disability Age Under 5 Correlation Summary
| Measurement | English Data | Disability Age Under 5 Data |
| Minimum | 0.24% | 0.36% |
| Maximum | 61.5% | 100.0% |
| Range | 61.3% | 99.6% |
| Mean | 22.3% | 7.8% |
| Median | 21.5% | 1.9% |
| Interquartile 25% (IQ1) | 10.7% | 1.5% |
| Interquartile 75% (IQ3) | 32.1% | 3.2% |
| Interquartile Range (IQR) | 21.3% | 1.7% |
| Standard Deviation (Sample) | 14.1% | 17.9% |
| Standard Deviation (Population) | 14.0% | 17.8% |
Correlation Details
| English Percentile | Sample Size | Disability Age Under 5 |
[ 0.0% - 0.5% ] 0.24% | 11,560,519 | 1.4% |
[ 0.5% - 1.0% ] 0.77% | 5,804,459 | 1.5% |
[ 1.0% - 1.5% ] 1.24% | 6,517,302 | 1.5% |
[ 1.5% - 2.0% ] 1.85% | 15,096,155 | 0.90% |
[ 2.0% - 2.5% ] 2.22% | 7,095,520 | 1.6% |
[ 2.5% - 3.0% ] 2.79% | 6,863,167 | 1.4% |
[ 3.0% - 3.5% ] 3.21% | 12,896,725 | 1.2% |
[ 3.5% - 4.0% ] 3.77% | 9,731,464 | 1.3% |
[ 4.0% - 4.5% ] 4.24% | 8,140,186 | 1.5% |
[ 4.5% - 5.0% ] 4.71% | 10,164,981 | 1.3% |
[ 5.0% - 5.5% ] 5.24% | 9,797,068 | 1.3% |
[ 5.5% - 6.0% ] 5.74% | 8,940,234 | 1.5% |
[ 6.0% - 6.5% ] 6.28% | 10,939,084 | 1.7% |
[ 6.5% - 7.0% ] 6.75% | 13,201,266 | 1.2% |
[ 7.0% - 7.5% ] 7.27% | 10,020,528 | 1.5% |
[ 7.5% - 8.0% ] 7.72% | 8,644,321 | 1.7% |
[ 8.0% - 8.5% ] 8.25% | 8,827,539 | 1.5% |
[ 8.5% - 9.0% ] 8.73% | 9,000,280 | 1.5% |
[ 9.0% - 9.5% ] 9.26% | 9,586,587 | 1.5% |
[ 9.5% - 10.0% ] 9.73% | 9,173,821 | 1.6% |
[ 10.0% - 10.5% ] 10.24% | 8,190,597 | 1.6% |
[ 10.5% - 11.0% ] 10.75% | 8,387,299 | 1.7% |
[ 11.0% - 11.5% ] 11.25% | 6,901,192 | 1.8% |
[ 11.5% - 12.0% ] 11.73% | 7,369,529 | 1.5% |
[ 12.0% - 12.5% ] 12.26% | 4,880,070 | 1.8% |
[ 12.5% - 13.0% ] 12.73% | 5,307,854 | 1.8% |
[ 13.0% - 13.5% ] 13.25% | 4,170,473 | 2.0% |
[ 13.5% - 14.0% ] 13.76% | 3,612,306 | 1.8% |
[ 14.0% - 14.5% ] 14.26% | 2,976,002 | 1.8% |
[ 14.5% - 15.0% ] 14.74% | 2,763,410 | 2.1% |
[ 15.0% - 15.5% ] 15.24% | 2,265,996 | 2.6% |
[ 15.5% - 16.0% ] 15.71% | 1,999,540 | 2.1% |
[ 16.0% - 16.5% ] 16.28% | 1,431,115 | 2.2% |
[ 16.5% - 17.0% ] 16.76% | 947,454 | 2.5% |
[ 17.0% - 17.5% ] 17.25% | 1,091,413 | 2.3% |
[ 17.5% - 18.0% ] 17.74% | 996,756 | 1.5% |
[ 18.0% - 18.5% ] 18.30% | 961,404 | 2.0% |
[ 18.5% - 19.0% ] 18.69% | 316,298 | 3.6% |
[ 19.0% - 19.5% ] 19.21% | 511,148 | 1.8% |
[ 19.5% - 20.0% ] 19.76% | 136,250 | 2.9% |
[ 20.0% - 20.5% ] 20.24% | 331,452 | 3.8% |
[ 20.5% - 21.0% ] 20.71% | 176,085 | 4.1% |
[ 21.0% - 21.5% ] 21.22% | 316,268 | 2.6% |
[ 21.5% - 22.0% ] 21.85% | 82,418 | 5.1% |
[ 22.0% - 22.5% ] 22.19% | 309,189 | 2.2% |
[ 22.5% - 23.0% ] 22.71% | 83,595 | 4.0% |
[ 23.0% - 23.5% ] 23.26% | 114,783 | 6.0% |
[ 23.5% - 24.0% ] 23.75% | 187,971 | 2.2% |
[ 24.0% - 24.5% ] 24.29% | 137,602 | 1.9% |
[ 24.5% - 25.0% ] 24.69% | 151,757 | 1.9% |
[ 25.0% - 25.5% ] 25.23% | 266,068 | 1.9% |
[ 25.5% - 26.0% ] 25.67% | 105,779 | 1.6% |
[ 26.0% - 26.5% ] 26.23% | 144,356 | 1.2% |
[ 26.5% - 27.0% ] 26.78% | 436,479 | 0.51% |
[ 27.0% - 27.5% ] 27.17% | 92,096 | 2.5% |
[ 27.5% - 28.0% ] 27.65% | 51,482 | 2.9% |
[ 28.0% - 28.5% ] 28.30% | 72,069 | 2.5% |
[ 28.5% - 29.0% ] 28.80% | 19,429 | 2.9% |
[ 29.0% - 29.5% ] 29.29% | 187,377 | 1.4% |
[ 30.0% - 30.5% ] 30.00% | 100 | 44.4% |
[ 30.0% - 30.5% ] 30.03% | 18,279 | 3.2% |
[ 30.5% - 31.0% ] 30.70% | 87,938 | 1.5% |
[ 31.0% - 31.5% ] 31.18% | 111,553 | 1.6% |
[ 31.5% - 32.0% ] 31.83% | 119,574 | 0.36% |
[ 32.0% - 32.5% ] 32.09% | 54,699 | 0.76% |
[ 32.5% - 33.0% ] 32.58% | 32,666 | 2.0% |
[ 33.0% - 33.5% ] 33.32% | 5,658 | 18.5% |
[ 33.5% - 34.0% ] 33.88% | 1,883 | 10.5% |
[ 34.0% - 34.5% ] 34.14% | 25,046 | 1.5% |
[ 34.5% - 35.0% ] 34.55% | 179,106 | 0.69% |
[ 35.0% - 35.5% ] 35.26% | 1,855 | 1.4% |
[ 35.5% - 36.0% ] 35.86% | 92,383 | 0.37% |
[ 36.5% - 37.0% ] 36.73% | 1,451 | 1.9% |
[ 37.5% - 38.0% ] 37.72% | 1,681 | 46.4% |
[ 38.5% - 39.0% ] 38.52% | 1,041 | 8.9% |
[ 39.5% - 40.0% ] 39.50% | 929 | 10.8% |
[ 40.0% - 40.5% ] 40.49% | 452 | 13.6% |
[ 40.5% - 41.0% ] 40.57% | 2,815 | 8.5% |
[ 41.0% - 41.5% ] 41.14% | 1,089 | 32.4% |
[ 41.5% - 42.0% ] 41.78% | 663 | 3.4% |
[ 42.5% - 43.0% ] 42.72% | 419 | 50.0% |
[ 46.0% - 46.5% ] 46.19% | 617 | 31.6% |
[ 49.0% - 49.5% ] 49.42% | 172 | 50.0% |
[ 53.5% - 54.0% ] 53.67% | 1,008 | 2.2% |
[ 54.5% - 55.0% ] 54.55% | 33 | 100.0% |
[ 61.5% - 62.0% ] 61.54% | 26 | 100.0% |