Immigrants from Congo Disability Age Under 5

COMPARE

Immigrants from Congo
Race
Ancestry
AfghanAfricanAlaska NativeAlaskan AthabascanAlbanianAleutAlsatianAmericanApacheArabArapahoArgentineanArmenianAssyrian/Chaldean/SyriacAustralianAustrianBahamianBangladeshiBarbadianBasqueBelgianBelizeanBermudanBhutaneseBlackfeetBolivianBrazilianBritishBritish West IndianBulgarianBurmeseCajunCambodianCanadianCape VerdeanCarpatho RusynCelticCentral AmericanCentral American IndianCherokeeCheyenneChickasawChileanChineseChippewaChoctawColombianColvilleComancheCosta RicanCreeCreekCroatianCrowCubanCypriotCzechCzechoslovakianDanishDelawareDominicanDutchDutch West IndianEastern EuropeanEcuadorianEgyptianEnglishEstonianEthiopianEuropeanFijianFilipinoFinnishFrenchFrench American IndianFrench CanadianGermanGerman RussianGhanaianGreekGuamanian/ChamorroGuatemalanGuyaneseHaitianHmongHonduranHopiHoumaHungarianIcelanderIndian (Asian)IndonesianInupiatIranianIraqiIrishIroquoisIsraeliItalianJamaicanJapaneseJordanianKenyanKiowaKoreanLaotianLatvianLebaneseLiberianLithuanianLumbeeLuxembourgerMacedonianMalaysianMalteseMarshalleseMenomineeMexicanMexican American IndianMongolianMoroccanNative HawaiianNavajoNepaleseNew ZealanderNicaraguanNigerianNorthern EuropeanNorwegianOkinawanOsageOttawaPaiutePakistaniPalestinianPanamanianParaguayanPennsylvania GermanPeruvianPimaPolishPortuguesePotawatomiPuebloPuerto RicanPuget Sound SalishRomanianRussianSalvadoranSamoanScandinavianScotch-IrishScottishSeminoleSenegaleseSerbianShoshoneSierra LeoneanSiouxSlavicSlovakSloveneSomaliSouth AfricanSouth AmericanSouth American IndianSoviet UnionSpaniardSpanishSpanish AmericanSpanish American IndianSri LankanSubsaharan AfricanSudaneseSwedishSwissSyrianTaiwaneseThaiTlingit-HaidaTohono O'OdhamTonganTrinidadian and TobagonianTsimshianTurkishU.S. Virgin IslanderUgandanUkrainianUruguayanUteVenezuelanVietnameseWelshWest IndianYakamaYaquiYugoslavianYumanYup'ikZimbabwean
Immigration
NonimmigrantsImmigrantsAfghanistanAfricaAlbaniaArgentinaArmeniaAsiaAustraliaAustriaBahamasBangladeshBarbadosBelarusBelgiumBelizeBoliviaBosnia and HerzegovinaBrazilBulgariaBurma/MyanmarCabo VerdeCambodiaCameroonCanadaCaribbeanCentral AmericaChileChinaColombiaCongoCosta RicaCroatiaCubaCzechoslovakiaDenmarkDominicaDominican RepublicEastern AfricaEastern AsiaEastern EuropeEcuadorEgyptEl SalvadorEnglandEritreaEthiopiaEuropeFijiFranceGermanyGhanaGreeceGrenadaGuatemalaGuyanaHaitiHondurasHong KongHungaryIndiaIndonesiaIranIraqIrelandIsraelItalyJamaicaJapanJordanKazakhstanKenyaKoreaKuwaitLaosLatin AmericaLatviaLebanonLiberiaLithuaniaMalaysiaMexicoMicronesiaMiddle AfricaMoldovaMoroccoNepalNetherlandsNicaraguaNigeriaNorth AmericaNorth MacedoniaNorthern AfricaNorthern EuropeNorwayOceaniaPakistanPanamaPeruPhilippinesPolandPortugalRomaniaRussiaSaudi ArabiaScotlandSenegalSerbiaSierra LeoneSingaporeSomaliaSouth AfricaSouth AmericaSouth Central AsiaSouth Eastern AsiaSouthern EuropeSpainSri LankaSt. Vincent and the GrenadinesSudanSwedenSwitzerlandSyriaTaiwanThailandTrinidad and TobagoTurkeyUgandaUkraineUruguayUzbekistanVenezuelaVietnamWest IndiesWestern AfricaWestern AsiaWestern EuropeYemenZaireZimbabweAzores
Select to Compare
Race
Ancestry
AfghanAfricanAlaska NativeAlaskan AthabascanAlbanianAleutAlsatianAmericanApacheArabArapahoArgentineanArmenianAssyrian/Chaldean/SyriacAustralianAustrianBahamianBangladeshiBarbadianBasqueBelgianBelizeanBermudanBhutaneseBlackfeetBolivianBrazilianBritishBritish West IndianBulgarianBurmeseCajunCambodianCanadianCape VerdeanCarpatho RusynCelticCentral AmericanCentral American IndianCherokeeCheyenneChickasawChileanChineseChippewaChoctawColombianColvilleComancheCosta RicanCreeCreekCroatianCrowCubanCypriotCzechCzechoslovakianDanishDelawareDominicanDutchDutch West IndianEastern EuropeanEcuadorianEgyptianEnglishEstonianEthiopianEuropeanFijianFilipinoFinnishFrenchFrench American IndianFrench CanadianGermanGerman RussianGhanaianGreekGuamanian/ChamorroGuatemalanGuyaneseHaitianHmongHonduranHopiHoumaHungarianIcelanderIndian (Asian)IndonesianInupiatIranianIraqiIrishIroquoisIsraeliItalianJamaicanJapaneseJordanianKenyanKiowaKoreanLaotianLatvianLebaneseLiberianLithuanianLumbeeLuxembourgerMacedonianMalaysianMalteseMarshalleseMenomineeMexicanMexican American IndianMongolianMoroccanNative HawaiianNavajoNepaleseNew ZealanderNicaraguanNigerianNorthern EuropeanNorwegianOkinawanOsageOttawaPaiutePakistaniPalestinianPanamanianParaguayanPennsylvania GermanPeruvianPimaPolishPortuguesePotawatomiPuebloPuerto RicanPuget Sound SalishRomanianRussianSalvadoranSamoanScandinavianScotch-IrishScottishSeminoleSenegaleseSerbianShoshoneSierra LeoneanSiouxSlavicSlovakSloveneSomaliSouth AfricanSouth AmericanSouth American IndianSoviet UnionSpaniardSpanishSpanish AmericanSpanish American IndianSri LankanSubsaharan AfricanSudaneseSwedishSwissSyrianTaiwaneseThaiTlingit-HaidaTohono O'OdhamTonganTrinidadian and TobagonianTsimshianTurkishU.S. Virgin IslanderUgandanUkrainianUruguayanUteVenezuelanVietnameseWelshWest IndianYakamaYaquiYugoslavianYumanYup'ikZimbabwean
Immigration
NonimmigrantsImmigrantsAfghanistanAfricaAlbaniaArgentinaArmeniaAsiaAustraliaAustriaBahamasBangladeshBarbadosBelarusBelgiumBelizeBoliviaBosnia and HerzegovinaBrazilBulgariaBurma/MyanmarCabo VerdeCambodiaCameroonCanadaCaribbeanCentral AmericaChileChinaColombiaCosta RicaCroatiaCubaCzechoslovakiaDenmarkDominicaDominican RepublicEastern AfricaEastern AsiaEastern EuropeEcuadorEgyptEl SalvadorEnglandEritreaEthiopiaEuropeFijiFranceGermanyGhanaGreeceGrenadaGuatemalaGuyanaHaitiHondurasHong KongHungaryIndiaIndonesiaIranIraqIrelandIsraelItalyJamaicaJapanJordanKazakhstanKenyaKoreaKuwaitLaosLatin AmericaLatviaLebanonLiberiaLithuaniaMalaysiaMexicoMicronesiaMiddle AfricaMoldovaMoroccoNepalNetherlandsNicaraguaNigeriaNorth AmericaNorth MacedoniaNorthern AfricaNorthern EuropeNorwayOceaniaPakistanPanamaPeruPhilippinesPolandPortugalRomaniaRussiaSaudi ArabiaScotlandSenegalSerbiaSierra LeoneSingaporeSomaliaSouth AfricaSouth AmericaSouth Central AsiaSouth Eastern AsiaSouthern EuropeSpainSri LankaSt. Vincent and the GrenadinesSudanSwedenSwitzerlandSyriaTaiwanThailandTrinidad and TobagoTurkeyUgandaUkraineUruguayUzbekistanVenezuelaVietnamWest IndiesWestern AfricaWestern AsiaWestern EuropeYemenZaireZimbabweAzores
Disability Age Under 5
Income
Poverty
Unemployment
Labor Participation
Family Structure
Vehicle Availability
Education Level
Disability

Immigrants from Congo Disability Age Under 5
Exceptional

1.1%
DISABILITY | AGE UNDER 5
99.8/ 100
METRIC RATING
46th/ 347
METRIC RANK

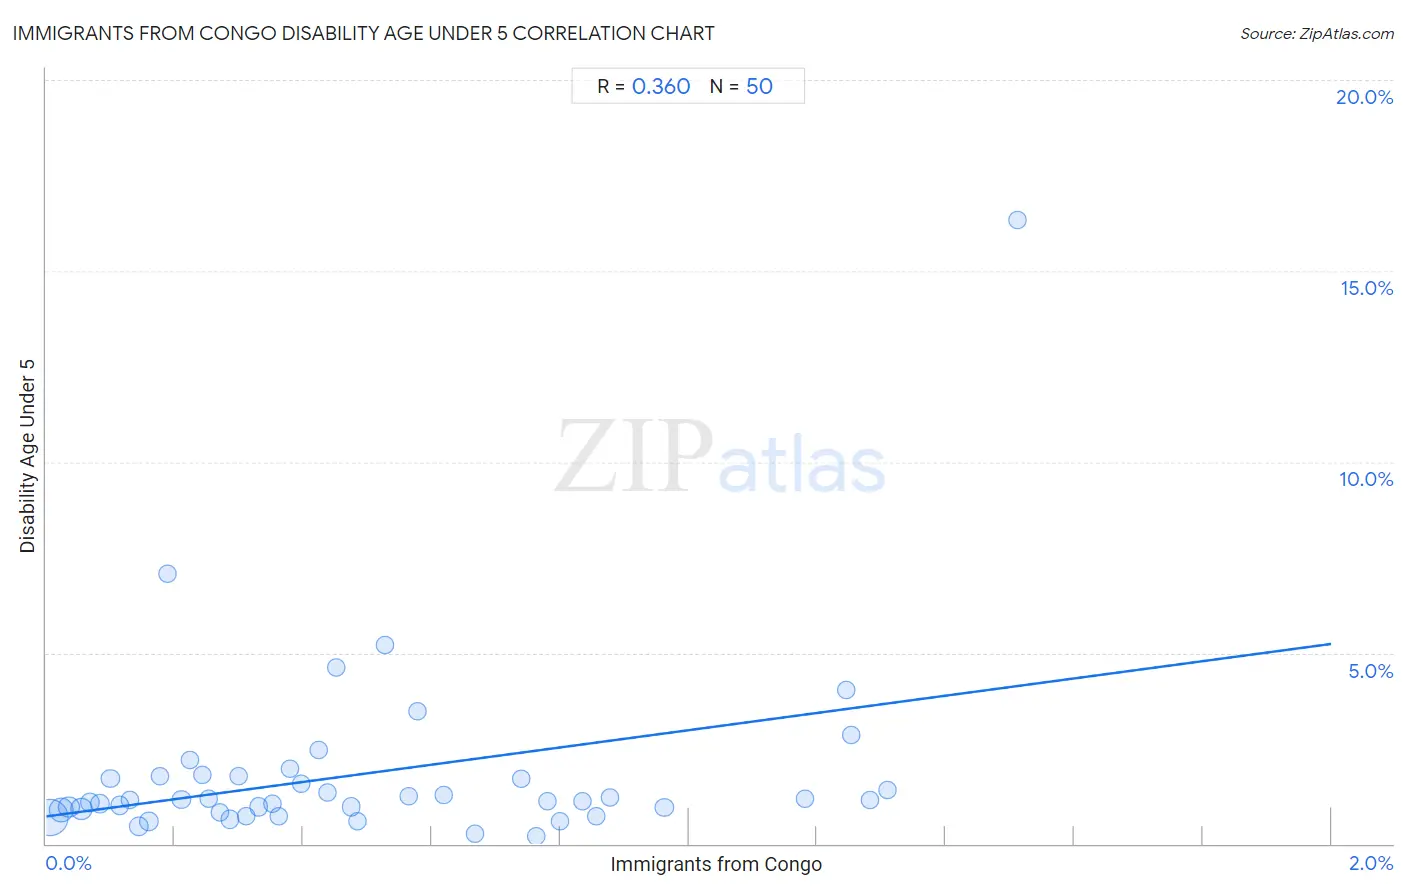
Immigrants from Congo Disability Age Under 5 Correlation Chart

The statistical analysis conducted on geographies consisting of 74,886,449 people shows a mild positive correlation between the proportion of Immigrants from Congo and percentage of population with a disability under the age of 5 in the United States with a correlation coefficient (R) of 0.360 and weighted average of 1.1%. On average, for every 1% (one percent) increase in Immigrants from Congo within a typical geography, there is an increase of 2.3% in percentage of population with a disability under the age of 5.
Immigrants from Congo Disability Age Under 5
It is essential to understand that the correlation between the percentage of Immigrants from Congo and percentage of population with a disability under the age of 5 does not imply a direct cause-and-effect relationship. It remains uncertain whether the presence of Immigrants from Congo influences an upward or downward trend in the level of percentage of population with a disability under the age of 5 within an area, or if Immigrants from Congo simply ended up residing in those areas with higher or lower levels of percentage of population with a disability under the age of 5 due to other factors.

Demographics Similar to Immigrants from Congo by Disability Age Under 5

In terms of disability age under 5, the demographic groups most similar to Immigrants from Congo are Immigrants from Sweden (1.1%, a difference of 0.14%), Immigrants from Singapore (1.1%, a difference of 0.36%), Immigrants from Turkey (1.1%, a difference of 0.40%), Immigrants from Russia (1.1%, a difference of 0.57%), and Immigrants from Japan (1.1%, a difference of 0.58%).
DemographicsRating | RankDisability Age Under 5
Filipinos
99.9
/100
|
#39
Exceptional
1.1%
Immigrants from Albania
99.9
/100
|
#40
Exceptional
1.1%
Thais
99.8
/100
|
#41
Exceptional
1.1%
Immigrants from Bulgaria
99.8
/100
|
#42
Exceptional
1.1%
Pima
99.8
/100
|
#43
Exceptional
1.1%
Immigrants from Asia
99.8
/100
|
#44
Exceptional
1.1%
Immigrants from Turkey
99.8
/100
|
#45
Exceptional
1.1%
Immigrants from Congo
99.8
/100
|
#46
Exceptional
1.1%
Immigrants from Sweden
99.8
/100
|
#47
Exceptional
1.1%
Immigrants from Singapore
99.7
/100
|
#48
Exceptional
1.1%
Immigrants from Russia
99.7
/100
|
#49
Exceptional
1.1%
Immigrants from Japan
99.7
/100
|
#50
Exceptional
1.1%
Immigrants from Kazakhstan
99.7
/100
|
#51
Exceptional
1.1%
Immigrants from Bolivia
99.6
/100
|
#52
Exceptional
1.1%
Asians
99.6
/100
|
#53
Exceptional
1.1%

Immigrants from Congo Disability Age Under 5 Correlation Summary

MeasurementImmigrants from Congo DataDisability Age Under 5 Data
Minimum0.0061%0.19%
Maximum1.5%16.3%
Range1.5%16.1%
Mean0.50%1.8%
Median0.39%1.2%
Interquartile 25% (IQ1)0.19%0.89%
Interquartile 75% (IQ3)0.76%1.8%
Interquartile Range (IQR)0.57%0.87%
Standard Deviation (Sample)0.39%2.5%
Standard Deviation (Population)0.39%2.4%

Correlation Details

Immigrants from Congo PercentileSample SizeDisability Age Under 5
[
0.0%
-
0.5%
]
0.0061%
34,327,7770.70%
[
0.0%
-
0.5%
]
0.023%
11,417,0050.89%
[
0.0%
-
0.5%
]
0.035%
6,096,1390.97%
[
0.0%
-
0.5%
]
0.055%
6,144,9160.90%
[
0.0%
-
0.5%
]
0.069%
2,505,5971.1%
[
0.0%
-
0.5%
]
0.083%
2,639,4251.0%
[
0.0%
-
0.5%
]
0.100%
875,3311.7%
[
0.0%
-
0.5%
]
0.12%
797,1541.0%
[
0.0%
-
0.5%
]
0.13%
292,3501.2%
[
0.0%
-
0.5%
]
0.14%
2,028,4530.44%
[
0.0%
-
0.5%
]
0.16%
1,807,3300.58%
[
0.0%
-
0.5%
]
0.18%
191,8971.8%
[
0.0%
-
0.5%
]
0.19%
32,2877.1%
[
0.0%
-
0.5%
]
0.21%
1,717,9061.2%
[
0.0%
-
0.5%
]
0.22%
163,5552.2%
[
0.0%
-
0.5%
]
0.24%
484,5221.8%
[
0.0%
-
0.5%
]
0.25%
277,4461.2%
[
0.0%
-
0.5%
]
0.27%
351,9150.82%
[
0.0%
-
0.5%
]
0.29%
320,9410.64%
[
0.0%
-
0.5%
]
0.30%
363,4861.8%
[
0.0%
-
0.5%
]
0.31%
306,1670.73%
[
0.0%
-
0.5%
]
0.33%
128,5220.97%
[
0.0%
-
0.5%
]
0.35%
234,2741.0%
[
0.0%
-
0.5%
]
0.36%
29,2150.71%
[
0.0%
-
0.5%
]
0.38%
68,3742.0%
[
0.0%
-
0.5%
]
0.40%
180,2421.6%
[
0.0%
-
0.5%
]
0.42%
86,4022.5%
[
0.0%
-
0.5%
]
0.44%
35,4661.3%
[
0.0%
-
0.5%
]
0.45%
10,8364.6%
[
0.0%
-
0.5%
]
0.47%
129,3750.97%
[
0.0%
-
0.5%
]
0.48%
75,2420.59%
[
0.5%
-
1.0%
]
0.53%
6,6305.2%
[
0.5%
-
1.0%
]
0.56%
93,3171.2%
[
0.5%
-
1.0%
]
0.58%
27,6523.5%
[
0.5%
-
1.0%
]
0.62%
31,8921.3%
[
0.5%
-
1.0%
]
0.67%
69,4560.26%
[
0.5%
-
1.0%
]
0.74%
26,4081.7%
[
0.5%
-
1.0%
]
0.76%
96,5590.19%
[
0.5%
-
1.0%
]
0.78%
82,7341.1%
[
0.5%
-
1.0%
]
0.80%
39,3730.59%
[
0.5%
-
1.0%
]
0.83%
26,8371.1%
[
0.5%
-
1.0%
]
0.86%
18,7030.73%
[
0.5%
-
1.0%
]
0.88%
47,1541.2%
[
0.5%
-
1.0%
]
0.96%
90,2270.96%
[
1.0%
-
1.5%
]
1.18%
19,1441.2%
[
1.0%
-
1.5%
]
1.24%
13,8184.0%
[
1.0%
-
1.5%
]
1.25%
35,6842.8%
[
1.0%
-
1.5%
]
1.28%
24,8921.2%
[
1.0%
-
1.5%
]
1.31%
13,5101.4%
[
1.5%
-
2.0%
]
1.51%
2,91216.3%