Jordanian Disability Age Under 5

COMPARE

Jordanian
Race
Ancestry
AfghanAfricanAlaska NativeAlaskan AthabascanAlbanianAleutAlsatianAmericanApacheArabArapahoArgentineanArmenianAssyrian/Chaldean/SyriacAustralianAustrianBahamianBangladeshiBarbadianBasqueBelgianBelizeanBermudanBhutaneseBlackfeetBolivianBrazilianBritishBritish West IndianBulgarianBurmeseCajunCambodianCanadianCape VerdeanCarpatho RusynCelticCentral AmericanCentral American IndianCherokeeCheyenneChickasawChileanChineseChippewaChoctawColombianColvilleComancheCosta RicanCreeCreekCroatianCrowCubanCypriotCzechCzechoslovakianDanishDelawareDominicanDutchDutch West IndianEastern EuropeanEcuadorianEgyptianEnglishEstonianEthiopianEuropeanFijianFilipinoFinnishFrenchFrench American IndianFrench CanadianGermanGerman RussianGhanaianGreekGuamanian/ChamorroGuatemalanGuyaneseHaitianHmongHonduranHopiHoumaHungarianIcelanderIndian (Asian)IndonesianInupiatIranianIraqiIrishIroquoisIsraeliItalianJamaicanJapaneseJordanianKenyanKiowaKoreanLaotianLatvianLebaneseLiberianLithuanianLumbeeLuxembourgerMacedonianMalaysianMalteseMarshalleseMenomineeMexicanMexican American IndianMongolianMoroccanNative HawaiianNavajoNepaleseNew ZealanderNicaraguanNigerianNorthern EuropeanNorwegianOkinawanOsageOttawaPaiutePakistaniPalestinianPanamanianParaguayanPennsylvania GermanPeruvianPimaPolishPortuguesePotawatomiPuebloPuerto RicanPuget Sound SalishRomanianRussianSalvadoranSamoanScandinavianScotch-IrishScottishSeminoleSenegaleseSerbianShoshoneSierra LeoneanSiouxSlavicSlovakSloveneSomaliSouth AfricanSouth AmericanSouth American IndianSoviet UnionSpaniardSpanishSpanish AmericanSpanish American IndianSri LankanSubsaharan AfricanSudaneseSwedishSwissSyrianTaiwaneseThaiTlingit-HaidaTohono O'OdhamTonganTrinidadian and TobagonianTsimshianTurkishU.S. Virgin IslanderUgandanUkrainianUruguayanUteVenezuelanVietnameseWelshWest IndianYakamaYaquiYugoslavianYumanYup'ikZimbabwean
Immigration
NonimmigrantsImmigrantsAfghanistanAfricaAlbaniaArgentinaArmeniaAsiaAustraliaAustriaBahamasBangladeshBarbadosBelarusBelgiumBelizeBoliviaBosnia and HerzegovinaBrazilBulgariaBurma/MyanmarCabo VerdeCambodiaCameroonCanadaCaribbeanCentral AmericaChileChinaColombiaCongoCosta RicaCroatiaCubaCzechoslovakiaDenmarkDominicaDominican RepublicEastern AfricaEastern AsiaEastern EuropeEcuadorEgyptEl SalvadorEnglandEritreaEthiopiaEuropeFijiFranceGermanyGhanaGreeceGrenadaGuatemalaGuyanaHaitiHondurasHong KongHungaryIndiaIndonesiaIranIraqIrelandIsraelItalyJamaicaJapanJordanKazakhstanKenyaKoreaKuwaitLaosLatin AmericaLatviaLebanonLiberiaLithuaniaMalaysiaMexicoMicronesiaMiddle AfricaMoldovaMoroccoNepalNetherlandsNicaraguaNigeriaNorth AmericaNorth MacedoniaNorthern AfricaNorthern EuropeNorwayOceaniaPakistanPanamaPeruPhilippinesPolandPortugalRomaniaRussiaSaudi ArabiaScotlandSenegalSerbiaSierra LeoneSingaporeSomaliaSouth AfricaSouth AmericaSouth Central AsiaSouth Eastern AsiaSouthern EuropeSpainSri LankaSt. Vincent and the GrenadinesSudanSwedenSwitzerlandSyriaTaiwanThailandTrinidad and TobagoTurkeyUgandaUkraineUruguayUzbekistanVenezuelaVietnamWest IndiesWestern AfricaWestern AsiaWestern EuropeYemenZaireZimbabweAzores
Select to Compare
Race
Ancestry
AfghanAfricanAlaska NativeAlaskan AthabascanAlbanianAleutAlsatianAmericanApacheArabArapahoArgentineanArmenianAssyrian/Chaldean/SyriacAustralianAustrianBahamianBangladeshiBarbadianBasqueBelgianBelizeanBermudanBhutaneseBlackfeetBolivianBrazilianBritishBritish West IndianBulgarianBurmeseCajunCambodianCanadianCape VerdeanCarpatho RusynCelticCentral AmericanCentral American IndianCherokeeCheyenneChickasawChileanChineseChippewaChoctawColombianColvilleComancheCosta RicanCreeCreekCroatianCrowCubanCypriotCzechCzechoslovakianDanishDelawareDominicanDutchDutch West IndianEastern EuropeanEcuadorianEgyptianEnglishEstonianEthiopianEuropeanFijianFilipinoFinnishFrenchFrench American IndianFrench CanadianGermanGerman RussianGhanaianGreekGuamanian/ChamorroGuatemalanGuyaneseHaitianHmongHonduranHopiHoumaHungarianIcelanderIndian (Asian)IndonesianInupiatIranianIraqiIrishIroquoisIsraeliItalianJamaicanJapaneseKenyanKiowaKoreanLaotianLatvianLebaneseLiberianLithuanianLumbeeLuxembourgerMacedonianMalaysianMalteseMarshalleseMenomineeMexicanMexican American IndianMongolianMoroccanNative HawaiianNavajoNepaleseNew ZealanderNicaraguanNigerianNorthern EuropeanNorwegianOkinawanOsageOttawaPaiutePakistaniPalestinianPanamanianParaguayanPennsylvania GermanPeruvianPimaPolishPortuguesePotawatomiPuebloPuerto RicanPuget Sound SalishRomanianRussianSalvadoranSamoanScandinavianScotch-IrishScottishSeminoleSenegaleseSerbianShoshoneSierra LeoneanSiouxSlavicSlovakSloveneSomaliSouth AfricanSouth AmericanSouth American IndianSoviet UnionSpaniardSpanishSpanish AmericanSpanish American IndianSri LankanSubsaharan AfricanSudaneseSwedishSwissSyrianTaiwaneseThaiTlingit-HaidaTohono O'OdhamTonganTrinidadian and TobagonianTsimshianTurkishU.S. Virgin IslanderUgandanUkrainianUruguayanUteVenezuelanVietnameseWelshWest IndianYakamaYaquiYugoslavianYumanYup'ikZimbabwean
Immigration
NonimmigrantsImmigrantsAfghanistanAfricaAlbaniaArgentinaArmeniaAsiaAustraliaAustriaBahamasBangladeshBarbadosBelarusBelgiumBelizeBoliviaBosnia and HerzegovinaBrazilBulgariaBurma/MyanmarCabo VerdeCambodiaCameroonCanadaCaribbeanCentral AmericaChileChinaColombiaCongoCosta RicaCroatiaCubaCzechoslovakiaDenmarkDominicaDominican RepublicEastern AfricaEastern AsiaEastern EuropeEcuadorEgyptEl SalvadorEnglandEritreaEthiopiaEuropeFijiFranceGermanyGhanaGreeceGrenadaGuatemalaGuyanaHaitiHondurasHong KongHungaryIndiaIndonesiaIranIraqIrelandIsraelItalyJamaicaJapanJordanKazakhstanKenyaKoreaKuwaitLaosLatin AmericaLatviaLebanonLiberiaLithuaniaMalaysiaMexicoMicronesiaMiddle AfricaMoldovaMoroccoNepalNetherlandsNicaraguaNigeriaNorth AmericaNorth MacedoniaNorthern AfricaNorthern EuropeNorwayOceaniaPakistanPanamaPeruPhilippinesPolandPortugalRomaniaRussiaSaudi ArabiaScotlandSenegalSerbiaSierra LeoneSingaporeSomaliaSouth AfricaSouth AmericaSouth Central AsiaSouth Eastern AsiaSouthern EuropeSpainSri LankaSt. Vincent and the GrenadinesSudanSwedenSwitzerlandSyriaTaiwanThailandTrinidad and TobagoTurkeyUgandaUkraineUruguayUzbekistanVenezuelaVietnamWest IndiesWestern AfricaWestern AsiaWestern EuropeYemenZaireZimbabweAzores
Disability Age Under 5
Income
Poverty
Unemployment
Labor Participation
Family Structure
Vehicle Availability
Education Level
Disability

Jordanian Disability Age Under 5
Exceptional

1.1%
DISABILITY | AGE UNDER 5
98.5/ 100
METRIC RATING
74th/ 347
METRIC RANK

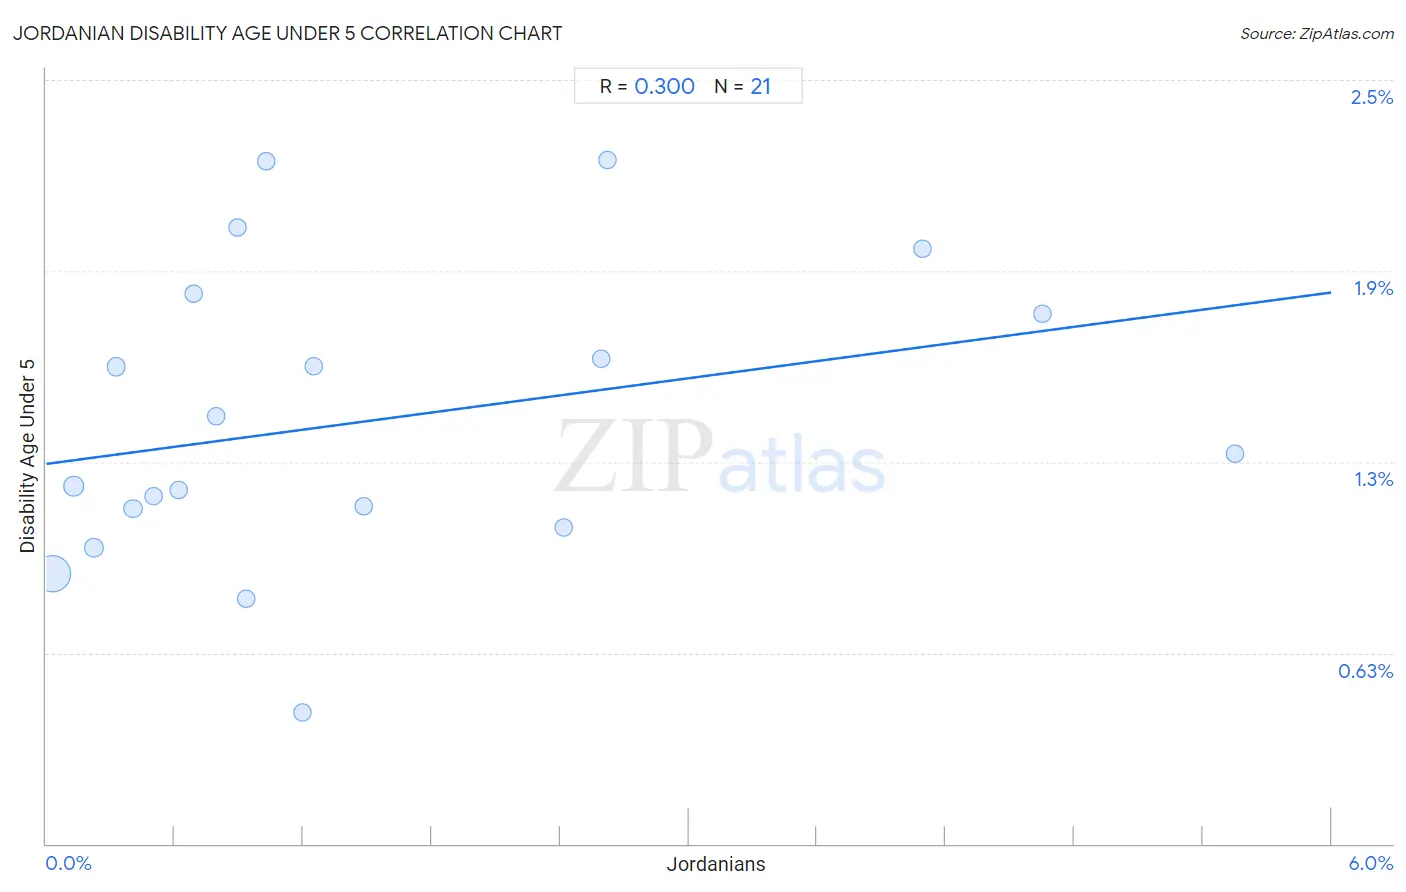
Jordanian Disability Age Under 5 Correlation Chart

The statistical analysis conducted on geographies consisting of 116,567,242 people shows a mild positive correlation between the proportion of Jordanians and percentage of population with a disability under the age of 5 in the United States with a correlation coefficient (R) of 0.300 and weighted average of 1.1%. On average, for every 1% (one percent) increase in Jordanians within a typical geography, there is an increase of 0.093% in percentage of population with a disability under the age of 5.
Jordanian Disability Age Under 5
It is essential to understand that the correlation between the percentage of Jordanians and percentage of population with a disability under the age of 5 does not imply a direct cause-and-effect relationship. It remains uncertain whether the presence of Jordanians influences an upward or downward trend in the level of percentage of population with a disability under the age of 5 within an area, or if Jordanians simply ended up residing in those areas with higher or lower levels of percentage of population with a disability under the age of 5 due to other factors.

Demographics Similar to Jordanians by Disability Age Under 5

In terms of disability age under 5, the demographic groups most similar to Jordanians are Immigrants from Sri Lanka (1.1%, a difference of 0.0%), Burmese (1.1%, a difference of 0.090%), Immigrants from Pakistan (1.1%, a difference of 0.090%), Trinidadian and Tobagonian (1.1%, a difference of 0.25%), and Immigrants from Ecuador (1.1%, a difference of 0.31%).
DemographicsRating | RankDisability Age Under 5
Immigrants from Belize
98.7
/100
|
#67
Exceptional
1.1%
South Africans
98.7
/100
|
#68
Exceptional
1.1%
Israelis
98.7
/100
|
#69
Exceptional
1.1%
Immigrants from Ecuador
98.6
/100
|
#70
Exceptional
1.1%
Trinidadians and Tobagonians
98.6
/100
|
#71
Exceptional
1.1%
Burmese
98.5
/100
|
#72
Exceptional
1.1%
Immigrants from Sri Lanka
98.5
/100
|
#73
Exceptional
1.1%
Jordanians
98.5
/100
|
#74
Exceptional
1.1%
Immigrants from Pakistan
98.4
/100
|
#75
Exceptional
1.1%
Immigrants from Burma/Myanmar
98.2
/100
|
#76
Exceptional
1.1%
Immigrants from Denmark
98.1
/100
|
#77
Exceptional
1.1%
West Indians
98.0
/100
|
#78
Exceptional
1.1%
Hmong
98.0
/100
|
#79
Exceptional
1.1%
Immigrants from Trinidad and Tobago
98.0
/100
|
#80
Exceptional
1.1%
Turks
98.0
/100
|
#81
Exceptional
1.1%

Jordanian Disability Age Under 5 Correlation Summary

MeasurementJordanian DataDisability Age Under 5 Data
Minimum0.032%0.43%
Maximum5.6%2.2%
Range5.5%1.8%
Mean1.5%1.4%
Median0.93%1.3%
Interquartile 25% (IQ1)0.45%1.1%
Interquartile 75% (IQ3)2.5%1.8%
Interquartile Range (IQR)2.0%0.70%
Standard Deviation (Sample)1.6%0.48%
Standard Deviation (Population)1.5%0.47%

Correlation Details

Jordanian PercentileSample SizeDisability Age Under 5
[
0.0%
-
0.5%
]
0.032%
94,616,8020.88%
[
0.0%
-
0.5%
]
0.13%
12,641,6361.2%
[
0.0%
-
0.5%
]
0.22%
4,238,6470.97%
[
0.0%
-
0.5%
]
0.33%
1,019,7351.6%
[
0.0%
-
0.5%
]
0.41%
1,057,3651.1%
[
0.5%
-
1.0%
]
0.50%
1,245,5901.1%
[
0.5%
-
1.0%
]
0.62%
383,0901.2%
[
0.5%
-
1.0%
]
0.69%
397,3211.8%
[
0.5%
-
1.0%
]
0.79%
397,5251.4%
[
0.5%
-
1.0%
]
0.89%
108,1662.0%
[
0.5%
-
1.0%
]
0.93%
203,5670.80%
[
1.0%
-
1.5%
]
1.03%
37,9672.2%
[
1.0%
-
1.5%
]
1.19%
38,8610.43%
[
1.0%
-
1.5%
]
1.25%
2,0851.6%
[
1.0%
-
1.5%
]
1.48%
45,4621.1%
[
2.0%
-
2.5%
]
2.42%
4,5111.0%
[
2.5%
-
3.0%
]
2.59%
23,1731.6%
[
2.5%
-
3.0%
]
2.62%
38,1442.2%
[
4.0%
-
4.5%
]
4.09%
38,0101.9%
[
4.5%
-
5.0%
]
4.65%
19,6251.7%
[
5.5%
-
6.0%
]
5.55%
9,9601.3%