Chickasaw Disability Age 5 to 17
COMPARE
Chickasaw
Select to Compare
Disability Age 5 to 17
Chickasaw Disability Age 5 to 17
6.8%
DISABILITY | AGE 5 TO 17
0.0/ 100
METRIC RATING
336th/ 347
METRIC RANK
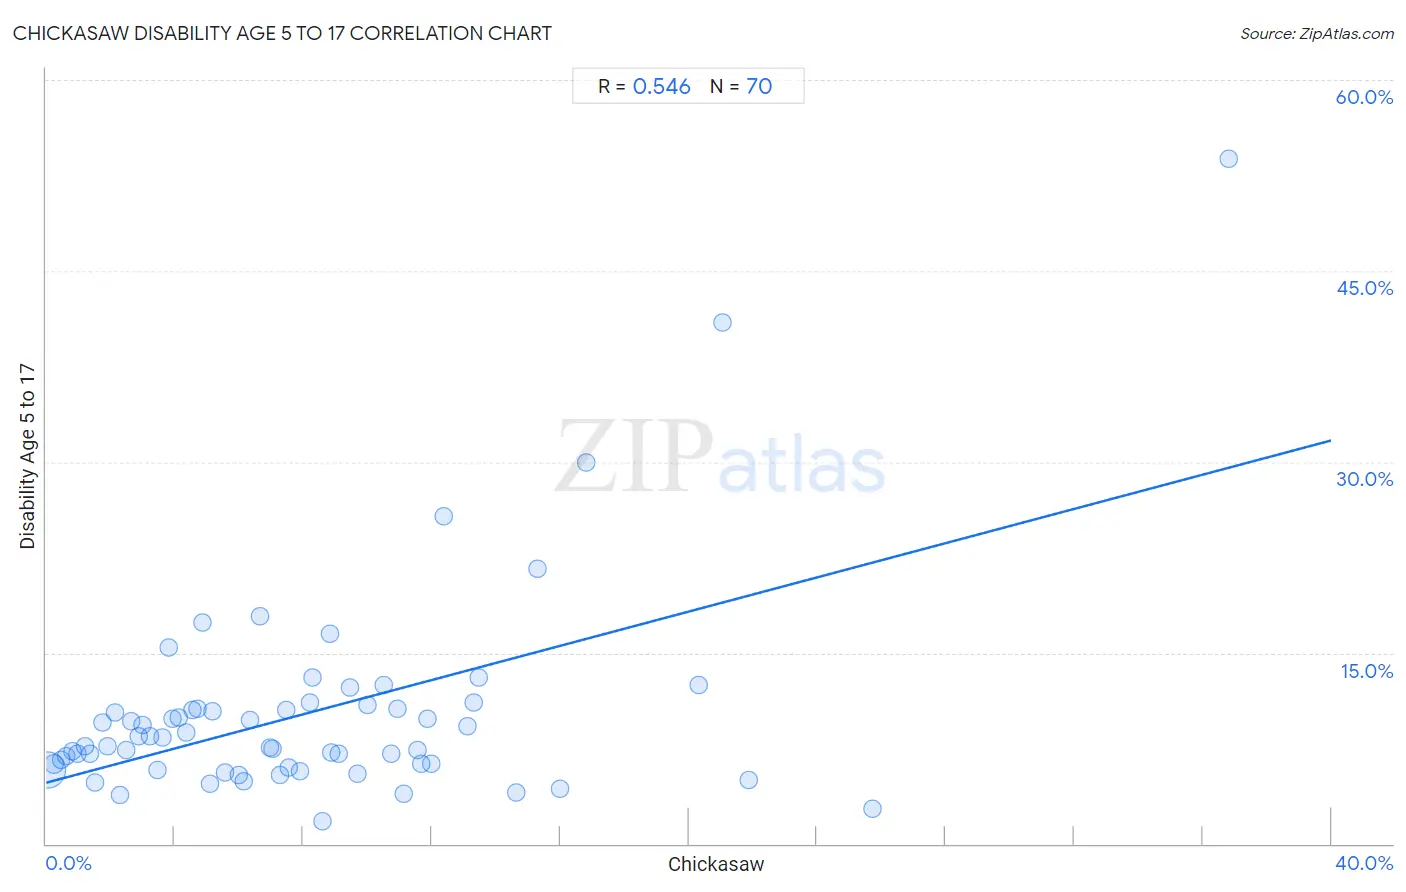
Chickasaw Disability Age 5 to 17 Correlation Chart
The statistical analysis conducted on geographies consisting of 147,149,878 people shows a substantial positive correlation between the proportion of Chickasaw and percentage of population with a disability between the ages 5 and 17 in the United States with a correlation coefficient (R) of 0.546 and weighted average of 6.8%. On average, for every 1% (one percent) increase in Chickasaw within a typical geography, there is an increase of 0.67% in percentage of population with a disability between the ages 5 and 17.
It is essential to understand that the correlation between the percentage of Chickasaw and percentage of population with a disability between the ages 5 and 17 does not imply a direct cause-and-effect relationship. It remains uncertain whether the presence of Chickasaw influences an upward or downward trend in the level of percentage of population with a disability between the ages 5 and 17 within an area, or if Chickasaw simply ended up residing in those areas with higher or lower levels of percentage of population with a disability between the ages 5 and 17 due to other factors.
Demographics Similar to Chickasaw by Disability Age 5 to 17
In terms of disability age 5 to 17, the demographic groups most similar to Chickasaw are Creek (6.9%, a difference of 0.43%), Ottawa (6.8%, a difference of 0.50%), Iroquois (6.9%, a difference of 0.68%), Choctaw (6.9%, a difference of 1.0%), and Seminole (6.8%, a difference of 1.2%).
| Demographics | Rating | Rank | Disability Age 5 to 17 |
| Blackfeet | 0.0 /100 | #329 | Tragic 6.6% |
| Dutch West Indians | 0.0 /100 | #330 | Tragic 6.7% |
| French Canadians | 0.0 /100 | #331 | Tragic 6.7% |
| Immigrants from the Azores | 0.0 /100 | #332 | Tragic 6.7% |
| Blacks/African Americans | 0.0 /100 | #333 | Tragic 6.8% |
| Seminole | 0.0 /100 | #334 | Tragic 6.8% |
| Ottawa | 0.0 /100 | #335 | Tragic 6.8% |
| Chickasaw | 0.0 /100 | #336 | Tragic 6.8% |
| Creek | 0.0 /100 | #337 | Tragic 6.9% |
| Iroquois | 0.0 /100 | #338 | Tragic 6.9% |
| Choctaw | 0.0 /100 | #339 | Tragic 6.9% |
| Cherokee | 0.0 /100 | #340 | Tragic 6.9% |
| Cape Verdeans | 0.0 /100 | #341 | Tragic 7.0% |
| Chippewa | 0.0 /100 | #342 | Tragic 7.1% |
| Immigrants from Cabo Verde | 0.0 /100 | #343 | Tragic 7.1% |
Chickasaw Disability Age 5 to 17 Correlation Summary
| Measurement | Chickasaw Data | Disability Age 5 to 17 Data |
| Minimum | 0.032% | 1.8% |
| Maximum | 36.8% | 53.8% |
| Range | 36.8% | 52.1% |
| Mean | 8.1% | 10.2% |
| Median | 7.0% | 8.0% |
| Interquartile 25% (IQ1) | 3.2% | 6.0% |
| Interquartile 75% (IQ3) | 11.1% | 10.6% |
| Interquartile Range (IQR) | 7.9% | 4.7% |
| Standard Deviation (Sample) | 6.6% | 8.1% |
| Standard Deviation (Population) | 6.6% | 8.1% |
Correlation Details
| Chickasaw Percentile | Sample Size | Disability Age 5 to 17 |
[ 0.0% - 0.5% ] 0.032% | 136,391,797 | 5.8% |
[ 0.0% - 0.5% ] 0.25% | 5,209,246 | 6.3% |
[ 0.0% - 0.5% ] 0.45% | 1,532,192 | 6.6% |
[ 0.5% - 1.0% ] 0.60% | 1,574,548 | 6.9% |
[ 0.5% - 1.0% ] 0.83% | 807,786 | 7.2% |
[ 0.5% - 1.0% ] 0.99% | 473,115 | 7.0% |
[ 1.0% - 1.5% ] 1.19% | 225,883 | 7.7% |
[ 1.0% - 1.5% ] 1.35% | 244,926 | 7.1% |
[ 1.5% - 2.0% ] 1.54% | 86,770 | 4.9% |
[ 1.5% - 2.0% ] 1.74% | 74,952 | 9.5% |
[ 1.5% - 2.0% ] 1.92% | 50,476 | 7.7% |
[ 2.0% - 2.5% ] 2.13% | 45,592 | 10.3% |
[ 2.0% - 2.5% ] 2.28% | 52,179 | 3.8% |
[ 2.5% - 3.0% ] 2.51% | 15,979 | 7.4% |
[ 2.5% - 3.0% ] 2.66% | 13,423 | 9.6% |
[ 2.5% - 3.0% ] 2.88% | 65,291 | 8.4% |
[ 2.5% - 3.0% ] 3.00% | 16,739 | 9.3% |
[ 3.0% - 3.5% ] 3.24% | 15,553 | 8.5% |
[ 3.0% - 3.5% ] 3.46% | 7,995 | 5.8% |
[ 3.5% - 4.0% ] 3.61% | 5,046 | 8.4% |
[ 3.5% - 4.0% ] 3.83% | 1,358 | 15.4% |
[ 3.5% - 4.0% ] 3.93% | 2,672 | 9.9% |
[ 4.0% - 4.5% ] 4.14% | 4,471 | 9.9% |
[ 4.0% - 4.5% ] 4.35% | 20,308 | 8.7% |
[ 4.5% - 5.0% ] 4.53% | 26,620 | 10.5% |
[ 4.5% - 5.0% ] 4.70% | 3,830 | 10.6% |
[ 4.5% - 5.0% ] 4.86% | 1,997 | 17.4% |
[ 5.0% - 5.5% ] 5.11% | 4,014 | 4.7% |
[ 5.0% - 5.5% ] 5.18% | 40,388 | 10.5% |
[ 5.5% - 6.0% ] 5.55% | 3,476 | 5.6% |
[ 5.5% - 6.0% ] 6.00% | 3,434 | 5.4% |
[ 6.0% - 6.5% ] 6.16% | 438 | 5.0% |
[ 6.0% - 6.5% ] 6.36% | 6,967 | 9.7% |
[ 6.5% - 7.0% ] 6.67% | 450 | 17.9% |
[ 6.5% - 7.0% ] 6.95% | 4,633 | 7.5% |
[ 7.0% - 7.5% ] 7.04% | 1,108 | 7.5% |
[ 7.0% - 7.5% ] 7.28% | 8,632 | 5.4% |
[ 7.0% - 7.5% ] 7.46% | 2,735 | 10.5% |
[ 7.5% - 8.0% ] 7.56% | 6,148 | 6.0% |
[ 7.5% - 8.0% ] 7.88% | 2,449 | 5.7% |
[ 8.0% - 8.5% ] 8.21% | 633 | 11.1% |
[ 8.0% - 8.5% ] 8.29% | 4,329 | 13.0% |
[ 8.5% - 9.0% ] 8.61% | 604 | 1.8% |
[ 8.5% - 9.0% ] 8.81% | 919 | 16.5% |
[ 8.5% - 9.0% ] 8.89% | 270 | 7.1% |
[ 9.0% - 9.5% ] 9.11% | 966 | 7.1% |
[ 9.0% - 9.5% ] 9.44% | 4,841 | 12.3% |
[ 9.5% - 10.0% ] 9.69% | 351 | 5.5% |
[ 10.0% - 10.5% ] 10.00% | 7,518 | 10.9% |
[ 10.0% - 10.5% ] 10.49% | 286 | 12.5% |
[ 10.5% - 11.0% ] 10.75% | 930 | 7.0% |
[ 10.5% - 11.0% ] 10.95% | 5,491 | 10.6% |
[ 11.0% - 11.5% ] 11.15% | 1,283 | 3.9% |
[ 11.5% - 12.0% ] 11.54% | 208 | 7.4% |
[ 11.5% - 12.0% ] 11.68% | 1,473 | 6.2% |
[ 11.5% - 12.0% ] 11.85% | 16,537 | 9.8% |
[ 11.5% - 12.0% ] 11.98% | 31,368 | 6.3% |
[ 12.0% - 12.5% ] 12.37% | 897 | 25.7% |
[ 13.0% - 13.5% ] 13.12% | 7,470 | 9.2% |
[ 13.0% - 13.5% ] 13.31% | 3,110 | 11.1% |
[ 13.0% - 13.5% ] 13.45% | 119 | 13.0% |
[ 14.5% - 15.0% ] 14.64% | 560 | 4.1% |
[ 15.0% - 15.5% ] 15.30% | 791 | 21.6% |
[ 15.5% - 16.0% ] 15.98% | 488 | 4.3% |
[ 16.5% - 17.0% ] 16.79% | 262 | 30.0% |
[ 20.0% - 20.5% ] 20.31% | 64 | 12.5% |
[ 21.0% - 21.5% ] 21.05% | 114 | 40.9% |
[ 21.5% - 22.0% ] 21.86% | 988 | 5.0% |
[ 25.5% - 26.0% ] 25.74% | 1,286 | 2.7% |
[ 36.5% - 37.0% ] 36.79% | 106 | 53.8% |