Immigrants from Korea Disability Age Under 5
COMPARE
Immigrants from Korea
Select to Compare
Disability Age Under 5
Immigrants from Korea Disability Age Under 5
1.1%
DISABILITY | AGE UNDER 5
98.8/ 100
METRIC RATING
65th/ 347
METRIC RANK
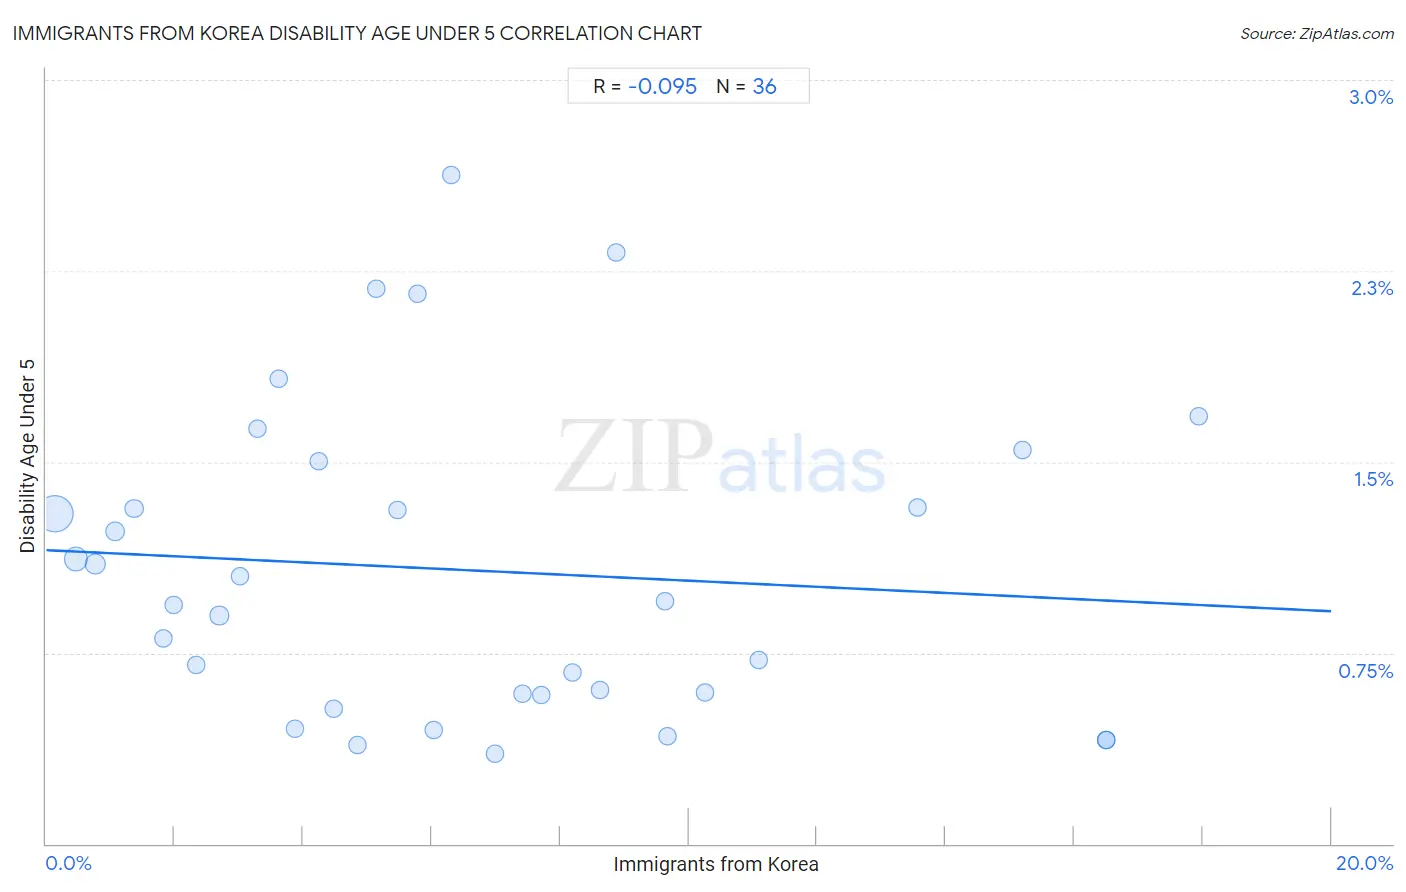
Immigrants from Korea Disability Age Under 5 Correlation Chart
The statistical analysis conducted on geographies consisting of 221,993,484 people shows a slight negative correlation between the proportion of Immigrants from Korea and percentage of population with a disability under the age of 5 in the United States with a correlation coefficient (R) of -0.095 and weighted average of 1.1%. On average, for every 1% (one percent) increase in Immigrants from Korea within a typical geography, there is a decrease of 0.012% in percentage of population with a disability under the age of 5.
It is essential to understand that the correlation between the percentage of Immigrants from Korea and percentage of population with a disability under the age of 5 does not imply a direct cause-and-effect relationship. It remains uncertain whether the presence of Immigrants from Korea influences an upward or downward trend in the level of percentage of population with a disability under the age of 5 within an area, or if Immigrants from Korea simply ended up residing in those areas with higher or lower levels of percentage of population with a disability under the age of 5 due to other factors.
Demographics Similar to Immigrants from Korea by Disability Age Under 5
In terms of disability age under 5, the demographic groups most similar to Immigrants from Korea are Immigrants from Indonesia (1.1%, a difference of 0.13%), Immigrants from Belize (1.1%, a difference of 0.19%), South African (1.1%, a difference of 0.23%), Israeli (1.1%, a difference of 0.26%), and Egyptian (1.1%, a difference of 0.34%).
| Demographics | Rating | Rank | Disability Age Under 5 |
| Immigrants from Egypt | 99.4 /100 | #58 | Exceptional 1.1% |
| Immigrants from Malaysia | 99.4 /100 | #59 | Exceptional 1.1% |
| Immigrants from Western Asia | 99.2 /100 | #60 | Exceptional 1.1% |
| Immigrants from Ethiopia | 99.2 /100 | #61 | Exceptional 1.1% |
| Immigrants from Switzerland | 99.2 /100 | #62 | Exceptional 1.1% |
| Immigrants from Vietnam | 99.1 /100 | #63 | Exceptional 1.1% |
| Egyptians | 98.9 /100 | #64 | Exceptional 1.1% |
| Immigrants from Korea | 98.8 /100 | #65 | Exceptional 1.1% |
| Immigrants from Indonesia | 98.7 /100 | #66 | Exceptional 1.1% |
| Immigrants from Belize | 98.7 /100 | #67 | Exceptional 1.1% |
| South Africans | 98.7 /100 | #68 | Exceptional 1.1% |
| Israelis | 98.7 /100 | #69 | Exceptional 1.1% |
| Immigrants from Ecuador | 98.6 /100 | #70 | Exceptional 1.1% |
| Trinidadians and Tobagonians | 98.6 /100 | #71 | Exceptional 1.1% |
| Burmese | 98.5 /100 | #72 | Exceptional 1.1% |
Immigrants from Korea Disability Age Under 5 Correlation Summary
| Measurement | Immigrants from Korea Data | Disability Age Under 5 Data |
| Minimum | 0.13% | 0.35% |
| Maximum | 17.9% | 2.6% |
| Range | 17.8% | 2.3% |
| Mean | 6.6% | 1.1% |
| Median | 5.6% | 0.95% |
| Interquartile 25% (IQ1) | 2.9% | 0.59% |
| Interquartile 75% (IQ3) | 9.2% | 1.4% |
| Interquartile Range (IQR) | 6.4% | 0.82% |
| Standard Deviation (Sample) | 4.8% | 0.61% |
| Standard Deviation (Population) | 4.8% | 0.60% |
Correlation Details
| Immigrants from Korea Percentile | Sample Size | Disability Age Under 5 |
[ 0.0% - 0.5% ] 0.13% | 141,349,976 | 1.3% |
[ 0.0% - 0.5% ] 0.46% | 43,293,286 | 1.1% |
[ 0.5% - 1.0% ] 0.76% | 14,823,861 | 1.1% |
[ 1.0% - 1.5% ] 1.07% | 8,194,344 | 1.2% |
[ 1.0% - 1.5% ] 1.37% | 3,152,068 | 1.3% |
[ 1.5% - 2.0% ] 1.82% | 5,054,521 | 0.81% |
[ 1.5% - 2.0% ] 1.99% | 1,178,827 | 0.94% |
[ 2.0% - 2.5% ] 2.33% | 661,399 | 0.70% |
[ 2.5% - 3.0% ] 2.69% | 790,117 | 0.90% |
[ 3.0% - 3.5% ] 3.02% | 419,507 | 1.0% |
[ 3.0% - 3.5% ] 3.28% | 496,925 | 1.6% |
[ 3.5% - 4.0% ] 3.62% | 266,582 | 1.8% |
[ 3.5% - 4.0% ] 3.87% | 138,398 | 0.45% |
[ 4.0% - 4.5% ] 4.24% | 92,861 | 1.5% |
[ 4.0% - 4.5% ] 4.48% | 375,325 | 0.53% |
[ 4.5% - 5.0% ] 4.85% | 267,798 | 0.39% |
[ 5.0% - 5.5% ] 5.13% | 143,385 | 2.2% |
[ 5.0% - 5.5% ] 5.46% | 73,203 | 1.3% |
[ 5.5% - 6.0% ] 5.78% | 134,925 | 2.2% |
[ 6.0% - 6.5% ] 6.04% | 44,280 | 0.45% |
[ 6.0% - 6.5% ] 6.31% | 85,223 | 2.6% |
[ 6.5% - 7.0% ] 6.98% | 35,130 | 0.35% |
[ 7.0% - 7.5% ] 7.41% | 58,833 | 0.59% |
[ 7.5% - 8.0% ] 7.70% | 142,280 | 0.59% |
[ 8.0% - 8.5% ] 8.19% | 142,952 | 0.67% |
[ 8.5% - 9.0% ] 8.62% | 100,125 | 0.60% |
[ 8.5% - 9.0% ] 8.87% | 76,686 | 2.3% |
[ 9.5% - 10.0% ] 9.63% | 27,428 | 0.95% |
[ 9.5% - 10.0% ] 9.67% | 72,680 | 0.42% |
[ 10.0% - 10.5% ] 10.25% | 37,647 | 0.59% |
[ 11.0% - 11.5% ] 11.09% | 56,628 | 0.72% |
[ 13.5% - 14.0% ] 13.57% | 36,151 | 1.3% |
[ 15.0% - 15.5% ] 15.20% | 52,799 | 1.5% |
[ 16.0% - 16.5% ] 16.50% | 39,799 | 0.41% |
[ 16.5% - 17.0% ] 16.50% | 39,781 | 0.41% |
[ 17.5% - 18.0% ] 17.93% | 37,754 | 1.7% |