Immigrants from Lebanon Disability Age Under 5
COMPARE
Immigrants from Lebanon
Select to Compare
Disability Age Under 5
Immigrants from Lebanon Disability Age Under 5
1.2%
DISABILITY | AGE UNDER 5
95.0/ 100
METRIC RATING
110th/ 347
METRIC RANK
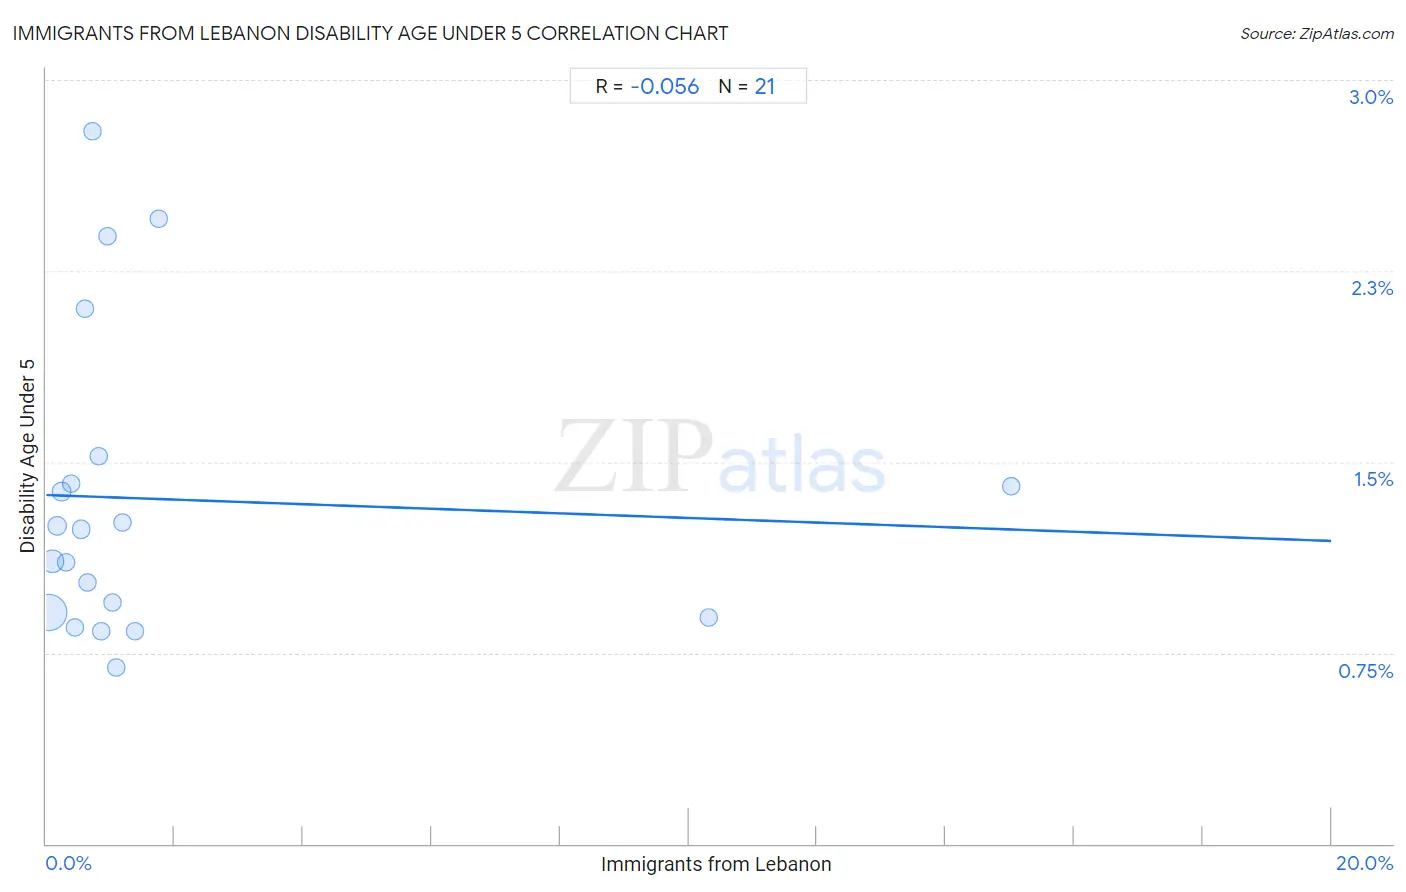
Immigrants from Lebanon Disability Age Under 5 Correlation Chart
The statistical analysis conducted on geographies consisting of 139,551,916 people shows a slight negative correlation between the proportion of Immigrants from Lebanon and percentage of population with a disability under the age of 5 in the United States with a correlation coefficient (R) of -0.056 and weighted average of 1.2%. On average, for every 1% (one percent) increase in Immigrants from Lebanon within a typical geography, there is a decrease of 0.0090% in percentage of population with a disability under the age of 5.
It is essential to understand that the correlation between the percentage of Immigrants from Lebanon and percentage of population with a disability under the age of 5 does not imply a direct cause-and-effect relationship. It remains uncertain whether the presence of Immigrants from Lebanon influences an upward or downward trend in the level of percentage of population with a disability under the age of 5 within an area, or if Immigrants from Lebanon simply ended up residing in those areas with higher or lower levels of percentage of population with a disability under the age of 5 due to other factors.
Demographics Similar to Immigrants from Lebanon by Disability Age Under 5
In terms of disability age under 5, the demographic groups most similar to Immigrants from Lebanon are Immigrants from Panama (1.2%, a difference of 0.020%), Iraqi (1.2%, a difference of 0.040%), Immigrants from West Indies (1.2%, a difference of 0.17%), Senegalese (1.2%, a difference of 0.20%), and Cambodian (1.2%, a difference of 0.21%).
| Demographics | Rating | Rank | Disability Age Under 5 |
| Immigrants from Nicaragua | 96.0 /100 | #103 | Exceptional 1.2% |
| Indonesians | 95.9 /100 | #104 | Exceptional 1.2% |
| Immigrants from South Africa | 95.6 /100 | #105 | Exceptional 1.2% |
| Cambodians | 95.4 /100 | #106 | Exceptional 1.2% |
| Immigrants from West Indies | 95.3 /100 | #107 | Exceptional 1.2% |
| Iraqis | 95.1 /100 | #108 | Exceptional 1.2% |
| Immigrants from Panama | 95.0 /100 | #109 | Exceptional 1.2% |
| Immigrants from Lebanon | 95.0 /100 | #110 | Exceptional 1.2% |
| Senegalese | 94.6 /100 | #111 | Exceptional 1.2% |
| Immigrants from Australia | 94.4 /100 | #112 | Exceptional 1.2% |
| Immigrants from Oceania | 94.2 /100 | #113 | Exceptional 1.2% |
| Belizeans | 93.9 /100 | #114 | Exceptional 1.2% |
| Immigrants from Caribbean | 93.8 /100 | #115 | Exceptional 1.2% |
| Immigrants from Northern Africa | 93.8 /100 | #116 | Exceptional 1.2% |
| Immigrants from Philippines | 93.5 /100 | #117 | Exceptional 1.2% |
Immigrants from Lebanon Disability Age Under 5 Correlation Summary
| Measurement | Immigrants from Lebanon Data | Disability Age Under 5 Data |
| Minimum | 0.031% | 0.69% |
| Maximum | 15.0% | 2.8% |
| Range | 15.0% | 2.1% |
| Mean | 1.8% | 1.4% |
| Median | 0.72% | 1.2% |
| Interquartile 25% (IQ1) | 0.35% | 0.90% |
| Interquartile 75% (IQ3) | 1.1% | 1.5% |
| Interquartile Range (IQR) | 0.80% | 0.57% |
| Standard Deviation (Sample) | 3.7% | 0.59% |
| Standard Deviation (Population) | 3.6% | 0.58% |
Correlation Details
| Immigrants from Lebanon Percentile | Sample Size | Disability Age Under 5 |
[ 0.0% - 0.5% ] 0.031% | 95,696,210 | 0.91% |
[ 0.0% - 0.5% ] 0.095% | 25,687,774 | 1.1% |
[ 0.0% - 0.5% ] 0.17% | 10,123,504 | 1.2% |
[ 0.0% - 0.5% ] 0.24% | 2,857,319 | 1.4% |
[ 0.0% - 0.5% ] 0.31% | 1,590,189 | 1.1% |
[ 0.0% - 0.5% ] 0.38% | 1,082,863 | 1.4% |
[ 0.0% - 0.5% ] 0.45% | 643,456 | 0.85% |
[ 0.5% - 1.0% ] 0.54% | 585,710 | 1.2% |
[ 0.5% - 1.0% ] 0.59% | 428,811 | 2.1% |
[ 0.5% - 1.0% ] 0.65% | 95,318 | 1.0% |
[ 0.5% - 1.0% ] 0.72% | 72,783 | 2.8% |
[ 0.5% - 1.0% ] 0.82% | 147,276 | 1.5% |
[ 0.5% - 1.0% ] 0.86% | 27,119 | 0.83% |
[ 0.5% - 1.0% ] 0.95% | 160,795 | 2.4% |
[ 1.0% - 1.5% ] 1.03% | 42,719 | 0.95% |
[ 1.0% - 1.5% ] 1.09% | 123,600 | 0.69% |
[ 1.0% - 1.5% ] 1.19% | 9,626 | 1.3% |
[ 1.0% - 1.5% ] 1.38% | 33,377 | 0.84% |
[ 1.5% - 2.0% ] 1.75% | 40,601 | 2.5% |
[ 10.0% - 10.5% ] 10.31% | 62,474 | 0.89% |
[ 15.0% - 15.5% ] 15.03% | 40,392 | 1.4% |