Immigrants from Caribbean Disability Age Under 5
COMPARE
Immigrants from Caribbean
Select to Compare
Disability Age Under 5
Immigrants from Caribbean Disability Age Under 5
1.2%
DISABILITY | AGE UNDER 5
93.8/ 100
METRIC RATING
115th/ 347
METRIC RANK
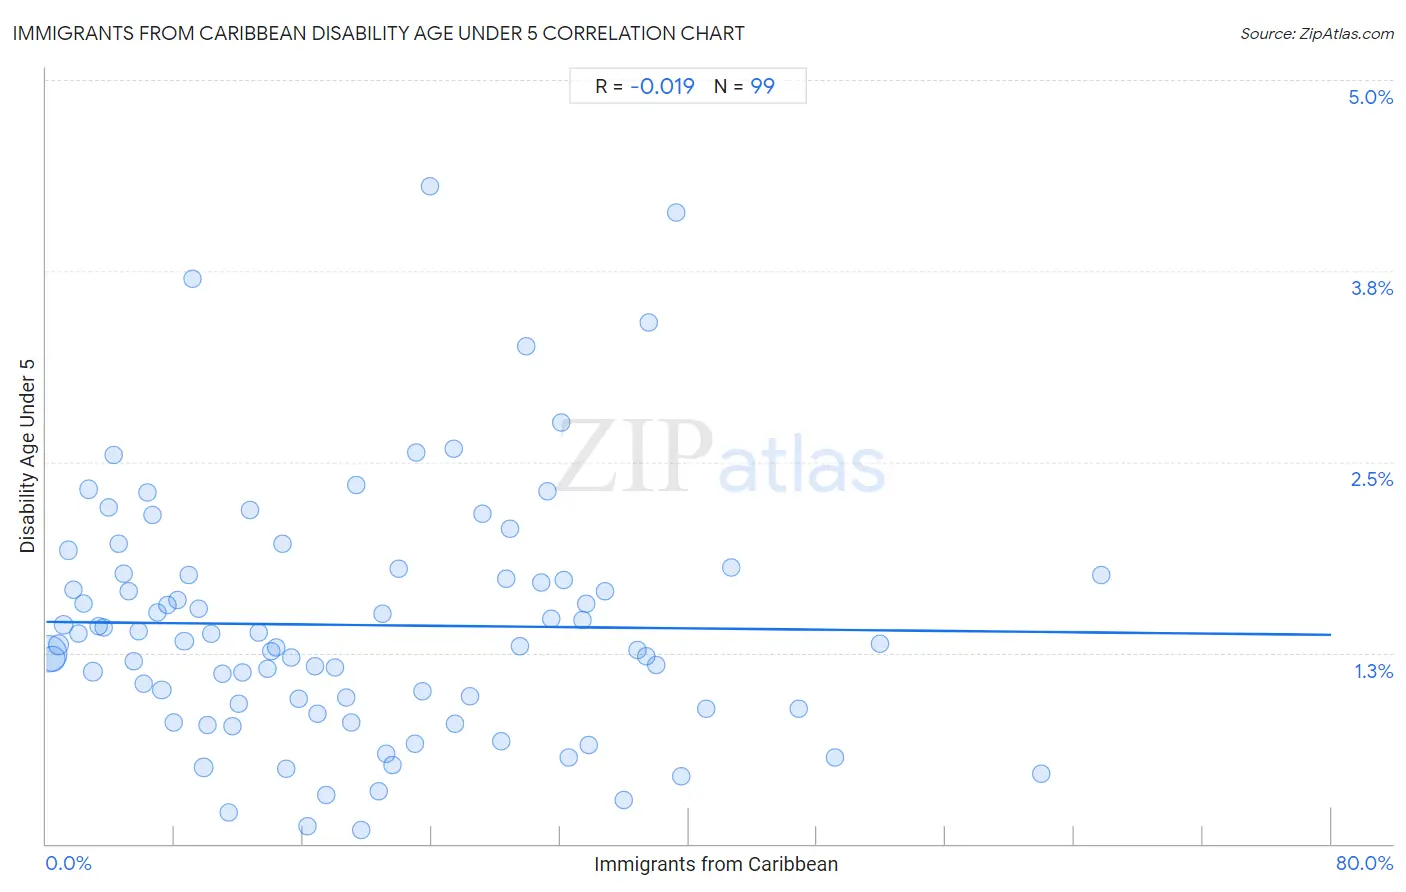
Immigrants from Caribbean Disability Age Under 5 Correlation Chart
The statistical analysis conducted on geographies consisting of 233,002,612 people shows no correlation between the proportion of Immigrants from Caribbean and percentage of population with a disability under the age of 5 in the United States with a correlation coefficient (R) of -0.019 and weighted average of 1.2%. On average, for every 1% (one percent) increase in Immigrants from Caribbean within a typical geography, there is a decrease of 0.0011% in percentage of population with a disability under the age of 5.
It is essential to understand that the correlation between the percentage of Immigrants from Caribbean and percentage of population with a disability under the age of 5 does not imply a direct cause-and-effect relationship. It remains uncertain whether the presence of Immigrants from Caribbean influences an upward or downward trend in the level of percentage of population with a disability under the age of 5 within an area, or if Immigrants from Caribbean simply ended up residing in those areas with higher or lower levels of percentage of population with a disability under the age of 5 due to other factors.
Demographics Similar to Immigrants from Caribbean by Disability Age Under 5
In terms of disability age under 5, the demographic groups most similar to Immigrants from Caribbean are Belizean (1.2%, a difference of 0.010%), Immigrants from Northern Africa (1.2%, a difference of 0.020%), Immigrants from Philippines (1.2%, a difference of 0.15%), Immigrants from Oceania (1.2%, a difference of 0.16%), and Immigrants from Venezuela (1.2%, a difference of 0.19%).
| Demographics | Rating | Rank | Disability Age Under 5 |
| Iraqis | 95.1 /100 | #108 | Exceptional 1.2% |
| Immigrants from Panama | 95.0 /100 | #109 | Exceptional 1.2% |
| Immigrants from Lebanon | 95.0 /100 | #110 | Exceptional 1.2% |
| Senegalese | 94.6 /100 | #111 | Exceptional 1.2% |
| Immigrants from Australia | 94.4 /100 | #112 | Exceptional 1.2% |
| Immigrants from Oceania | 94.2 /100 | #113 | Exceptional 1.2% |
| Belizeans | 93.9 /100 | #114 | Exceptional 1.2% |
| Immigrants from Caribbean | 93.8 /100 | #115 | Exceptional 1.2% |
| Immigrants from Northern Africa | 93.8 /100 | #116 | Exceptional 1.2% |
| Immigrants from Philippines | 93.5 /100 | #117 | Exceptional 1.2% |
| Immigrants from Venezuela | 93.4 /100 | #118 | Exceptional 1.2% |
| Bhutanese | 92.5 /100 | #119 | Exceptional 1.2% |
| Immigrants from Eritrea | 92.3 /100 | #120 | Exceptional 1.2% |
| Immigrants from Senegal | 91.4 /100 | #121 | Exceptional 1.2% |
| Aleuts | 90.7 /100 | #122 | Exceptional 1.2% |
Immigrants from Caribbean Disability Age Under 5 Correlation Summary
| Measurement | Immigrants from Caribbean Data | Disability Age Under 5 Data |
| Minimum | 0.14% | 0.090% |
| Maximum | 65.7% | 4.3% |
| Range | 65.5% | 4.2% |
| Mean | 19.5% | 1.4% |
| Median | 16.7% | 1.3% |
| Interquartile 25% (IQ1) | 7.6% | 0.88% |
| Interquartile 75% (IQ3) | 29.9% | 1.8% |
| Interquartile Range (IQR) | 22.3% | 0.88% |
| Standard Deviation (Sample) | 14.4% | 0.81% |
| Standard Deviation (Population) | 14.3% | 0.80% |
Correlation Details
| Immigrants from Caribbean Percentile | Sample Size | Disability Age Under 5 |
[ 0.0% - 0.5% ] 0.14% | 114,715,412 | 1.2% |
[ 0.0% - 0.5% ] 0.42% | 44,745,634 | 1.2% |
[ 0.5% - 1.0% ] 0.78% | 17,267,704 | 1.3% |
[ 1.0% - 1.5% ] 1.09% | 9,384,211 | 1.4% |
[ 1.0% - 1.5% ] 1.38% | 4,381,075 | 1.9% |
[ 1.5% - 2.0% ] 1.69% | 3,485,085 | 1.7% |
[ 2.0% - 2.5% ] 2.01% | 3,270,583 | 1.4% |
[ 2.0% - 2.5% ] 2.30% | 2,481,814 | 1.6% |
[ 2.5% - 3.0% ] 2.65% | 1,618,037 | 2.3% |
[ 2.5% - 3.0% ] 2.90% | 2,732,696 | 1.1% |
[ 3.0% - 3.5% ] 3.24% | 1,378,424 | 1.4% |
[ 3.5% - 4.0% ] 3.56% | 786,474 | 1.4% |
[ 3.5% - 4.0% ] 3.87% | 744,968 | 2.2% |
[ 4.0% - 4.5% ] 4.19% | 694,684 | 2.5% |
[ 4.0% - 4.5% ] 4.48% | 689,162 | 2.0% |
[ 4.5% - 5.0% ] 4.80% | 625,990 | 1.8% |
[ 5.0% - 5.5% ] 5.13% | 517,490 | 1.7% |
[ 5.0% - 5.5% ] 5.43% | 329,689 | 1.2% |
[ 5.5% - 6.0% ] 5.73% | 495,872 | 1.4% |
[ 6.0% - 6.5% ] 6.04% | 678,660 | 1.0% |
[ 6.0% - 6.5% ] 6.34% | 435,248 | 2.3% |
[ 6.5% - 7.0% ] 6.65% | 331,713 | 2.2% |
[ 6.5% - 7.0% ] 6.92% | 496,641 | 1.5% |
[ 7.0% - 7.5% ] 7.19% | 866,961 | 1.0% |
[ 7.5% - 8.0% ] 7.58% | 261,426 | 1.6% |
[ 7.5% - 8.0% ] 7.92% | 373,652 | 0.79% |
[ 8.0% - 8.5% ] 8.18% | 485,575 | 1.6% |
[ 8.5% - 9.0% ] 8.60% | 797,346 | 1.3% |
[ 8.5% - 9.0% ] 8.86% | 251,921 | 1.8% |
[ 9.0% - 9.5% ] 9.11% | 130,830 | 3.7% |
[ 9.0% - 9.5% ] 9.48% | 460,042 | 1.5% |
[ 9.5% - 10.0% ] 9.82% | 8,893,599 | 0.50% |
[ 10.0% - 10.5% ] 10.07% | 36,379 | 0.78% |
[ 10.0% - 10.5% ] 10.29% | 347,334 | 1.4% |
[ 10.5% - 11.0% ] 10.97% | 397,950 | 1.1% |
[ 11.0% - 11.5% ] 11.38% | 253,673 | 0.21% |
[ 11.5% - 12.0% ] 11.58% | 521,313 | 0.77% |
[ 11.5% - 12.0% ] 11.99% | 44,793 | 0.92% |
[ 12.0% - 12.5% ] 12.23% | 500,213 | 1.1% |
[ 12.5% - 13.0% ] 12.70% | 17,623 | 2.2% |
[ 13.0% - 13.5% ] 13.22% | 70,798 | 1.4% |
[ 13.5% - 14.0% ] 13.77% | 100,210 | 1.1% |
[ 14.0% - 14.5% ] 14.00% | 76,594 | 1.3% |
[ 14.0% - 14.5% ] 14.34% | 445,708 | 1.3% |
[ 14.5% - 15.0% ] 14.74% | 98,883 | 2.0% |
[ 14.5% - 15.0% ] 14.96% | 51,931 | 0.49% |
[ 15.0% - 15.5% ] 15.23% | 108,180 | 1.2% |
[ 15.5% - 16.0% ] 15.75% | 38,865 | 0.95% |
[ 16.0% - 16.5% ] 16.24% | 131,708 | 0.11% |
[ 16.5% - 17.0% ] 16.71% | 162,473 | 1.2% |
[ 16.5% - 17.0% ] 16.89% | 276,520 | 0.85% |
[ 17.0% - 17.5% ] 17.45% | 118,857 | 0.32% |
[ 17.5% - 18.0% ] 18.00% | 138,262 | 1.2% |
[ 18.5% - 19.0% ] 18.67% | 155,221 | 0.96% |
[ 18.5% - 19.0% ] 18.95% | 96,510 | 0.79% |
[ 19.0% - 19.5% ] 19.29% | 129,290 | 2.3% |
[ 19.5% - 20.0% ] 19.64% | 136,246 | 0.090% |
[ 20.5% - 21.0% ] 20.72% | 64,203 | 0.35% |
[ 20.5% - 21.0% ] 20.96% | 25,674 | 1.5% |
[ 21.0% - 21.5% ] 21.18% | 58,476 | 0.59% |
[ 21.5% - 22.0% ] 21.57% | 96,833 | 0.51% |
[ 21.5% - 22.0% ] 21.94% | 79,817 | 1.8% |
[ 22.5% - 23.0% ] 22.92% | 157,864 | 0.65% |
[ 23.0% - 23.5% ] 23.00% | 39,498 | 2.6% |
[ 23.0% - 23.5% ] 23.45% | 296,460 | 1.00% |
[ 23.5% - 24.0% ] 23.88% | 29,820 | 4.3% |
[ 25.0% - 25.5% ] 25.35% | 59,121 | 2.6% |
[ 25.0% - 25.5% ] 25.45% | 37,274 | 0.78% |
[ 26.0% - 26.5% ] 26.39% | 110,254 | 0.97% |
[ 27.0% - 27.5% ] 27.13% | 149,335 | 2.2% |
[ 28.0% - 28.5% ] 28.35% | 192,003 | 0.67% |
[ 28.5% - 29.0% ] 28.63% | 88,917 | 1.7% |
[ 28.5% - 29.0% ] 28.88% | 72,677 | 2.1% |
[ 29.5% - 30.0% ] 29.51% | 497,853 | 1.3% |
[ 29.5% - 30.0% ] 29.86% | 132,229 | 3.3% |
[ 30.5% - 31.0% ] 30.82% | 58,136 | 1.7% |
[ 31.0% - 31.5% ] 31.20% | 37,954 | 2.3% |
[ 31.0% - 31.5% ] 31.45% | 81,397 | 1.5% |
[ 32.0% - 32.5% ] 32.04% | 29,240 | 2.8% |
[ 32.0% - 32.5% ] 32.25% | 55,226 | 1.7% |
[ 32.5% - 33.0% ] 32.55% | 29,530 | 0.56% |
[ 33.0% - 33.5% ] 33.42% | 48,326 | 1.5% |
[ 33.5% - 34.0% ] 33.59% | 13,781 | 1.6% |
[ 33.5% - 34.0% ] 33.78% | 100,082 | 0.65% |
[ 34.5% - 35.0% ] 34.81% | 177,555 | 1.7% |
[ 35.5% - 36.0% ] 35.92% | 59,854 | 0.28% |
[ 36.5% - 37.0% ] 36.78% | 57,066 | 1.3% |
[ 37.0% - 37.5% ] 37.34% | 131,244 | 1.2% |
[ 37.5% - 38.0% ] 37.52% | 13,163 | 3.4% |
[ 38.0% - 38.5% ] 38.01% | 88,529 | 1.2% |
[ 39.0% - 39.5% ] 39.21% | 34,725 | 4.1% |
[ 39.5% - 40.0% ] 39.54% | 43,702 | 0.44% |
[ 41.0% - 41.5% ] 41.06% | 37,977 | 0.88% |
[ 42.5% - 43.0% ] 42.68% | 34,335 | 1.8% |
[ 46.5% - 47.0% ] 46.83% | 24,597 | 0.88% |
[ 49.0% - 49.5% ] 49.08% | 52,851 | 0.56% |
[ 51.5% - 52.0% ] 51.94% | 46,798 | 1.3% |
[ 61.5% - 62.0% ] 61.95% | 222,996 | 0.46% |
[ 65.5% - 66.0% ] 65.67% | 71,088 | 1.8% |