Cape Verdean Disability Age Under 5
COMPARE
Cape Verdean
Select to Compare
Disability Age Under 5
Cape Verdean Disability Age Under 5
1.7%
DISABILITY | AGE UNDER 5
0.0/ 100
METRIC RATING
309th/ 347
METRIC RANK
Cape Verdean Disability Age Under 5 Correlation Chart
The statistical analysis conducted on geographies consisting of 80,346,766 people shows a moderate positive correlation between the proportion of Cape Verdeans and percentage of population with a disability under the age of 5 in the United States with a correlation coefficient (R) of 0.467 and weighted average of 1.7%. On average, for every 1% (one percent) increase in Cape Verdeans within a typical geography, there is an increase of 0.12% in percentage of population with a disability under the age of 5.
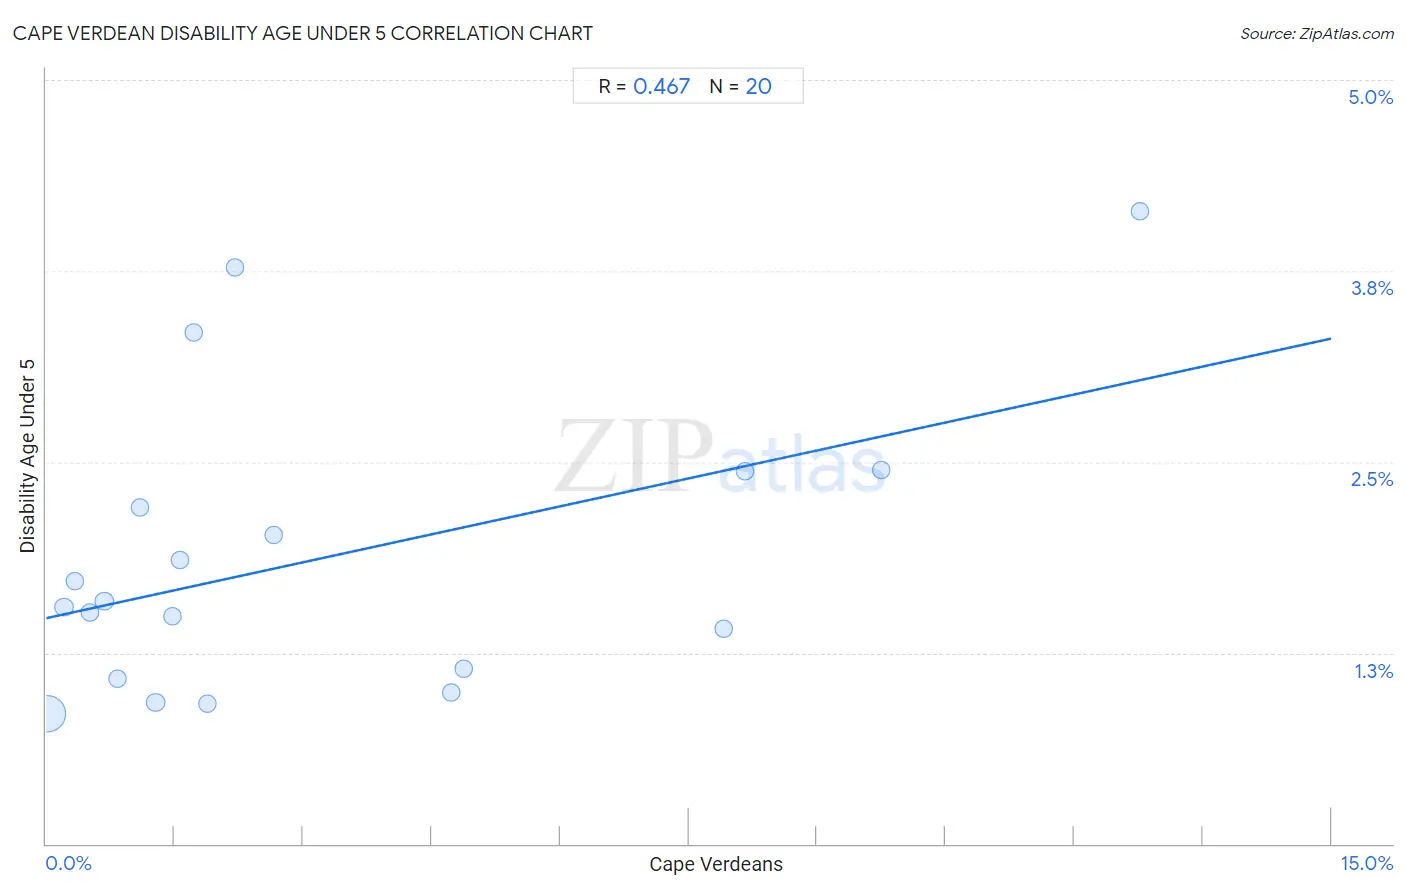
It is essential to understand that the correlation between the percentage of Cape Verdeans and percentage of population with a disability under the age of 5 does not imply a direct cause-and-effect relationship. It remains uncertain whether the presence of Cape Verdeans influences an upward or downward trend in the level of percentage of population with a disability under the age of 5 within an area, or if Cape Verdeans simply ended up residing in those areas with higher or lower levels of percentage of population with a disability under the age of 5 due to other factors.
Demographics Similar to Cape Verdeans by Disability Age Under 5
In terms of disability age under 5, the demographic groups most similar to Cape Verdeans are White/Caucasian (1.7%, a difference of 0.070%), Navajo (1.6%, a difference of 0.63%), English (1.7%, a difference of 0.66%), Puerto Rican (1.7%, a difference of 0.70%), and Scottish (1.6%, a difference of 0.77%).
| Demographics | Rating | Rank | Disability Age Under 5 |
| Welsh | 0.0 /100 | #302 | Tragic 1.6% |
| Swiss | 0.0 /100 | #303 | Tragic 1.6% |
| Seminole | 0.0 /100 | #304 | Tragic 1.6% |
| Blackfeet | 0.0 /100 | #305 | Tragic 1.6% |
| Creek | 0.0 /100 | #306 | Tragic 1.6% |
| Scottish | 0.0 /100 | #307 | Tragic 1.6% |
| Navajo | 0.0 /100 | #308 | Tragic 1.6% |
| Cape Verdeans | 0.0 /100 | #309 | Tragic 1.7% |
| Whites/Caucasians | 0.0 /100 | #310 | Tragic 1.7% |
| English | 0.0 /100 | #311 | Tragic 1.7% |
| Puerto Ricans | 0.0 /100 | #312 | Tragic 1.7% |
| Celtics | 0.0 /100 | #313 | Tragic 1.7% |
| Norwegians | 0.0 /100 | #314 | Tragic 1.7% |
| Dutch | 0.0 /100 | #315 | Tragic 1.7% |
| Immigrants from Cabo Verde | 0.0 /100 | #316 | Tragic 1.7% |
Cape Verdean Disability Age Under 5 Correlation Summary
| Measurement | Cape Verdean Data | Disability Age Under 5 Data |
| Minimum | 0.019% | 0.85% |
| Maximum | 12.8% | 4.1% |
| Range | 12.7% | 3.3% |
| Mean | 3.2% | 1.9% |
| Median | 1.6% | 1.6% |
| Interquartile 25% (IQ1) | 0.75% | 1.1% |
| Interquartile 75% (IQ3) | 4.8% | 2.3% |
| Interquartile Range (IQR) | 4.1% | 1.2% |
| Standard Deviation (Sample) | 3.6% | 0.95% |
| Standard Deviation (Population) | 3.5% | 0.93% |
Correlation Details
| Cape Verdean Percentile | Sample Size | Disability Age Under 5 |
[ 0.0% - 0.5% ] 0.019% | 73,988,507 | 0.85% |
[ 0.0% - 0.5% ] 0.21% | 2,739,593 | 1.5% |
[ 0.0% - 0.5% ] 0.34% | 969,165 | 1.7% |
[ 0.5% - 1.0% ] 0.52% | 298,675 | 1.5% |
[ 0.5% - 1.0% ] 0.68% | 281,776 | 1.6% |
[ 0.5% - 1.0% ] 0.83% | 207,617 | 1.1% |
[ 1.0% - 1.5% ] 1.10% | 180,560 | 2.2% |
[ 1.0% - 1.5% ] 1.28% | 228,150 | 0.93% |
[ 1.0% - 1.5% ] 1.47% | 232,344 | 1.5% |
[ 1.5% - 2.0% ] 1.56% | 82,750 | 1.9% |
[ 1.5% - 2.0% ] 1.72% | 58,351 | 3.3% |
[ 1.5% - 2.0% ] 1.88% | 665,945 | 0.92% |
[ 2.0% - 2.5% ] 2.20% | 32,350 | 3.8% |
[ 2.5% - 3.0% ] 2.66% | 93,638 | 2.0% |
[ 4.5% - 5.0% ] 4.73% | 59,436 | 0.99% |
[ 4.5% - 5.0% ] 4.88% | 51,915 | 1.1% |
[ 7.5% - 8.0% ] 7.90% | 16,286 | 1.4% |
[ 8.0% - 8.5% ] 8.15% | 12,465 | 2.4% |
[ 9.5% - 10.0% ] 9.75% | 100,620 | 2.4% |
[ 12.5% - 13.0% ] 12.76% | 46,623 | 4.1% |