Peruvian Disability Age Under 5

COMPARE

Peruvian
Race
Ancestry
AfghanAfricanAlaska NativeAlaskan AthabascanAlbanianAleutAlsatianAmericanApacheArabArapahoArgentineanArmenianAssyrian/Chaldean/SyriacAustralianAustrianBahamianBangladeshiBarbadianBasqueBelgianBelizeanBermudanBhutaneseBlackfeetBolivianBrazilianBritishBritish West IndianBulgarianBurmeseCajunCambodianCanadianCape VerdeanCarpatho RusynCelticCentral AmericanCentral American IndianCherokeeCheyenneChickasawChileanChineseChippewaChoctawColombianColvilleComancheCosta RicanCreeCreekCroatianCrowCubanCypriotCzechCzechoslovakianDanishDelawareDominicanDutchDutch West IndianEastern EuropeanEcuadorianEgyptianEnglishEstonianEthiopianEuropeanFijianFilipinoFinnishFrenchFrench American IndianFrench CanadianGermanGerman RussianGhanaianGreekGuamanian/ChamorroGuatemalanGuyaneseHaitianHmongHonduranHopiHoumaHungarianIcelanderIndian (Asian)IndonesianInupiatIranianIraqiIrishIroquoisIsraeliItalianJamaicanJapaneseJordanianKenyanKiowaKoreanLaotianLatvianLebaneseLiberianLithuanianLumbeeLuxembourgerMacedonianMalaysianMalteseMarshalleseMenomineeMexicanMexican American IndianMongolianMoroccanNative HawaiianNavajoNepaleseNew ZealanderNicaraguanNigerianNorthern EuropeanNorwegianOkinawanOsageOttawaPaiutePakistaniPalestinianPanamanianParaguayanPennsylvania GermanPeruvianPimaPolishPortuguesePotawatomiPuebloPuerto RicanPuget Sound SalishRomanianRussianSalvadoranSamoanScandinavianScotch-IrishScottishSeminoleSenegaleseSerbianShoshoneSierra LeoneanSiouxSlavicSlovakSloveneSomaliSouth AfricanSouth AmericanSouth American IndianSoviet UnionSpaniardSpanishSpanish AmericanSpanish American IndianSri LankanSubsaharan AfricanSudaneseSwedishSwissSyrianTaiwaneseThaiTlingit-HaidaTohono O'OdhamTonganTrinidadian and TobagonianTsimshianTurkishU.S. Virgin IslanderUgandanUkrainianUruguayanUteVenezuelanVietnameseWelshWest IndianYakamaYaquiYugoslavianYumanYup'ikZimbabwean
Immigration
NonimmigrantsImmigrantsAfghanistanAfricaAlbaniaArgentinaArmeniaAsiaAustraliaAustriaBahamasBangladeshBarbadosBelarusBelgiumBelizeBoliviaBosnia and HerzegovinaBrazilBulgariaBurma/MyanmarCabo VerdeCambodiaCameroonCanadaCaribbeanCentral AmericaChileChinaColombiaCongoCosta RicaCroatiaCubaCzechoslovakiaDenmarkDominicaDominican RepublicEastern AfricaEastern AsiaEastern EuropeEcuadorEgyptEl SalvadorEnglandEritreaEthiopiaEuropeFijiFranceGermanyGhanaGreeceGrenadaGuatemalaGuyanaHaitiHondurasHong KongHungaryIndiaIndonesiaIranIraqIrelandIsraelItalyJamaicaJapanJordanKazakhstanKenyaKoreaKuwaitLaosLatin AmericaLatviaLebanonLiberiaLithuaniaMalaysiaMexicoMicronesiaMiddle AfricaMoldovaMoroccoNepalNetherlandsNicaraguaNigeriaNorth AmericaNorth MacedoniaNorthern AfricaNorthern EuropeNorwayOceaniaPakistanPanamaPeruPhilippinesPolandPortugalRomaniaRussiaSaudi ArabiaScotlandSenegalSerbiaSierra LeoneSingaporeSomaliaSouth AfricaSouth AmericaSouth Central AsiaSouth Eastern AsiaSouthern EuropeSpainSri LankaSt. Vincent and the GrenadinesSudanSwedenSwitzerlandSyriaTaiwanThailandTrinidad and TobagoTurkeyUgandaUkraineUruguayUzbekistanVenezuelaVietnamWest IndiesWestern AfricaWestern AsiaWestern EuropeYemenZaireZimbabweAzores
Select to Compare
Race
Ancestry
AfghanAfricanAlaska NativeAlaskan AthabascanAlbanianAleutAlsatianAmericanApacheArabArapahoArgentineanArmenianAssyrian/Chaldean/SyriacAustralianAustrianBahamianBangladeshiBarbadianBasqueBelgianBelizeanBermudanBhutaneseBlackfeetBolivianBrazilianBritishBritish West IndianBulgarianBurmeseCajunCambodianCanadianCape VerdeanCarpatho RusynCelticCentral AmericanCentral American IndianCherokeeCheyenneChickasawChileanChineseChippewaChoctawColombianColvilleComancheCosta RicanCreeCreekCroatianCrowCubanCypriotCzechCzechoslovakianDanishDelawareDominicanDutchDutch West IndianEastern EuropeanEcuadorianEgyptianEnglishEstonianEthiopianEuropeanFijianFilipinoFinnishFrenchFrench American IndianFrench CanadianGermanGerman RussianGhanaianGreekGuamanian/ChamorroGuatemalanGuyaneseHaitianHmongHonduranHopiHoumaHungarianIcelanderIndian (Asian)IndonesianInupiatIranianIraqiIrishIroquoisIsraeliItalianJamaicanJapaneseJordanianKenyanKiowaKoreanLaotianLatvianLebaneseLiberianLithuanianLumbeeLuxembourgerMacedonianMalaysianMalteseMarshalleseMenomineeMexicanMexican American IndianMongolianMoroccanNative HawaiianNavajoNepaleseNew ZealanderNicaraguanNigerianNorthern EuropeanNorwegianOkinawanOsageOttawaPaiutePakistaniPalestinianPanamanianParaguayanPennsylvania GermanPimaPolishPortuguesePotawatomiPuebloPuerto RicanPuget Sound SalishRomanianRussianSalvadoranSamoanScandinavianScotch-IrishScottishSeminoleSenegaleseSerbianShoshoneSierra LeoneanSiouxSlavicSlovakSloveneSomaliSouth AfricanSouth AmericanSouth American IndianSoviet UnionSpaniardSpanishSpanish AmericanSpanish American IndianSri LankanSubsaharan AfricanSudaneseSwedishSwissSyrianTaiwaneseThaiTlingit-HaidaTohono O'OdhamTonganTrinidadian and TobagonianTsimshianTurkishU.S. Virgin IslanderUgandanUkrainianUruguayanUteVenezuelanVietnameseWelshWest IndianYakamaYaquiYugoslavianYumanYup'ikZimbabwean
Immigration
NonimmigrantsImmigrantsAfghanistanAfricaAlbaniaArgentinaArmeniaAsiaAustraliaAustriaBahamasBangladeshBarbadosBelarusBelgiumBelizeBoliviaBosnia and HerzegovinaBrazilBulgariaBurma/MyanmarCabo VerdeCambodiaCameroonCanadaCaribbeanCentral AmericaChileChinaColombiaCongoCosta RicaCroatiaCubaCzechoslovakiaDenmarkDominicaDominican RepublicEastern AfricaEastern AsiaEastern EuropeEcuadorEgyptEl SalvadorEnglandEritreaEthiopiaEuropeFijiFranceGermanyGhanaGreeceGrenadaGuatemalaGuyanaHaitiHondurasHong KongHungaryIndiaIndonesiaIranIraqIrelandIsraelItalyJamaicaJapanJordanKazakhstanKenyaKoreaKuwaitLaosLatin AmericaLatviaLebanonLiberiaLithuaniaMalaysiaMexicoMicronesiaMiddle AfricaMoldovaMoroccoNepalNetherlandsNicaraguaNigeriaNorth AmericaNorth MacedoniaNorthern AfricaNorthern EuropeNorwayOceaniaPakistanPanamaPeruPhilippinesPolandPortugalRomaniaRussiaSaudi ArabiaScotlandSenegalSerbiaSierra LeoneSingaporeSomaliaSouth AfricaSouth AmericaSouth Central AsiaSouth Eastern AsiaSouthern EuropeSpainSri LankaSt. Vincent and the GrenadinesSudanSwedenSwitzerlandSyriaTaiwanThailandTrinidad and TobagoTurkeyUgandaUkraineUruguayUzbekistanVenezuelaVietnamWest IndiesWestern AfricaWestern AsiaWestern EuropeYemenZaireZimbabweAzores
Disability Age Under 5
Income
Poverty
Unemployment
Labor Participation
Family Structure
Vehicle Availability
Education Level
Disability

Peruvian Disability Age Under 5
Fair

1.3%
DISABILITY | AGE UNDER 5
37.6/ 100
METRIC RATING
189th/ 347
METRIC RANK

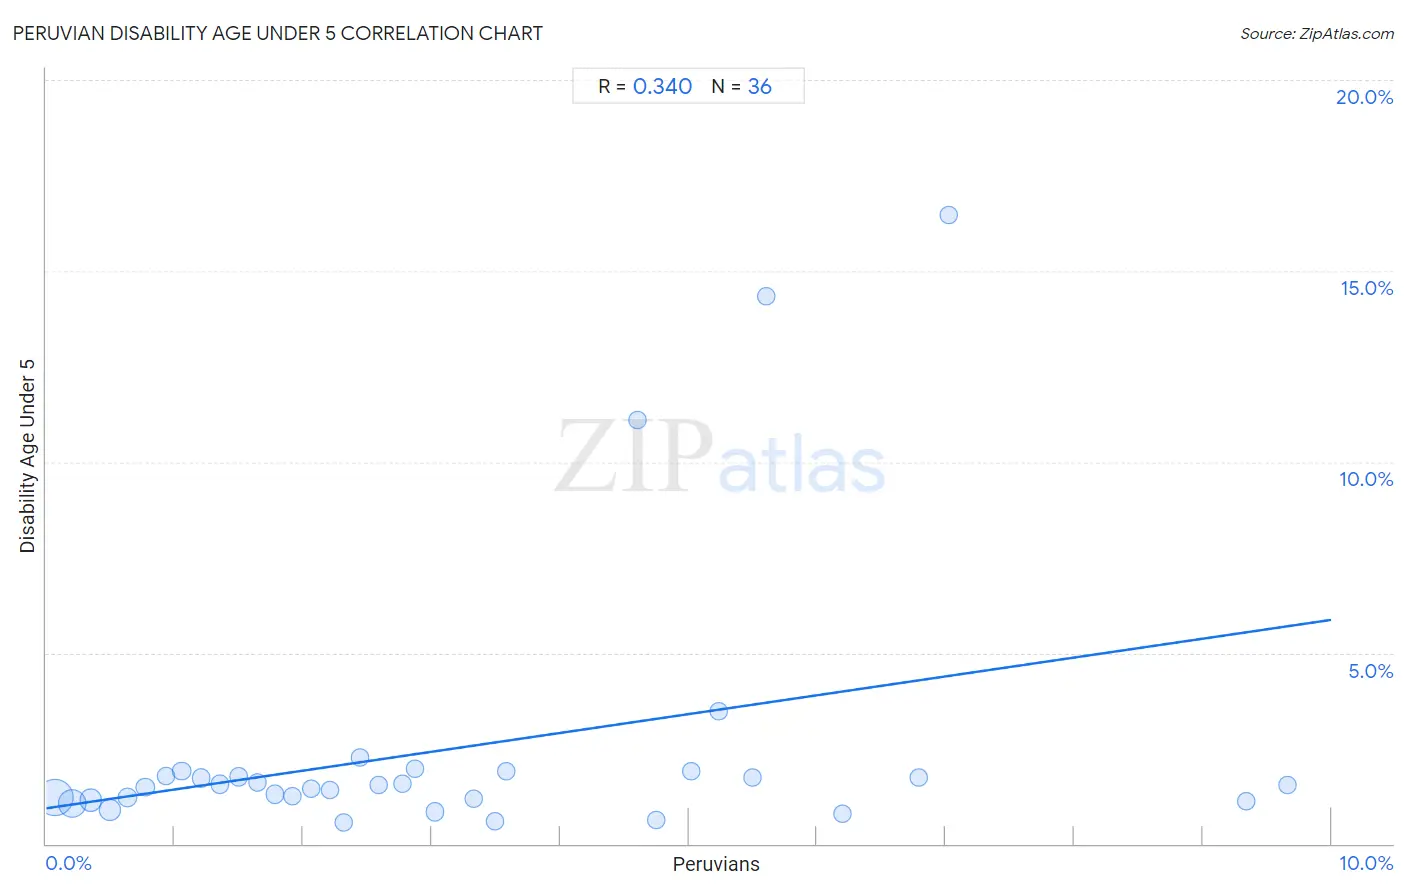
Peruvian Disability Age Under 5 Correlation Chart

The statistical analysis conducted on geographies consisting of 205,658,783 people shows a mild positive correlation between the proportion of Peruvians and percentage of population with a disability under the age of 5 in the United States with a correlation coefficient (R) of 0.340 and weighted average of 1.3%. On average, for every 1% (one percent) increase in Peruvians within a typical geography, there is an increase of 0.49% in percentage of population with a disability under the age of 5.
Peruvian Disability Age Under 5
It is essential to understand that the correlation between the percentage of Peruvians and percentage of population with a disability under the age of 5 does not imply a direct cause-and-effect relationship. It remains uncertain whether the presence of Peruvians influences an upward or downward trend in the level of percentage of population with a disability under the age of 5 within an area, or if Peruvians simply ended up residing in those areas with higher or lower levels of percentage of population with a disability under the age of 5 due to other factors.

Demographics Similar to Peruvians by Disability Age Under 5

In terms of disability age under 5, the demographic groups most similar to Peruvians are Immigrants from Laos (1.3%, a difference of 0.090%), Mexican American Indian (1.3%, a difference of 0.10%), Immigrants from Bosnia and Herzegovina (1.3%, a difference of 0.10%), Immigrants from Sierra Leone (1.3%, a difference of 0.11%), and Haitian (1.3%, a difference of 0.22%).
DemographicsRating | RankDisability Age Under 5
Immigrants from Saudi Arabia
43.3
/100
|
#183
Average
1.2%
Palestinians
43.0
/100
|
#184
Average
1.2%
Immigrants from Western Africa
42.5
/100
|
#185
Average
1.2%
Cubans
42.5
/100
|
#186
Average
1.2%
Immigrants from Haiti
40.2
/100
|
#187
Average
1.3%
Haitians
39.9
/100
|
#188
Fair
1.3%
Peruvians
37.6
/100
|
#189
Fair
1.3%
Immigrants from Laos
36.6
/100
|
#190
Fair
1.3%
Mexican American Indians
36.6
/100
|
#191
Fair
1.3%
Immigrants from Bosnia and Herzegovina
36.5
/100
|
#192
Fair
1.3%
Immigrants from Sierra Leone
36.5
/100
|
#193
Fair
1.3%
Immigrants from North Macedonia
34.7
/100
|
#194
Fair
1.3%
U.S. Virgin Islanders
34.4
/100
|
#195
Fair
1.3%
Immigrants from Belgium
31.4
/100
|
#196
Fair
1.3%

Peruvian Disability Age Under 5 Correlation Summary

MeasurementPeruvian DataDisability Age Under 5 Data
Minimum0.071%0.55%
Maximum9.7%16.5%
Range9.6%15.9%
Mean3.2%2.5%
Median2.5%1.6%
Interquartile 25% (IQ1)1.3%1.2%
Interquartile 75% (IQ3)4.9%1.8%
Interquartile Range (IQR)3.6%0.66%
Standard Deviation (Sample)2.5%3.6%
Standard Deviation (Population)2.5%3.6%

Correlation Details

Peruvian PercentileSample SizeDisability Age Under 5
[
0.0%
-
0.5%
]
0.071%
91,152,7451.2%
[
0.0%
-
0.5%
]
0.20%
51,204,2701.0%
[
0.0%
-
0.5%
]
0.35%
22,755,8371.1%
[
0.0%
-
0.5%
]
0.49%
18,852,7720.88%
[
0.5%
-
1.0%
]
0.64%
6,460,5961.2%
[
0.5%
-
1.0%
]
0.77%
3,274,3561.5%
[
0.5%
-
1.0%
]
0.93%
2,215,6131.8%
[
1.0%
-
1.5%
]
1.05%
2,036,2821.9%
[
1.0%
-
1.5%
]
1.21%
1,138,7871.7%
[
1.0%
-
1.5%
]
1.35%
957,7291.6%
[
1.0%
-
1.5%
]
1.50%
665,4661.8%
[
1.5%
-
2.0%
]
1.65%
514,4781.6%
[
1.5%
-
2.0%
]
1.78%
853,0781.3%
[
1.5%
-
2.0%
]
1.91%
763,5051.2%
[
2.0%
-
2.5%
]
2.06%
396,3561.5%
[
2.0%
-
2.5%
]
2.21%
86,6711.4%
[
2.0%
-
2.5%
]
2.32%
344,2550.55%
[
2.0%
-
2.5%
]
2.44%
151,8692.3%
[
2.5%
-
3.0%
]
2.59%
417,7091.5%
[
2.5%
-
3.0%
]
2.77%
274,3891.6%
[
2.5%
-
3.0%
]
2.87%
81,5902.0%
[
3.0%
-
3.5%
]
3.02%
314,5820.84%
[
3.0%
-
3.5%
]
3.33%
250,1191.2%
[
3.0%
-
3.5%
]
3.49%
100,3270.59%
[
3.5%
-
4.0%
]
3.58%
10,5911.9%
[
4.5%
-
5.0%
]
4.60%
26,07711.1%
[
4.5%
-
5.0%
]
4.75%
59,4210.63%
[
5.0%
-
5.5%
]
5.02%
27,9281.9%
[
5.0%
-
5.5%
]
5.23%
33,6913.5%
[
5.5%
-
6.0%
]
5.50%
10,2351.7%
[
5.5%
-
6.0%
]
5.60%
6,92914.3%
[
6.0%
-
6.5%
]
6.19%
174,2930.77%
[
6.5%
-
7.0%
]
6.79%
19,6251.7%
[
7.0%
-
7.5%
]
7.03%
2,66116.5%
[
9.0%
-
9.5%
]
9.34%
22,3771.1%
[
9.5%
-
10.0%
]
9.66%
1,5741.6%