Blackfeet Disability Age Under 5
COMPARE
Blackfeet
Select to Compare
Disability Age Under 5
Blackfeet Disability Age Under 5
1.6%
DISABILITY | AGE UNDER 5
0.0/ 100
METRIC RATING
305th/ 347
METRIC RANK
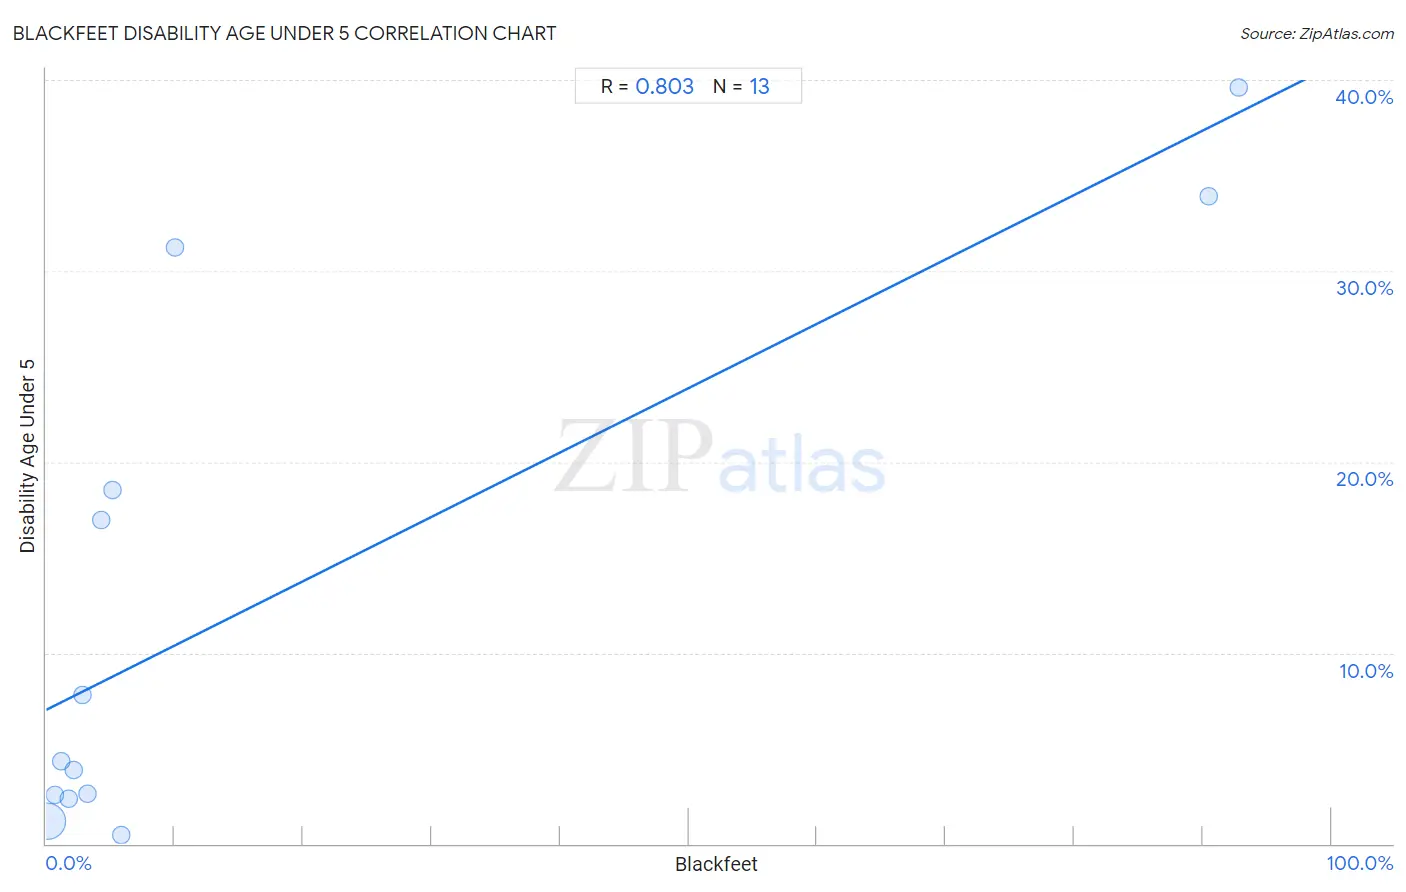
Blackfeet Disability Age Under 5 Correlation Chart
The statistical analysis conducted on geographies consisting of 184,518,312 people shows a very strong positive correlation between the proportion of Blackfeet and percentage of population with a disability under the age of 5 in the United States with a correlation coefficient (R) of 0.803 and weighted average of 1.6%. On average, for every 1% (one percent) increase in Blackfeet within a typical geography, there is an increase of 0.34% in percentage of population with a disability under the age of 5.
It is essential to understand that the correlation between the percentage of Blackfeet and percentage of population with a disability under the age of 5 does not imply a direct cause-and-effect relationship. It remains uncertain whether the presence of Blackfeet influences an upward or downward trend in the level of percentage of population with a disability under the age of 5 within an area, or if Blackfeet simply ended up residing in those areas with higher or lower levels of percentage of population with a disability under the age of 5 due to other factors.
Demographics Similar to Blackfeet by Disability Age Under 5
In terms of disability age under 5, the demographic groups most similar to Blackfeet are Creek (1.6%, a difference of 0.040%), Scottish (1.6%, a difference of 0.10%), Seminole (1.6%, a difference of 0.16%), Navajo (1.6%, a difference of 0.25%), and Swiss (1.6%, a difference of 0.79%).
| Demographics | Rating | Rank | Disability Age Under 5 |
| Cajuns | 0.0 /100 | #298 | Tragic 1.6% |
| Portuguese | 0.0 /100 | #299 | Tragic 1.6% |
| Shoshone | 0.0 /100 | #300 | Tragic 1.6% |
| German Russians | 0.0 /100 | #301 | Tragic 1.6% |
| Welsh | 0.0 /100 | #302 | Tragic 1.6% |
| Swiss | 0.0 /100 | #303 | Tragic 1.6% |
| Seminole | 0.0 /100 | #304 | Tragic 1.6% |
| Blackfeet | 0.0 /100 | #305 | Tragic 1.6% |
| Creek | 0.0 /100 | #306 | Tragic 1.6% |
| Scottish | 0.0 /100 | #307 | Tragic 1.6% |
| Navajo | 0.0 /100 | #308 | Tragic 1.6% |
| Cape Verdeans | 0.0 /100 | #309 | Tragic 1.7% |
| Whites/Caucasians | 0.0 /100 | #310 | Tragic 1.7% |
| English | 0.0 /100 | #311 | Tragic 1.7% |
| Puerto Ricans | 0.0 /100 | #312 | Tragic 1.7% |
Blackfeet Disability Age Under 5 Correlation Summary
| Measurement | Blackfeet Data | Disability Age Under 5 Data |
| Minimum | 0.080% | 0.46% |
| Maximum | 92.8% | 39.6% |
| Range | 92.7% | 39.1% |
| Mean | 17.0% | 12.7% |
| Median | 3.2% | 4.4% |
| Interquartile 25% (IQ1) | 1.5% | 2.4% |
| Interquartile 75% (IQ3) | 7.9% | 24.9% |
| Interquartile Range (IQR) | 6.5% | 22.5% |
| Standard Deviation (Sample) | 33.2% | 14.0% |
| Standard Deviation (Population) | 31.9% | 13.4% |
Correlation Details
| Blackfeet Percentile | Sample Size | Disability Age Under 5 |
[ 0.0% - 0.5% ] 0.080% | 181,989,821 | 1.2% |
[ 0.5% - 1.0% ] 0.67% | 2,006,968 | 2.5% |
[ 1.0% - 1.5% ] 1.21% | 194,884 | 4.4% |
[ 1.5% - 2.0% ] 1.77% | 254,493 | 2.4% |
[ 2.0% - 2.5% ] 2.17% | 38,519 | 3.9% |
[ 2.5% - 3.0% ] 2.80% | 5,043 | 7.8% |
[ 3.0% - 3.5% ] 3.21% | 17,568 | 2.6% |
[ 4.0% - 4.5% ] 4.32% | 1,619 | 17.0% |
[ 5.0% - 5.5% ] 5.13% | 936 | 18.5% |
[ 5.5% - 6.0% ] 5.88% | 7,057 | 0.46% |
[ 10.0% - 10.5% ] 10.00% | 160 | 31.2% |
[ 90.0% - 90.5% ] 90.43% | 690 | 33.9% |
[ 92.5% - 93.0% ] 92.78% | 554 | 39.6% |