Guatemalan Disability Age Under 5
COMPARE
Guatemalan
Select to Compare
Disability Age Under 5
Guatemalan Disability Age Under 5
1.2%
DISABILITY | AGE UNDER 5
63.6/ 100
METRIC RATING
162nd/ 347
METRIC RANK
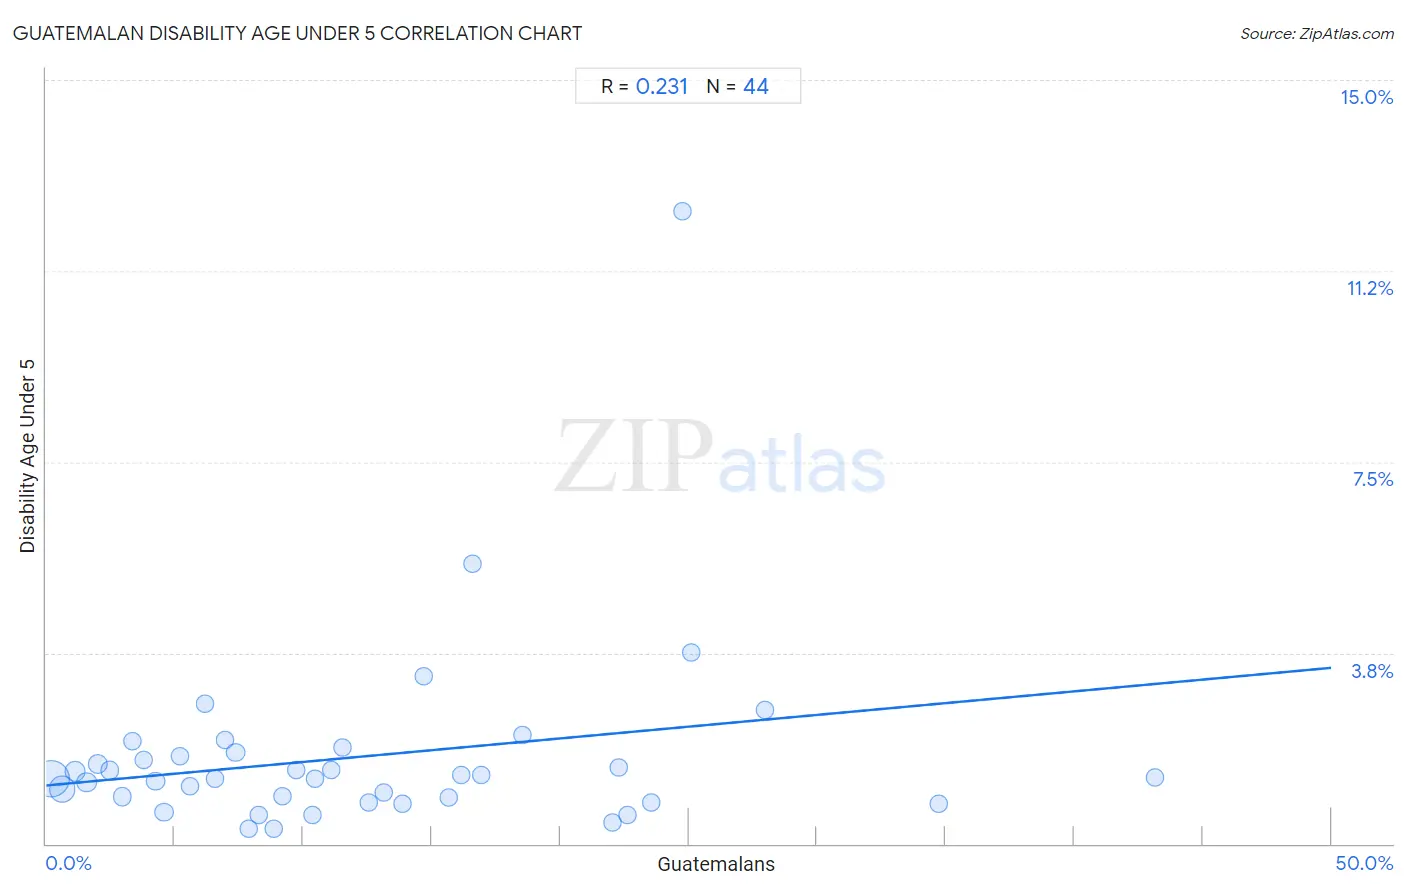
Guatemalan Disability Age Under 5 Correlation Chart
The statistical analysis conducted on geographies consisting of 225,218,414 people shows a weak positive correlation between the proportion of Guatemalans and percentage of population with a disability under the age of 5 in the United States with a correlation coefficient (R) of 0.231 and weighted average of 1.2%. On average, for every 1% (one percent) increase in Guatemalans within a typical geography, there is an increase of 0.046% in percentage of population with a disability under the age of 5.
It is essential to understand that the correlation between the percentage of Guatemalans and percentage of population with a disability under the age of 5 does not imply a direct cause-and-effect relationship. It remains uncertain whether the presence of Guatemalans influences an upward or downward trend in the level of percentage of population with a disability under the age of 5 within an area, or if Guatemalans simply ended up residing in those areas with higher or lower levels of percentage of population with a disability under the age of 5 due to other factors.
Demographics Similar to Guatemalans by Disability Age Under 5
In terms of disability age under 5, the demographic groups most similar to Guatemalans are Immigrants from Guatemala (1.2%, a difference of 0.030%), Laotian (1.2%, a difference of 0.080%), Immigrants from Kuwait (1.2%, a difference of 0.10%), Immigrants from Africa (1.2%, a difference of 0.15%), and Immigrants from Central America (1.2%, a difference of 0.21%).
| Demographics | Rating | Rank | Disability Age Under 5 |
| Immigrants from Ghana | 68.7 /100 | #155 | Good 1.2% |
| Hawaiians | 68.5 /100 | #156 | Good 1.2% |
| Immigrants from South America | 67.0 /100 | #157 | Good 1.2% |
| Arabs | 66.4 /100 | #158 | Good 1.2% |
| Colombians | 65.8 /100 | #159 | Good 1.2% |
| Immigrants from Latin America | 65.8 /100 | #160 | Good 1.2% |
| Immigrants from Africa | 65.1 /100 | #161 | Good 1.2% |
| Guatemalans | 63.6 /100 | #162 | Good 1.2% |
| Immigrants from Guatemala | 63.2 /100 | #163 | Good 1.2% |
| Laotians | 62.8 /100 | #164 | Good 1.2% |
| Immigrants from Kuwait | 62.6 /100 | #165 | Good 1.2% |
| Immigrants from Central America | 61.4 /100 | #166 | Good 1.2% |
| Immigrants from Argentina | 60.2 /100 | #167 | Good 1.2% |
| Sierra Leoneans | 59.1 /100 | #168 | Average 1.2% |
| Immigrants from Uruguay | 59.0 /100 | #169 | Average 1.2% |
Guatemalan Disability Age Under 5 Correlation Summary
| Measurement | Guatemalan Data | Disability Age Under 5 Data |
| Minimum | 0.19% | 0.29% |
| Maximum | 43.1% | 12.4% |
| Range | 43.0% | 12.1% |
| Mean | 12.2% | 1.7% |
| Median | 10.0% | 1.3% |
| Interquartile 25% (IQ1) | 4.9% | 0.86% |
| Interquartile 75% (IQ3) | 16.8% | 1.8% |
| Interquartile Range (IQR) | 11.9% | 0.90% |
| Standard Deviation (Sample) | 9.6% | 1.9% |
| Standard Deviation (Population) | 9.5% | 1.9% |
Correlation Details
| Guatemalan Percentile | Sample Size | Disability Age Under 5 |
[ 0.0% - 0.5% ] 0.19% | 123,810,113 | 1.3% |
[ 0.5% - 1.0% ] 0.63% | 53,238,597 | 1.1% |
[ 1.0% - 1.5% ] 1.12% | 15,698,455 | 1.4% |
[ 1.5% - 2.0% ] 1.57% | 11,068,453 | 1.2% |
[ 2.0% - 2.5% ] 2.00% | 4,882,696 | 1.6% |
[ 2.0% - 2.5% ] 2.46% | 3,405,482 | 1.4% |
[ 2.5% - 3.0% ] 2.97% | 2,485,156 | 0.92% |
[ 3.0% - 3.5% ] 3.35% | 975,542 | 2.0% |
[ 3.5% - 4.0% ] 3.79% | 801,128 | 1.6% |
[ 4.0% - 4.5% ] 4.26% | 935,164 | 1.2% |
[ 4.5% - 5.0% ] 4.59% | 4,181,254 | 0.62% |
[ 5.0% - 5.5% ] 5.21% | 472,038 | 1.7% |
[ 5.5% - 6.0% ] 5.59% | 219,800 | 1.1% |
[ 6.0% - 6.5% ] 6.18% | 102,186 | 2.8% |
[ 6.5% - 7.0% ] 6.56% | 224,629 | 1.3% |
[ 6.5% - 7.0% ] 6.97% | 219,959 | 2.0% |
[ 7.0% - 7.5% ] 7.37% | 494,808 | 1.8% |
[ 7.5% - 8.0% ] 7.86% | 105,184 | 0.29% |
[ 8.0% - 8.5% ] 8.26% | 249,850 | 0.56% |
[ 8.5% - 9.0% ] 8.86% | 153,013 | 0.29% |
[ 9.0% - 9.5% ] 9.19% | 217,292 | 0.93% |
[ 9.5% - 10.0% ] 9.71% | 135,915 | 1.4% |
[ 10.0% - 10.5% ] 10.36% | 170,051 | 0.56% |
[ 10.0% - 10.5% ] 10.44% | 122,399 | 1.3% |
[ 11.0% - 11.5% ] 11.07% | 316,172 | 1.5% |
[ 11.5% - 12.0% ] 11.51% | 47,920 | 1.9% |
[ 12.5% - 13.0% ] 12.54% | 89,007 | 0.81% |
[ 13.0% - 13.5% ] 13.13% | 40,927 | 1.0% |
[ 13.5% - 14.0% ] 13.84% | 25,010 | 0.78% |
[ 14.5% - 15.0% ] 14.69% | 28,754 | 3.3% |
[ 15.5% - 16.0% ] 15.66% | 45,023 | 0.90% |
[ 16.0% - 16.5% ] 16.15% | 42,629 | 1.4% |
[ 16.5% - 17.0% ] 16.56% | 6,074 | 5.5% |
[ 16.5% - 17.0% ] 16.94% | 9,531 | 1.3% |
[ 18.5% - 19.0% ] 18.51% | 1,275 | 2.1% |
[ 22.0% - 22.5% ] 22.04% | 19,513 | 0.42% |
[ 22.0% - 22.5% ] 22.25% | 6,624 | 1.5% |
[ 22.5% - 23.0% ] 22.60% | 36,405 | 0.56% |
[ 23.5% - 24.0% ] 23.56% | 50,387 | 0.81% |
[ 24.5% - 25.0% ] 24.77% | 5,627 | 12.4% |
[ 25.0% - 25.5% ] 25.09% | 47,142 | 3.7% |
[ 27.5% - 28.0% ] 27.98% | 2,205 | 2.6% |
[ 34.5% - 35.0% ] 34.75% | 7,247 | 0.79% |
[ 43.0% - 43.5% ] 43.14% | 21,778 | 1.3% |