Ethiopian Disability Age Under 5
COMPARE
Ethiopian
Select to Compare
Disability Age Under 5
Ethiopian Disability Age Under 5
1.1%
DISABILITY | AGE UNDER 5
97.2/ 100
METRIC RATING
89th/ 347
METRIC RANK
Ethiopian Disability Age Under 5 Correlation Chart
The statistical analysis conducted on geographies consisting of 145,731,727 people shows a slight negative correlation between the proportion of Ethiopians and percentage of population with a disability under the age of 5 in the United States with a correlation coefficient (R) of -0.079 and weighted average of 1.1%. On average, for every 1% (one percent) increase in Ethiopians within a typical geography, there is a decrease of 0.017% in percentage of population with a disability under the age of 5.
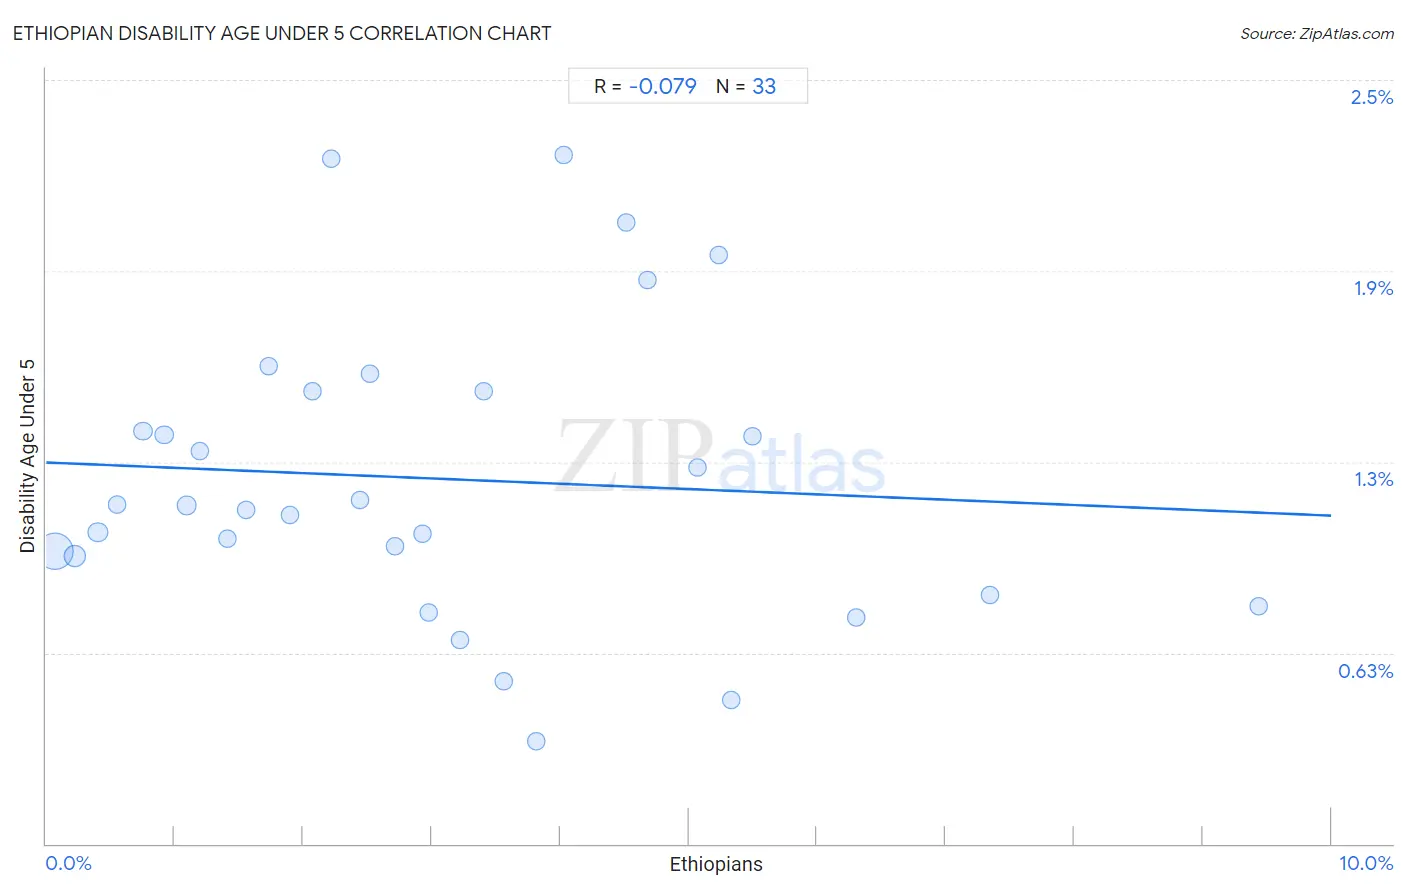
It is essential to understand that the correlation between the percentage of Ethiopians and percentage of population with a disability under the age of 5 does not imply a direct cause-and-effect relationship. It remains uncertain whether the presence of Ethiopians influences an upward or downward trend in the level of percentage of population with a disability under the age of 5 within an area, or if Ethiopians simply ended up residing in those areas with higher or lower levels of percentage of population with a disability under the age of 5 due to other factors.
Demographics Similar to Ethiopians by Disability Age Under 5
In terms of disability age under 5, the demographic groups most similar to Ethiopians are Chinese (1.1%, a difference of 0.030%), Albanian (1.1%, a difference of 0.070%), Immigrants from Cuba (1.1%, a difference of 0.24%), Spanish American (1.1%, a difference of 0.27%), and Immigrants from Dominican Republic (1.1%, a difference of 0.28%).
| Demographics | Rating | Rank | Disability Age Under 5 |
| Immigrants from Jordan | 97.9 /100 | #82 | Exceptional 1.1% |
| Immigrants from Syria | 97.9 /100 | #83 | Exceptional 1.1% |
| Immigrants from Zaire | 97.8 /100 | #84 | Exceptional 1.1% |
| Sudanese | 97.7 /100 | #85 | Exceptional 1.1% |
| Okinawans | 97.6 /100 | #86 | Exceptional 1.1% |
| Ugandans | 97.5 /100 | #87 | Exceptional 1.1% |
| Immigrants from Dominican Republic | 97.5 /100 | #88 | Exceptional 1.1% |
| Ethiopians | 97.2 /100 | #89 | Exceptional 1.1% |
| Chinese | 97.2 /100 | #90 | Exceptional 1.1% |
| Albanians | 97.2 /100 | #91 | Exceptional 1.1% |
| Immigrants from Cuba | 97.0 /100 | #92 | Exceptional 1.1% |
| Spanish Americans | 96.9 /100 | #93 | Exceptional 1.1% |
| Sri Lankans | 96.8 /100 | #94 | Exceptional 1.1% |
| Immigrants from Moldova | 96.8 /100 | #95 | Exceptional 1.1% |
| Mongolians | 96.6 /100 | #96 | Exceptional 1.1% |
Ethiopian Disability Age Under 5 Correlation Summary
| Measurement | Ethiopian Data | Disability Age Under 5 Data |
| Minimum | 0.065% | 0.34% |
| Maximum | 9.4% | 2.3% |
| Range | 9.4% | 1.9% |
| Mean | 3.1% | 1.2% |
| Median | 2.7% | 1.1% |
| Interquartile 25% (IQ1) | 1.3% | 0.88% |
| Interquartile 75% (IQ3) | 4.6% | 1.5% |
| Interquartile Range (IQR) | 3.3% | 0.60% |
| Standard Deviation (Sample) | 2.2% | 0.48% |
| Standard Deviation (Population) | 2.2% | 0.47% |
Correlation Details
| Ethiopian Percentile | Sample Size | Disability Age Under 5 |
[ 0.0% - 0.5% ] 0.065% | 98,420,355 | 0.96% |
[ 0.0% - 0.5% ] 0.22% | 21,642,010 | 0.94% |
[ 0.0% - 0.5% ] 0.40% | 9,074,479 | 1.0% |
[ 0.5% - 1.0% ] 0.55% | 4,713,107 | 1.1% |
[ 0.5% - 1.0% ] 0.75% | 1,286,600 | 1.3% |
[ 0.5% - 1.0% ] 0.92% | 1,738,075 | 1.3% |
[ 1.0% - 1.5% ] 1.09% | 1,886,733 | 1.1% |
[ 1.0% - 1.5% ] 1.20% | 1,783,114 | 1.3% |
[ 1.0% - 1.5% ] 1.41% | 926,154 | 1.00% |
[ 1.5% - 2.0% ] 1.56% | 1,106,828 | 1.1% |
[ 1.5% - 2.0% ] 1.74% | 559,846 | 1.6% |
[ 1.5% - 2.0% ] 1.89% | 324,705 | 1.1% |
[ 2.0% - 2.5% ] 2.07% | 175,261 | 1.5% |
[ 2.0% - 2.5% ] 2.22% | 239,677 | 2.2% |
[ 2.0% - 2.5% ] 2.44% | 32,569 | 1.1% |
[ 2.5% - 3.0% ] 2.52% | 144,112 | 1.5% |
[ 2.5% - 3.0% ] 2.71% | 64,599 | 0.98% |
[ 2.5% - 3.0% ] 2.92% | 73,250 | 1.0% |
[ 2.5% - 3.0% ] 2.98% | 310,577 | 0.76% |
[ 3.0% - 3.5% ] 3.22% | 135,510 | 0.67% |
[ 3.0% - 3.5% ] 3.40% | 179,679 | 1.5% |
[ 3.5% - 4.0% ] 3.56% | 98,704 | 0.53% |
[ 3.5% - 4.0% ] 3.81% | 52,360 | 0.34% |
[ 4.0% - 4.5% ] 4.03% | 88,156 | 2.3% |
[ 4.5% - 5.0% ] 4.52% | 250,655 | 2.0% |
[ 4.5% - 5.0% ] 4.68% | 16,632 | 1.8% |
[ 5.0% - 5.5% ] 5.07% | 83,690 | 1.2% |
[ 5.0% - 5.5% ] 5.24% | 151,577 | 1.9% |
[ 5.0% - 5.5% ] 5.33% | 55,439 | 0.47% |
[ 5.0% - 5.5% ] 5.50% | 22,966 | 1.3% |
[ 6.0% - 6.5% ] 6.31% | 24,785 | 0.74% |
[ 7.0% - 7.5% ] 7.34% | 19,812 | 0.81% |
[ 9.0% - 9.5% ] 9.44% | 49,711 | 0.78% |