Estonian Disability Age Under 5

COMPARE

Estonian
Race
Ancestry
AfghanAfricanAlaska NativeAlaskan AthabascanAlbanianAleutAlsatianAmericanApacheArabArapahoArgentineanArmenianAssyrian/Chaldean/SyriacAustralianAustrianBahamianBangladeshiBarbadianBasqueBelgianBelizeanBermudanBhutaneseBlackfeetBolivianBrazilianBritishBritish West IndianBulgarianBurmeseCajunCambodianCanadianCape VerdeanCarpatho RusynCelticCentral AmericanCentral American IndianCherokeeCheyenneChickasawChileanChineseChippewaChoctawColombianColvilleComancheCosta RicanCreeCreekCroatianCrowCubanCypriotCzechCzechoslovakianDanishDelawareDominicanDutchDutch West IndianEastern EuropeanEcuadorianEgyptianEnglishEstonianEthiopianEuropeanFijianFilipinoFinnishFrenchFrench American IndianFrench CanadianGermanGerman RussianGhanaianGreekGuamanian/ChamorroGuatemalanGuyaneseHaitianHmongHonduranHopiHoumaHungarianIcelanderIndian (Asian)IndonesianInupiatIranianIraqiIrishIroquoisIsraeliItalianJamaicanJapaneseJordanianKenyanKiowaKoreanLaotianLatvianLebaneseLiberianLithuanianLumbeeLuxembourgerMacedonianMalaysianMalteseMarshalleseMenomineeMexicanMexican American IndianMongolianMoroccanNative HawaiianNavajoNepaleseNew ZealanderNicaraguanNigerianNorthern EuropeanNorwegianOkinawanOsageOttawaPaiutePakistaniPalestinianPanamanianParaguayanPennsylvania GermanPeruvianPimaPolishPortuguesePotawatomiPuebloPuerto RicanPuget Sound SalishRomanianRussianSalvadoranSamoanScandinavianScotch-IrishScottishSeminoleSenegaleseSerbianShoshoneSierra LeoneanSiouxSlavicSlovakSloveneSomaliSouth AfricanSouth AmericanSouth American IndianSoviet UnionSpaniardSpanishSpanish AmericanSpanish American IndianSri LankanSubsaharan AfricanSudaneseSwedishSwissSyrianTaiwaneseThaiTlingit-HaidaTohono O'OdhamTonganTrinidadian and TobagonianTsimshianTurkishU.S. Virgin IslanderUgandanUkrainianUruguayanUteVenezuelanVietnameseWelshWest IndianYakamaYaquiYugoslavianYumanYup'ikZimbabwean
Immigration
NonimmigrantsImmigrantsAfghanistanAfricaAlbaniaArgentinaArmeniaAsiaAustraliaAustriaBahamasBangladeshBarbadosBelarusBelgiumBelizeBoliviaBosnia and HerzegovinaBrazilBulgariaBurma/MyanmarCabo VerdeCambodiaCameroonCanadaCaribbeanCentral AmericaChileChinaColombiaCongoCosta RicaCroatiaCubaCzechoslovakiaDenmarkDominicaDominican RepublicEastern AfricaEastern AsiaEastern EuropeEcuadorEgyptEl SalvadorEnglandEritreaEthiopiaEuropeFijiFranceGermanyGhanaGreeceGrenadaGuatemalaGuyanaHaitiHondurasHong KongHungaryIndiaIndonesiaIranIraqIrelandIsraelItalyJamaicaJapanJordanKazakhstanKenyaKoreaKuwaitLaosLatin AmericaLatviaLebanonLiberiaLithuaniaMalaysiaMexicoMicronesiaMiddle AfricaMoldovaMoroccoNepalNetherlandsNicaraguaNigeriaNorth AmericaNorth MacedoniaNorthern AfricaNorthern EuropeNorwayOceaniaPakistanPanamaPeruPhilippinesPolandPortugalRomaniaRussiaSaudi ArabiaScotlandSenegalSerbiaSierra LeoneSingaporeSomaliaSouth AfricaSouth AmericaSouth Central AsiaSouth Eastern AsiaSouthern EuropeSpainSri LankaSt. Vincent and the GrenadinesSudanSwedenSwitzerlandSyriaTaiwanThailandTrinidad and TobagoTurkeyUgandaUkraineUruguayUzbekistanVenezuelaVietnamWest IndiesWestern AfricaWestern AsiaWestern EuropeYemenZaireZimbabweAzores
Select to Compare
Race
Ancestry
AfghanAfricanAlaska NativeAlaskan AthabascanAlbanianAleutAlsatianAmericanApacheArabArapahoArgentineanArmenianAssyrian/Chaldean/SyriacAustralianAustrianBahamianBangladeshiBarbadianBasqueBelgianBelizeanBermudanBhutaneseBlackfeetBolivianBrazilianBritishBritish West IndianBulgarianBurmeseCajunCambodianCanadianCape VerdeanCarpatho RusynCelticCentral AmericanCentral American IndianCherokeeCheyenneChickasawChileanChineseChippewaChoctawColombianColvilleComancheCosta RicanCreeCreekCroatianCrowCubanCypriotCzechCzechoslovakianDanishDelawareDominicanDutchDutch West IndianEastern EuropeanEcuadorianEgyptianEnglishEthiopianEuropeanFijianFilipinoFinnishFrenchFrench American IndianFrench CanadianGermanGerman RussianGhanaianGreekGuamanian/ChamorroGuatemalanGuyaneseHaitianHmongHonduranHopiHoumaHungarianIcelanderIndian (Asian)IndonesianInupiatIranianIraqiIrishIroquoisIsraeliItalianJamaicanJapaneseJordanianKenyanKiowaKoreanLaotianLatvianLebaneseLiberianLithuanianLumbeeLuxembourgerMacedonianMalaysianMalteseMarshalleseMenomineeMexicanMexican American IndianMongolianMoroccanNative HawaiianNavajoNepaleseNew ZealanderNicaraguanNigerianNorthern EuropeanNorwegianOkinawanOsageOttawaPaiutePakistaniPalestinianPanamanianParaguayanPennsylvania GermanPeruvianPimaPolishPortuguesePotawatomiPuebloPuerto RicanPuget Sound SalishRomanianRussianSalvadoranSamoanScandinavianScotch-IrishScottishSeminoleSenegaleseSerbianShoshoneSierra LeoneanSiouxSlavicSlovakSloveneSomaliSouth AfricanSouth AmericanSouth American IndianSoviet UnionSpaniardSpanishSpanish AmericanSpanish American IndianSri LankanSubsaharan AfricanSudaneseSwedishSwissSyrianTaiwaneseThaiTlingit-HaidaTohono O'OdhamTonganTrinidadian and TobagonianTsimshianTurkishU.S. Virgin IslanderUgandanUkrainianUruguayanUteVenezuelanVietnameseWelshWest IndianYakamaYaquiYugoslavianYumanYup'ikZimbabwean
Immigration
NonimmigrantsImmigrantsAfghanistanAfricaAlbaniaArgentinaArmeniaAsiaAustraliaAustriaBahamasBangladeshBarbadosBelarusBelgiumBelizeBoliviaBosnia and HerzegovinaBrazilBulgariaBurma/MyanmarCabo VerdeCambodiaCameroonCanadaCaribbeanCentral AmericaChileChinaColombiaCongoCosta RicaCroatiaCubaCzechoslovakiaDenmarkDominicaDominican RepublicEastern AfricaEastern AsiaEastern EuropeEcuadorEgyptEl SalvadorEnglandEritreaEthiopiaEuropeFijiFranceGermanyGhanaGreeceGrenadaGuatemalaGuyanaHaitiHondurasHong KongHungaryIndiaIndonesiaIranIraqIrelandIsraelItalyJamaicaJapanJordanKazakhstanKenyaKoreaKuwaitLaosLatin AmericaLatviaLebanonLiberiaLithuaniaMalaysiaMexicoMicronesiaMiddle AfricaMoldovaMoroccoNepalNetherlandsNicaraguaNigeriaNorth AmericaNorth MacedoniaNorthern AfricaNorthern EuropeNorwayOceaniaPakistanPanamaPeruPhilippinesPolandPortugalRomaniaRussiaSaudi ArabiaScotlandSenegalSerbiaSierra LeoneSingaporeSomaliaSouth AfricaSouth AmericaSouth Central AsiaSouth Eastern AsiaSouthern EuropeSpainSri LankaSt. Vincent and the GrenadinesSudanSwedenSwitzerlandSyriaTaiwanThailandTrinidad and TobagoTurkeyUgandaUkraineUruguayUzbekistanVenezuelaVietnamWest IndiesWestern AfricaWestern AsiaWestern EuropeYemenZaireZimbabweAzores
Disability Age Under 5
Income
Poverty
Unemployment
Labor Participation
Family Structure
Vehicle Availability
Education Level
Disability

Estonian Disability Age Under 5
Tragic

1.5%
DISABILITY | AGE UNDER 5
0.0/ 100
METRIC RATING
288th/ 347
METRIC RANK

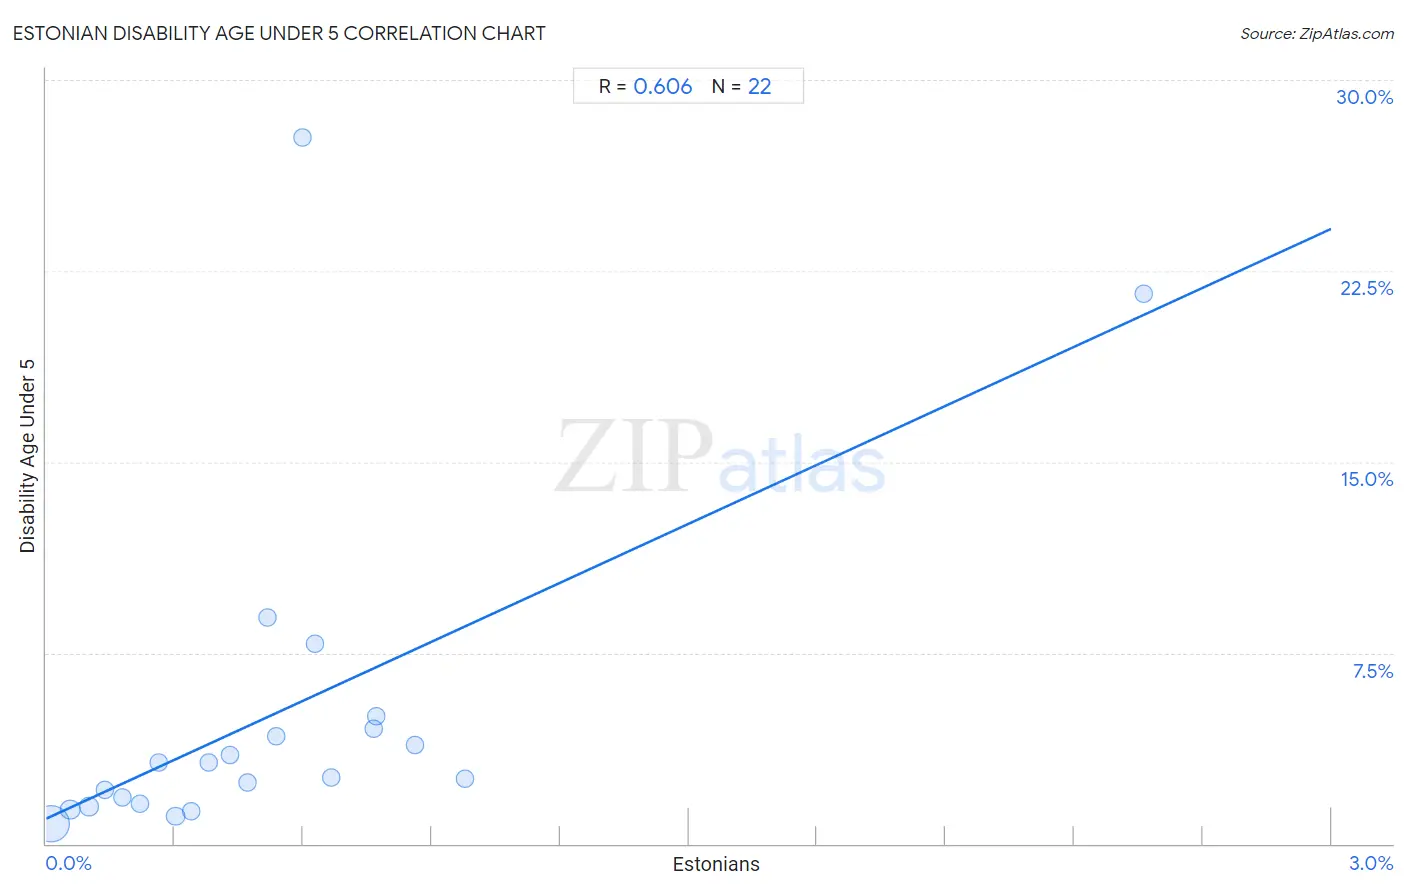
Estonian Disability Age Under 5 Correlation Chart

The statistical analysis conducted on geographies consisting of 87,399,197 people shows a significant positive correlation between the proportion of Estonians and percentage of population with a disability under the age of 5 in the United States with a correlation coefficient (R) of 0.606 and weighted average of 1.5%. On average, for every 1% (one percent) increase in Estonians within a typical geography, there is an increase of 7.7% in percentage of population with a disability under the age of 5.
Estonian Disability Age Under 5
It is essential to understand that the correlation between the percentage of Estonians and percentage of population with a disability under the age of 5 does not imply a direct cause-and-effect relationship. It remains uncertain whether the presence of Estonians influences an upward or downward trend in the level of percentage of population with a disability under the age of 5 within an area, or if Estonians simply ended up residing in those areas with higher or lower levels of percentage of population with a disability under the age of 5 due to other factors.

Demographics Similar to Estonians by Disability Age Under 5

In terms of disability age under 5, the demographic groups most similar to Estonians are Hungarian (1.5%, a difference of 0.14%), Scandinavian (1.5%, a difference of 0.18%), Tlingit-Haida (1.5%, a difference of 0.23%), Czech (1.5%, a difference of 0.26%), and Northern European (1.6%, a difference of 0.36%).
DemographicsRating | RankDisability Age Under 5
Czechoslovakians
0.0
/100
|
#281
Tragic
1.5%
Cheyenne
0.0
/100
|
#282
Tragic
1.5%
Delaware
0.0
/100
|
#283
Tragic
1.5%
Europeans
0.0
/100
|
#284
Tragic
1.5%
Croatians
0.0
/100
|
#285
Tragic
1.5%
Tlingit-Haida
0.0
/100
|
#286
Tragic
1.5%
Scandinavians
0.0
/100
|
#287
Tragic
1.5%
Estonians
0.0
/100
|
#288
Tragic
1.5%
Hungarians
0.0
/100
|
#289
Tragic
1.5%
Czechs
0.0
/100
|
#290
Tragic
1.5%
Northern Europeans
0.0
/100
|
#291
Tragic
1.6%
Italians
0.0
/100
|
#292
Tragic
1.6%
Lithuanians
0.0
/100
|
#293
Tragic
1.6%
Swedes
0.0
/100
|
#294
Tragic
1.6%
Finns
0.0
/100
|
#295
Tragic
1.6%

Estonian Disability Age Under 5 Correlation Summary

MeasurementEstonian DataDisability Age Under 5 Data
Minimum0.013%0.77%
Maximum2.6%27.7%
Range2.6%27.0%
Mean0.54%5.1%
Median0.45%2.9%
Interquartile 25% (IQ1)0.22%1.6%
Interquartile 75% (IQ3)0.67%4.5%
Interquartile Range (IQR)0.45%2.9%
Standard Deviation (Sample)0.53%6.7%
Standard Deviation (Population)0.52%6.6%

Correlation Details

Estonian PercentileSample SizeDisability Age Under 5
[
0.0%
-
0.5%
]
0.013%
74,566,0740.77%
[
0.0%
-
0.5%
]
0.057%
8,108,8581.3%
[
0.0%
-
0.5%
]
0.100%
2,248,0561.5%
[
0.0%
-
0.5%
]
0.14%
1,134,4982.1%
[
0.0%
-
0.5%
]
0.18%
517,5711.8%
[
0.0%
-
0.5%
]
0.22%
188,0761.6%
[
0.0%
-
0.5%
]
0.26%
132,9863.2%
[
0.0%
-
0.5%
]
0.30%
181,8111.1%
[
0.0%
-
0.5%
]
0.34%
10,0111.3%
[
0.0%
-
0.5%
]
0.38%
41,7093.2%
[
0.0%
-
0.5%
]
0.43%
64,8153.5%
[
0.0%
-
0.5%
]
0.47%
40,8692.4%
[
0.5%
-
1.0%
]
0.52%
8,5078.9%
[
0.5%
-
1.0%
]
0.54%
50,3734.2%
[
0.5%
-
1.0%
]
0.60%
5,00427.7%
[
0.5%
-
1.0%
]
0.63%
48,3707.9%
[
0.5%
-
1.0%
]
0.67%
29,8962.6%
[
0.5%
-
1.0%
]
0.76%
5,2334.5%
[
0.5%
-
1.0%
]
0.77%
3,2395.0%
[
0.5%
-
1.0%
]
0.86%
5,6943.9%
[
0.5%
-
1.0%
]
0.98%
4,5042.6%
[
2.5%
-
3.0%
]
2.56%
3,04321.6%