Immigrants from Liberia Disability Age Under 5

COMPARE

Immigrants from Liberia
Race
Ancestry
AfghanAfricanAlaska NativeAlaskan AthabascanAlbanianAleutAlsatianAmericanApacheArabArapahoArgentineanArmenianAssyrian/Chaldean/SyriacAustralianAustrianBahamianBangladeshiBarbadianBasqueBelgianBelizeanBermudanBhutaneseBlackfeetBolivianBrazilianBritishBritish West IndianBulgarianBurmeseCajunCambodianCanadianCape VerdeanCarpatho RusynCelticCentral AmericanCentral American IndianCherokeeCheyenneChickasawChileanChineseChippewaChoctawColombianColvilleComancheCosta RicanCreeCreekCroatianCrowCubanCypriotCzechCzechoslovakianDanishDelawareDominicanDutchDutch West IndianEastern EuropeanEcuadorianEgyptianEnglishEstonianEthiopianEuropeanFijianFilipinoFinnishFrenchFrench American IndianFrench CanadianGermanGerman RussianGhanaianGreekGuamanian/ChamorroGuatemalanGuyaneseHaitianHmongHonduranHopiHoumaHungarianIcelanderIndian (Asian)IndonesianInupiatIranianIraqiIrishIroquoisIsraeliItalianJamaicanJapaneseJordanianKenyanKiowaKoreanLaotianLatvianLebaneseLiberianLithuanianLumbeeLuxembourgerMacedonianMalaysianMalteseMarshalleseMenomineeMexicanMexican American IndianMongolianMoroccanNative HawaiianNavajoNepaleseNew ZealanderNicaraguanNigerianNorthern EuropeanNorwegianOkinawanOsageOttawaPaiutePakistaniPalestinianPanamanianParaguayanPennsylvania GermanPeruvianPimaPolishPortuguesePotawatomiPuebloPuerto RicanPuget Sound SalishRomanianRussianSalvadoranSamoanScandinavianScotch-IrishScottishSeminoleSenegaleseSerbianShoshoneSierra LeoneanSiouxSlavicSlovakSloveneSomaliSouth AfricanSouth AmericanSouth American IndianSoviet UnionSpaniardSpanishSpanish AmericanSpanish American IndianSri LankanSubsaharan AfricanSudaneseSwedishSwissSyrianTaiwaneseThaiTlingit-HaidaTohono O'OdhamTonganTrinidadian and TobagonianTsimshianTurkishU.S. Virgin IslanderUgandanUkrainianUruguayanUteVenezuelanVietnameseWelshWest IndianYakamaYaquiYugoslavianYumanYup'ikZimbabwean
Immigration
NonimmigrantsImmigrantsAfghanistanAfricaAlbaniaArgentinaArmeniaAsiaAustraliaAustriaBahamasBangladeshBarbadosBelarusBelgiumBelizeBoliviaBosnia and HerzegovinaBrazilBulgariaBurma/MyanmarCabo VerdeCambodiaCameroonCanadaCaribbeanCentral AmericaChileChinaColombiaCongoCosta RicaCroatiaCubaCzechoslovakiaDenmarkDominicaDominican RepublicEastern AfricaEastern AsiaEastern EuropeEcuadorEgyptEl SalvadorEnglandEritreaEthiopiaEuropeFijiFranceGermanyGhanaGreeceGrenadaGuatemalaGuyanaHaitiHondurasHong KongHungaryIndiaIndonesiaIranIraqIrelandIsraelItalyJamaicaJapanJordanKazakhstanKenyaKoreaKuwaitLaosLatin AmericaLatviaLebanonLiberiaLithuaniaMalaysiaMexicoMicronesiaMiddle AfricaMoldovaMoroccoNepalNetherlandsNicaraguaNigeriaNorth AmericaNorth MacedoniaNorthern AfricaNorthern EuropeNorwayOceaniaPakistanPanamaPeruPhilippinesPolandPortugalRomaniaRussiaSaudi ArabiaScotlandSenegalSerbiaSierra LeoneSingaporeSomaliaSouth AfricaSouth AmericaSouth Central AsiaSouth Eastern AsiaSouthern EuropeSpainSri LankaSt. Vincent and the GrenadinesSudanSwedenSwitzerlandSyriaTaiwanThailandTrinidad and TobagoTurkeyUgandaUkraineUruguayUzbekistanVenezuelaVietnamWest IndiesWestern AfricaWestern AsiaWestern EuropeYemenZaireZimbabweAzores
Select to Compare
Race
Ancestry
AfghanAfricanAlaska NativeAlaskan AthabascanAlbanianAleutAlsatianAmericanApacheArabArapahoArgentineanArmenianAssyrian/Chaldean/SyriacAustralianAustrianBahamianBangladeshiBarbadianBasqueBelgianBelizeanBermudanBhutaneseBlackfeetBolivianBrazilianBritishBritish West IndianBulgarianBurmeseCajunCambodianCanadianCape VerdeanCarpatho RusynCelticCentral AmericanCentral American IndianCherokeeCheyenneChickasawChileanChineseChippewaChoctawColombianColvilleComancheCosta RicanCreeCreekCroatianCrowCubanCypriotCzechCzechoslovakianDanishDelawareDominicanDutchDutch West IndianEastern EuropeanEcuadorianEgyptianEnglishEstonianEthiopianEuropeanFijianFilipinoFinnishFrenchFrench American IndianFrench CanadianGermanGerman RussianGhanaianGreekGuamanian/ChamorroGuatemalanGuyaneseHaitianHmongHonduranHopiHoumaHungarianIcelanderIndian (Asian)IndonesianInupiatIranianIraqiIrishIroquoisIsraeliItalianJamaicanJapaneseJordanianKenyanKiowaKoreanLaotianLatvianLebaneseLiberianLithuanianLumbeeLuxembourgerMacedonianMalaysianMalteseMarshalleseMenomineeMexicanMexican American IndianMongolianMoroccanNative HawaiianNavajoNepaleseNew ZealanderNicaraguanNigerianNorthern EuropeanNorwegianOkinawanOsageOttawaPaiutePakistaniPalestinianPanamanianParaguayanPennsylvania GermanPeruvianPimaPolishPortuguesePotawatomiPuebloPuerto RicanPuget Sound SalishRomanianRussianSalvadoranSamoanScandinavianScotch-IrishScottishSeminoleSenegaleseSerbianShoshoneSierra LeoneanSiouxSlavicSlovakSloveneSomaliSouth AfricanSouth AmericanSouth American IndianSoviet UnionSpaniardSpanishSpanish AmericanSpanish American IndianSri LankanSubsaharan AfricanSudaneseSwedishSwissSyrianTaiwaneseThaiTlingit-HaidaTohono O'OdhamTonganTrinidadian and TobagonianTsimshianTurkishU.S. Virgin IslanderUgandanUkrainianUruguayanUteVenezuelanVietnameseWelshWest IndianYakamaYaquiYugoslavianYumanYup'ikZimbabwean
Immigration
NonimmigrantsImmigrantsAfghanistanAfricaAlbaniaArgentinaArmeniaAsiaAustraliaAustriaBahamasBangladeshBarbadosBelarusBelgiumBelizeBoliviaBosnia and HerzegovinaBrazilBulgariaBurma/MyanmarCabo VerdeCambodiaCameroonCanadaCaribbeanCentral AmericaChileChinaColombiaCongoCosta RicaCroatiaCubaCzechoslovakiaDenmarkDominicaDominican RepublicEastern AfricaEastern AsiaEastern EuropeEcuadorEgyptEl SalvadorEnglandEritreaEthiopiaEuropeFijiFranceGermanyGhanaGreeceGrenadaGuatemalaGuyanaHaitiHondurasHong KongHungaryIndiaIndonesiaIranIraqIrelandIsraelItalyJamaicaJapanJordanKazakhstanKenyaKoreaKuwaitLaosLatin AmericaLatviaLebanonLithuaniaMalaysiaMexicoMicronesiaMiddle AfricaMoldovaMoroccoNepalNetherlandsNicaraguaNigeriaNorth AmericaNorth MacedoniaNorthern AfricaNorthern EuropeNorwayOceaniaPakistanPanamaPeruPhilippinesPolandPortugalRomaniaRussiaSaudi ArabiaScotlandSenegalSerbiaSierra LeoneSingaporeSomaliaSouth AfricaSouth AmericaSouth Central AsiaSouth Eastern AsiaSouthern EuropeSpainSri LankaSt. Vincent and the GrenadinesSudanSwedenSwitzerlandSyriaTaiwanThailandTrinidad and TobagoTurkeyUgandaUkraineUruguayUzbekistanVenezuelaVietnamWest IndiesWestern AfricaWestern AsiaWestern EuropeYemenZaireZimbabweAzores
Disability Age Under 5
Income
Poverty
Unemployment
Labor Participation
Family Structure
Vehicle Availability
Education Level
Disability

Immigrants from Liberia Disability Age Under 5
Tragic

1.4%
DISABILITY | AGE UNDER 5
0.6/ 100
METRIC RATING
255th/ 347
METRIC RANK

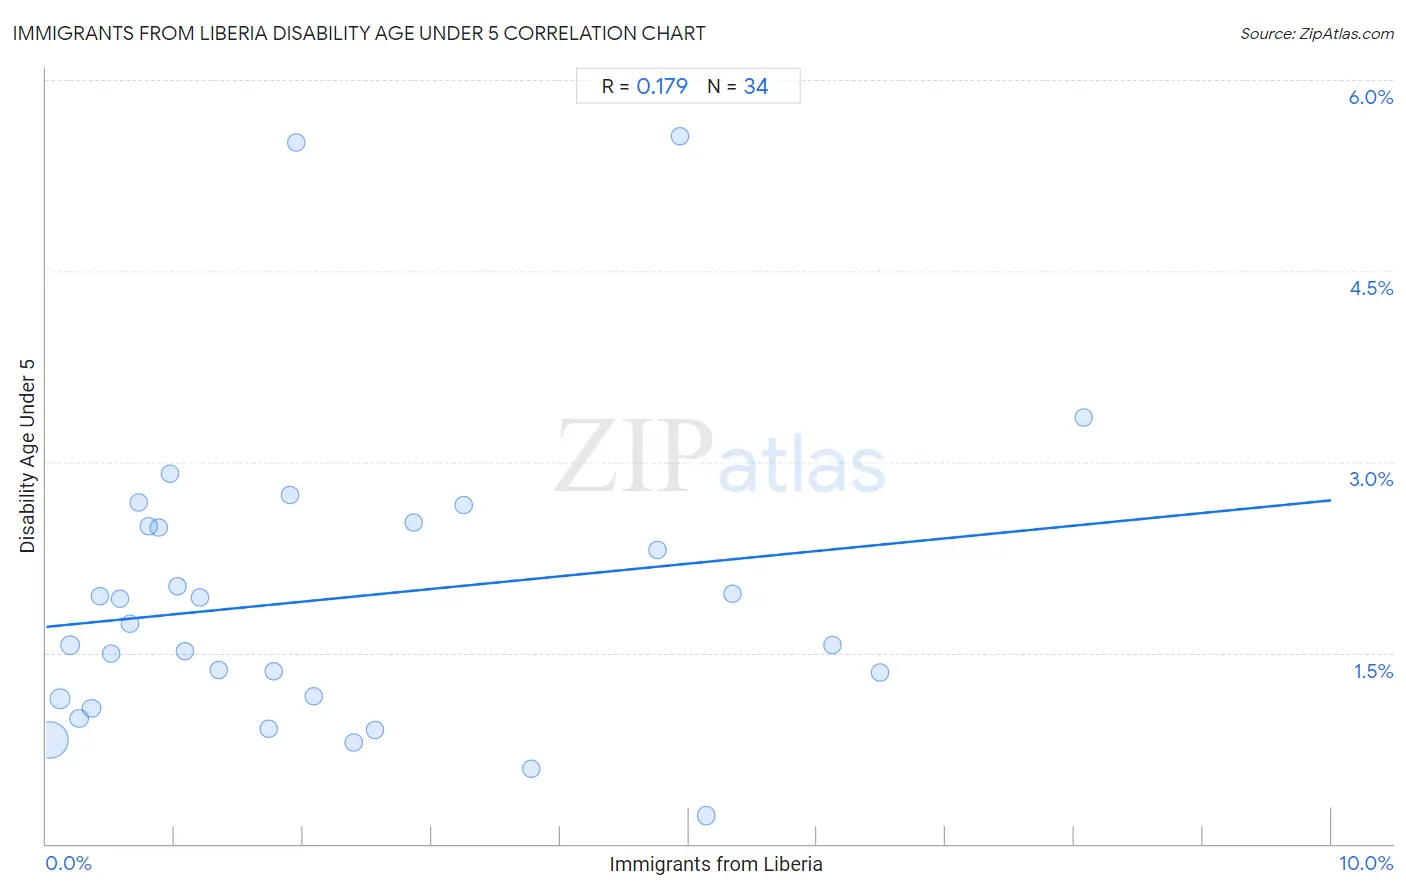
Immigrants from Liberia Disability Age Under 5 Correlation Chart

The statistical analysis conducted on geographies consisting of 98,567,169 people shows a poor positive correlation between the proportion of Immigrants from Liberia and percentage of population with a disability under the age of 5 in the United States with a correlation coefficient (R) of 0.179 and weighted average of 1.4%. On average, for every 1% (one percent) increase in Immigrants from Liberia within a typical geography, there is an increase of 0.099% in percentage of population with a disability under the age of 5.
Immigrants from Liberia Disability Age Under 5
It is essential to understand that the correlation between the percentage of Immigrants from Liberia and percentage of population with a disability under the age of 5 does not imply a direct cause-and-effect relationship. It remains uncertain whether the presence of Immigrants from Liberia influences an upward or downward trend in the level of percentage of population with a disability under the age of 5 within an area, or if Immigrants from Liberia simply ended up residing in those areas with higher or lower levels of percentage of population with a disability under the age of 5 due to other factors.

Demographics Similar to Immigrants from Liberia by Disability Age Under 5

In terms of disability age under 5, the demographic groups most similar to Immigrants from Liberia are Immigrants from Brazil (1.4%, a difference of 0.060%), Australian (1.4%, a difference of 0.14%), Immigrants from Western Europe (1.4%, a difference of 0.42%), Immigrants from Scotland (1.4%, a difference of 0.81%), and Immigrants from Hungary (1.4%, a difference of 0.86%).
DemographicsRating | RankDisability Age Under 5
Eastern Europeans
1.0
/100
|
#248
Tragic
1.4%
Bermudans
1.0
/100
|
#249
Tragic
1.4%
Africans
1.0
/100
|
#250
Tragic
1.4%
Immigrants from Hungary
1.0
/100
|
#251
Tragic
1.4%
Immigrants from Scotland
0.9
/100
|
#252
Tragic
1.4%
Australians
0.7
/100
|
#253
Tragic
1.4%
Immigrants from Brazil
0.7
/100
|
#254
Tragic
1.4%
Immigrants from Liberia
0.6
/100
|
#255
Tragic
1.4%
Immigrants from Western Europe
0.5
/100
|
#256
Tragic
1.4%
Slovenes
0.3
/100
|
#257
Tragic
1.4%
Costa Ricans
0.3
/100
|
#258
Tragic
1.4%
Immigrants from Southern Europe
0.3
/100
|
#259
Tragic
1.4%
Slavs
0.3
/100
|
#260
Tragic
1.4%
Immigrants from Netherlands
0.2
/100
|
#261
Tragic
1.4%
Immigrants from Dominica
0.2
/100
|
#262
Tragic
1.4%

Immigrants from Liberia Disability Age Under 5 Correlation Summary

MeasurementImmigrants from Liberia DataDisability Age Under 5 Data
Minimum0.027%0.22%
Maximum8.1%5.6%
Range8.0%5.3%
Mean2.2%1.9%
Median1.5%1.6%
Interquartile 25% (IQ1)0.65%1.1%
Interquartile 75% (IQ3)3.3%2.5%
Interquartile Range (IQR)2.6%1.4%
Standard Deviation (Sample)2.1%1.2%
Standard Deviation (Population)2.1%1.2%

Correlation Details

Immigrants from Liberia PercentileSample SizeDisability Age Under 5
[
0.0%
-
0.5%
]
0.027%
75,787,0400.82%
[
0.0%
-
0.5%
]
0.11%
9,578,4991.1%
[
0.0%
-
0.5%
]
0.18%
3,701,5191.6%
[
0.0%
-
0.5%
]
0.26%
2,254,3350.98%
[
0.0%
-
0.5%
]
0.35%
3,153,0671.1%
[
0.0%
-
0.5%
]
0.42%
665,3561.9%
[
0.5%
-
1.0%
]
0.50%
999,0691.5%
[
0.5%
-
1.0%
]
0.57%
289,1341.9%
[
0.5%
-
1.0%
]
0.65%
223,7291.7%
[
0.5%
-
1.0%
]
0.72%
189,2072.7%
[
0.5%
-
1.0%
]
0.80%
121,6492.5%
[
0.5%
-
1.0%
]
0.87%
78,5412.5%
[
0.5%
-
1.0%
]
0.96%
221,4042.9%
[
1.0%
-
1.5%
]
1.02%
131,0002.0%
[
1.0%
-
1.5%
]
1.08%
33,0761.5%
[
1.0%
-
1.5%
]
1.20%
426,7851.9%
[
1.0%
-
1.5%
]
1.34%
42,6291.4%
[
1.5%
-
2.0%
]
1.73%
127,3190.91%
[
1.5%
-
2.0%
]
1.77%
12,2771.4%
[
1.5%
-
2.0%
]
1.89%
49,5692.7%
[
1.5%
-
2.0%
]
1.94%
23,1015.5%
[
2.0%
-
2.5%
]
2.08%
31,7561.2%
[
2.0%
-
2.5%
]
2.40%
90,0550.79%
[
2.5%
-
3.0%
]
2.56%
42,8470.89%
[
2.5%
-
3.0%
]
2.86%
31,8122.5%
[
3.0%
-
3.5%
]
3.25%
28,9052.7%
[
3.5%
-
4.0%
]
3.78%
32,9120.59%
[
4.5%
-
5.0%
]
4.76%
21,6202.3%
[
4.5%
-
5.0%
]
4.93%
23,8045.6%
[
5.0%
-
5.5%
]
5.14%
84,9510.22%
[
5.0%
-
5.5%
]
5.34%
4,0602.0%
[
6.0%
-
6.5%
]
6.12%
32,9671.6%
[
6.0%
-
6.5%
]
6.49%
22,4931.3%
[
8.0%
-
8.5%
]
8.07%
10,6823.4%